5.3: Price Elasticity of Supply
- Page ID
- 21548
\( \newcommand{\vecs}[1]{\overset { \scriptstyle \rightharpoonup} {\mathbf{#1}} } \)
\( \newcommand{\vecd}[1]{\overset{-\!-\!\rightharpoonup}{\vphantom{a}\smash {#1}}} \)
\( \newcommand{\id}{\mathrm{id}}\) \( \newcommand{\Span}{\mathrm{span}}\)
( \newcommand{\kernel}{\mathrm{null}\,}\) \( \newcommand{\range}{\mathrm{range}\,}\)
\( \newcommand{\RealPart}{\mathrm{Re}}\) \( \newcommand{\ImaginaryPart}{\mathrm{Im}}\)
\( \newcommand{\Argument}{\mathrm{Arg}}\) \( \newcommand{\norm}[1]{\| #1 \|}\)
\( \newcommand{\inner}[2]{\langle #1, #2 \rangle}\)
\( \newcommand{\Span}{\mathrm{span}}\)
\( \newcommand{\id}{\mathrm{id}}\)
\( \newcommand{\Span}{\mathrm{span}}\)
\( \newcommand{\kernel}{\mathrm{null}\,}\)
\( \newcommand{\range}{\mathrm{range}\,}\)
\( \newcommand{\RealPart}{\mathrm{Re}}\)
\( \newcommand{\ImaginaryPart}{\mathrm{Im}}\)
\( \newcommand{\Argument}{\mathrm{Arg}}\)
\( \newcommand{\norm}[1]{\| #1 \|}\)
\( \newcommand{\inner}[2]{\langle #1, #2 \rangle}\)
\( \newcommand{\Span}{\mathrm{span}}\) \( \newcommand{\AA}{\unicode[.8,0]{x212B}}\)
\( \newcommand{\vectorA}[1]{\vec{#1}} % arrow\)
\( \newcommand{\vectorAt}[1]{\vec{\text{#1}}} % arrow\)
\( \newcommand{\vectorB}[1]{\overset { \scriptstyle \rightharpoonup} {\mathbf{#1}} } \)
\( \newcommand{\vectorC}[1]{\textbf{#1}} \)
\( \newcommand{\vectorD}[1]{\overrightarrow{#1}} \)
\( \newcommand{\vectorDt}[1]{\overrightarrow{\text{#1}}} \)
\( \newcommand{\vectE}[1]{\overset{-\!-\!\rightharpoonup}{\vphantom{a}\smash{\mathbf {#1}}}} \)
\( \newcommand{\vecs}[1]{\overset { \scriptstyle \rightharpoonup} {\mathbf{#1}} } \)
\( \newcommand{\vecd}[1]{\overset{-\!-\!\rightharpoonup}{\vphantom{a}\smash {#1}}} \)
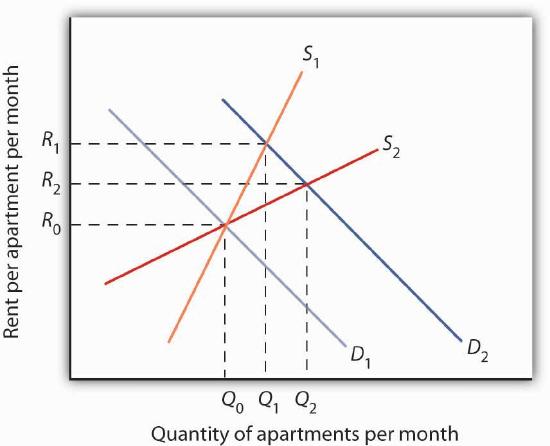
Time: An Important Determinant of the Elasticity of Supply
Elasticity of Labor Supply: A Special Application
| Product | Elasticity | Product | Elasticity | Product | Elasticity |
|---|---|---|---|---|---|
| Price Elasticity of Demand | Cross Price Elasticity of Demand | Income Elasticity of Demand | |||
| Crude oil (U.S.)* | −0.06 | Alcohol with respect to price of heroin | −0.05 | Speeding citations | −0.26 to −0.33 |
| Gasoline | −0.1 | Fuel with respect to price of transport | −0.48 | Urban Public Trust in France and Madrid (respectively) | −0.23; −0.26 |
| Speeding citations | −0.21 | Alcohol with respect to price of food | −0.16 | Ground beef | −0.197 |
| Cabbage | −0.25 | Marijuana with respect to price of heroin (similar for cocaine) | −0.01 | Lottery instant game sales in Colorado | −0.06 |
| Cocaine (two estimates) | −0.28; −1.0 | Beer with respect to price of wine distilled liquor (young drinkers) | 0.0 | Heroin | −0.00 |
| Alcohol | −0.30 | Beer with respect to price of distilled liquor (young drinkers) | 0.0 | Marijuana, alcohol, cocaine | +0.00 |
| Peaches | −0.38 | Pork with respect to price of poultry | 0.06 | Potatoes | 0.15 |
| Marijuana | −0.4 | Pork with respect to price of ground beef | 0.23 | Food** | 0.2 |
| Cigarettes (all smokers; two estimates) | −0.4; −0.32 | Ground beef with respect to price of poultry | 0.24 | Clothing*** | 0.3 |
| Crude oil (U.S.)** | −0.45 | Ground beef with respect to price of pork | 0.35 | Beer | 0.4 |
| Milk (two estimates) | −0.49; −0.63 | Coke with respect to price of Pepsi | 0.61 | Eggs | 0.57 |
| Gasoline (intermediate term) | −0.5 | Pepsi with respect to price of Coke | 0.80 | Coke | 0.60 |
| Soft drinks | −0.55 | Local television advertising with respect to price of radio advertising | 1.0 | Shelter** | 0.7 |
| Transportation* | −0.6 | Smokeless tobacco with respect to price of cigarettes (young males) | 1.2 | Beef (table cuts—not ground) | 0.81 |
| Food | −0.7 | Price Elasticity of Supply | Oranges | 0.83 | |
| Beer | −0.7 to −0.9 | Physicians (Specialist) | −0.3 | Apples | 1.32 |
| Cigarettes (teenagers; two estimates) | −0.9 to −1.5 | Physicians (Primary Care) | 0.0 | Leisure** | 1.4 |
| Heroin | −0.94 | Physicians (Young male) | 0.2 | Peaches | 1.43 |
| Ground beef | −1.0 | Physicians (Young female) | 0.5 | Health care** | 1.6 |
| Cottage cheese | −1.1 | Milk* | 0.36 | Higher education | 1.67 |
| Gasoline** | −1.5 | Milk** | 0.5 | ||
| Coke | −1.71 | Child care labor | 2 | ||
| Transportation | −1.9 | ||||
| Pepsi | −2.08 | ||||
| Fresh tomatoes | −2.22 | ||||
| Food** | −2.3 | ||||
| Lettuce | −2.58 | ||||
| Note: *=short-run; **=long-run | |||||
Key Takeaways
Try It!