Our next step is to quantify the amplitude of the N400 component for the unrelated and related target words so that we can perform statistical analyses (which we will do in the next exercise). We need N400 amplitude values from each individual participant, so make sure that you still have the single-participant ERPsets loaded in ERPLAB (you can check this in the ERPsets menu).
We’ll quantify the amplitude of the N400 as the mean voltage between 300 and 500 ms. Let’s be concrete about what this means. These data are sampled at 200 Hz, which means that there is one voltage value every 5 ms. This gives us 21 values between 300 and 500 ms (not 20, because we include the value at 300 ms and the value at 500 ms, plus the values between them). We calculate the mean voltage by summing together these 21 values and dividing by 21. It’s that simple. If you want to know why we quantify the amplitude of an ERP component this way, see Chapter 9 in Luck (2014). We’ll apply this procedure to the averaged ERP waveforms from each participant, once for the unrelated targets and once for the related targets. Initially, we’ll just do this for the CPz electrode site.
Scoring Versus Measuring the Amplitude or Latency of an ERP Component
When researchers apply an algorithm to an ERP waveform to quantify the amplitude or latency of an ERP component, we often say that we’re measuring the amplitude or latency. But I don’t really like this terminology. An ERP component is a hypothetical entity in the brain, and we’re obtaining a value from a scalp signal that typically consists of a mixture of many components. As a result, it’s not really a measurement of the component. Also, it seems weird to use the term “measuring” when we’re taking values that were already measured (the EEG voltages) and recombining them in a new way. So, it seems perfectly natural to say that we’re “measuring the EEG,” but it seems odd to say that we’re “measuring the amplitude of the N400 component.”
I prefer to use the term score. That is, we’re “scoring the amplitude of the N400 component,” and we obtain “N400 amplitude scores.” I started using this terminology just a couple years ago, so you’ll see the term measurement rather than score in many of my writings and in ERPLAB Toolbox.
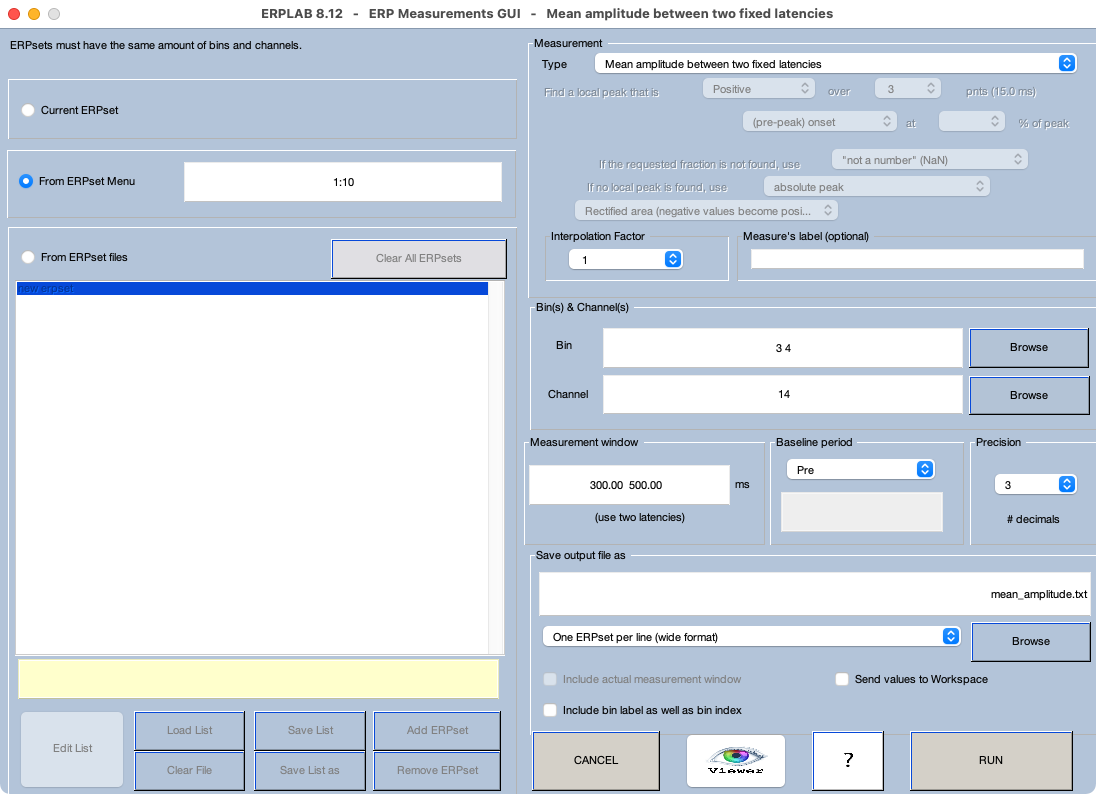
To score the N400 amplitude as the mean voltage between 300 and 500 ms, select EEGLAB > ERPLAB > ERP Measurement Tool. You’ll see the big complicated window shown in Screenshot 3.6. The left side of the window is used to indicate which ERPsets should be measured. Our ERPsets are loaded into ERPLAB already, so select From ERPset Menu and indicate the ERPset numbers for the 10 single-participant ERPsets. In the example shown in Screenshot 3.6, these are ERPsets 1-10, so we specify it as 1:10 (or, equivalently, 1 2 3 4 5 6 7 8 9 10). If we didn’t want to load the ERPsets into ERPLAB, we could instead provide a list of the filenames using From ERPset files.
The right side of the window is used to specify how we want to score the data. The measurement type should be set to Mean amplitude between two fixed latencies. In a later chapter, we’ll go over the other scoring methods (including peak amplitude and peak latency, which are widely used but often inferior to the other options provided by ERPLAB). We want to obtain the scores from Bins 3 and 4 and from Channel 14 (CPz), so make sure those are specified in the Bin(s) & Channel(s) section. The Measurement window field should be 300 500 (with a space between the two numbers) to indicate the starting and ending latencies of the time window for computing the mean amplitude score.
The Baseline period should be set to pre, which indicates that the entire prestimulus period should be used as the baseline. You already baseline-corrected the data during the epoching process, but it doesn’t hurt to re-baseline the data just to be sure.
Screenshot 3.6
In the Save output file as section, you should use mean_amplitude.txt as the name of the file used to store the scores. Select One ERPset per line (wide format), which will produce a format that works well with statistical packages that expect each line to be one participant and each column to be a different score from that participant.
Most people would just click RUN at this point to obtain the amplitude scores. But there is another very important step, which is to click the Viewer button. This will allow you to see the scores for each ERP waveform, which is very important for making sure that the scoring procedure is working in a sensible manner. For example, a measurement window that seems appropriate when you’re looking at grand average waveforms may not actually work well on the single-participant waveforms.
The Viewer is shown in Screenshot 3.7. I’ve set it to show all the bins. You can scroll through the different files (participants) to see how the scoring is working for all the waveforms. From my perspective, everything looks like it’s working fine. Once you’re done, click the Measurement Tool button to go back to the Measurement Tool. Then you can click RUN to obtain the amplitude scores and save them in the text file.
Screenshot 3.7
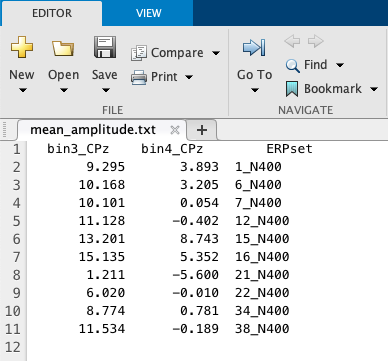
If you look in the Current Folder section of the Matlab GUI, you’ll see that a file named mean_amplitude.txt has been created. Double-click on it to open it in the Matlab text editor. It should look something like this:
The first column has the amplitude scores from Bin 3 (related targets) and the second column has the scores from Bin 4 (unrelated targets). The third column is the name of the ERPset, which tells you which subject was measured on that line. You can see that every single participant has a more negative (less positive) voltage for the unrelated trials than for the related trials.