Over the years, I’ve found that applying filters to artificial waveforms has really helped me understand how filters work and whether they might be significantly distorting my data. In fact, I first got interested in how filters work when I used an inappropriate filter and discovered my error by filtering an artificial waveform (see text box below). As a result, I always encourage other people to trying filtering artificial waveforms, especially if they’re not going to follow my standard advice about filtering from 0.1 to 20 or 30 Hz. I even created some example artificial waveforms to go along with the filtering chapter in Luck (2014) and made them available online on the publisher’s web site. Here, I’m going to explain how you can make artificial waveforms in Excel and import them into ERPLAB.
How I Avoided Embarrassment by Filtering an Artificial Waveform
When I was in grad school, I had the good fortune to spend quite a bit of time with Bob Galambos, who was the mentor of my own mentor, Steve Hillyard. Bob had retired many years before, but he still came to lab meetings from time to time. He was an amazing scientist—among other things, he and his buddy Donald Griffin were the people who first demonstrated that bats navigate using echolocation (Griffin & Galambos, 1941). I learned a lot from having him around.
One day, Bob and I cooked up an idea for an experiment that involved recording both ERPs and the electroretinogram (ERG; see the next text box). Bob volunteered to be the subject. Unfortunately, although he was a great scientist, he was not a very good subject, and the data were very noisy.
That night, I processed the data, and the recordings were a mess. In an attempt to clean up the data, I applied a very strong filter (something like 2-8 Hz, 48 dB/octave). Not only did it remove the noise, it revealed that the stimuli had triggered oscillations in both the ERPs and the ERG. Oscillations were just becoming a hot topic, and I thought I had discovered something new and important. I would surely become famous!
But then I noticed something: The recordings included square-wave calibration pulses, and the filtered calibration pulses contained the same oscillations I was seeing in the ERPs and ERG. That made me realize that the oscillations were artifactually induced by the filter and were not signals that were present in the data. I asked one of the senior grad students, Marty Woldorff, about the oscillations, and he explained how very sharp filters can produce artifactual oscillations. He explained that a filter is like a bell: You put a brief input into a bell (by striking the clapper), and the output of the bell is an oscillation.
That experience of seeing how a filter impacted an artificial signal (the calibration pulse) got me interested in learning more about filters. And it saved me from the embarrassment I would have surely felt if I had tried to write a paper claiming that I had discovered oscillations in the ERPs and ERG.
I created all of the artificial waveforms for this chapter in Excel. You can find a copy of the spreadsheet file, which is named artificial_data.xlsx, in the Chapter_4 folder. If you don’t have Excel, you can import it into Google Sheets. The first tab has the waveforms, with a separate column for each waveform. I created the ERP-like waveform shown in Screenshot 4.1 by summing together three simulated ERP components, each of which is just one cycle of a cosine function. You can see the formulas in the spreadsheet. You’ll also see columns for creating 60-Hz noise and white noise. There are also columns for impulses at different times.
The other sheets are designed to pull out the waveforms for the separate ERPset files that I created for the exercises. These sheets just copy the relevant values from the first sheet (sometimes with modifications). To create an ERPset from a given sheet, you save the sheet as a text file and then import it into ERPLAB.
As an example, let’s create a text file for the waveforms sheet, which contains the waveforms shown in Screenshot 4.1. Go to this sheet in Excel and select Excel > File > Save as. Then select Tab delimited Text (.txt) as the file format and save the file using waveforms.txt as the filename. Note that with this file format, Excel saves only the current sheet as the text file.
The resulting text file is organized with the leftmost column containing the latency of each sample point and the other column(s) containing the voltage values for the individual electrode sites. With this approach, you can only have one bin per text file.
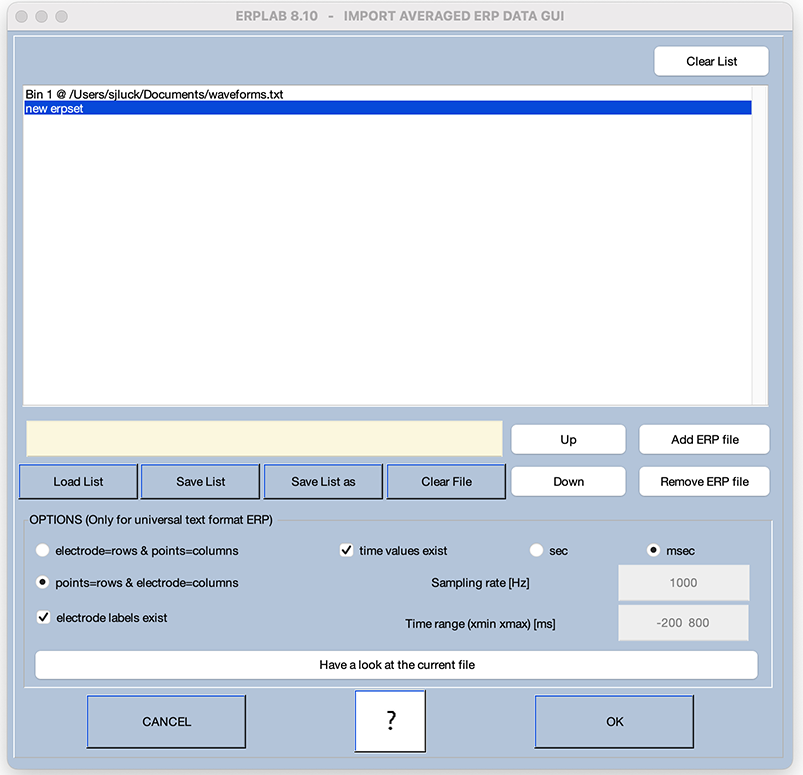
Now let’s import the text file into ERPLAB as an ERPset. Quit and restart EEGLAB, and then select EEGLAB > ERPLAB > Export and Import ERP > Import ERP from text (universal). This will bring up the window shown in Screenshot 4.14. The import tool allows you to specify multiple text files, each which will be stored as a separate bin. However, we’re going to just import one text file and create one bin. To do this, click the Add ERP file button and select the waveforms.txt file that you created in the previous step. You’ll then see it in the list of text files to be imported, designated as Bin 1 (see Screenshot 4.14).
Screenshot 4.14
Now we need to provide the import tool with some information about the format of the text file. For the overall structure of the file, click the points=rows & electrodes=columns option (which indicates that each line is a time point and each column is an electrode). Check the electrode labels exist box, because the first line of the text file contains the labels for the electrodes. Check the time values exist box, because the leftmost column contains the time values. If we didn’t have the time values in the text file, we could instead indicate the sampling rate and time range, and the import tool would figure out the latency for each time point.
Once everything is set as shown in the screenshot, click OK. You’ll then see the standard dialog box for naming and saving the new ERPset. You can name it waveforms. You don’t need to save it, because you already have the file with these waveforms in the Chapter_4 folder (waveforms.erp). Finally, you should plot the waveforms and verify that they look like those in Screenshot 4.1.
That’s it! Now you can use Excel to create any kind of artificial waveform you like and then import it into ERPLAB. You can then see how the waveform is changed by different filter settings. As I said before, you’ll definitely want to do this if you filter more aggressively than my standard recommendation of 0.1 to 30 Hz.
The Electroretinogram (ERG)
The ERG is an EEG-like signal generated by the retina. I have a soft spot in my heart for the ERG, because it’s how I got started in electrophysiology. I took a year off in the middle of college and got a job working as a research assistant for Martha Neuringer at the Oregon National Primate Research Center. I worked on a study of the effects of omega-3 fatty acid deprivation on visual system development in infant rhesus monkeys.
Martha recorded the ERG as one of our outcome measures. She anaesthetized the monkeys and then put a special-purpose electrode on the cornea to record the ERG signal. This signal was then amplified and recorded on a special tape recorder. We would then drive to a different lab 10 miles away, where we used a gigantic computer to digitize the signals, average across trials, and a quantify the amplitude of the ERG signal. This was very time-consuming, so I was tasked with writing software for an Apple II—the first mainstream personal computer—that would allow us to directly record the ERG (onto floppy disks!) and do the averaging and analysis. This started me down the road to ERP research.
Bob Galambos taught me a trick for more easily recording the ERG from humans using small EEG electrodes placed on the lower eyelids rather than an electrode placed directly on the eye. The trick is to place one electrode under each eye and put an opaque patch over one eye. When a visual stimulus is presented, you get ERG activity plus EEG activity from the electrode under the unpatched eye, and you get nearly identical EEG activity from the electrode unpatched eye, but without the ERG activity. If you use the electrode under the unpatched eye as the active site and the electrode under the patched eye as the reference site, the EEG (which is nearly identical at both electrodes) is subtracted away, leaving just the ERG. This was one of many things I learned from Bob.