Social Sci LibreTexts

7.2: Design of the Mismatch Negativity (MMN) Experiment

  • Page ID
    87968
  • \( \newcommand{\vecs}[1]{\overset { \scriptstyle \rightharpoonup} {\mathbf{#1}} } \) \( \newcommand{\vecd}[1]{\overset{-\!-\!\rightharpoonup}{\vphantom{a}\smash {#1}}} \)\(\newcommand{\id}{\mathrm{id}}\) \( \newcommand{\Span}{\mathrm{span}}\) \( \newcommand{\kernel}{\mathrm{null}\,}\) \( \newcommand{\range}{\mathrm{range}\,}\) \( \newcommand{\RealPart}{\mathrm{Re}}\) \( \newcommand{\ImaginaryPart}{\mathrm{Im}}\) \( \newcommand{\Argument}{\mathrm{Arg}}\) \( \newcommand{\norm}[1]{\| #1 \|}\) \( \newcommand{\inner}[2]{\langle #1, #2 \rangle}\) \( \newcommand{\Span}{\mathrm{span}}\) \(\newcommand{\id}{\mathrm{id}}\) \( \newcommand{\Span}{\mathrm{span}}\) \( \newcommand{\kernel}{\mathrm{null}\,}\) \( \newcommand{\range}{\mathrm{range}\,}\) \( \newcommand{\RealPart}{\mathrm{Re}}\) \( \newcommand{\ImaginaryPart}{\mathrm{Im}}\) \( \newcommand{\Argument}{\mathrm{Arg}}\) \( \newcommand{\norm}[1]{\| #1 \|}\) \( \newcommand{\inner}[2]{\langle #1, #2 \rangle}\) \( \newcommand{\Span}{\mathrm{span}}\)\(\newcommand{\AA}{\unicode[.8,0]{x212B}}\)
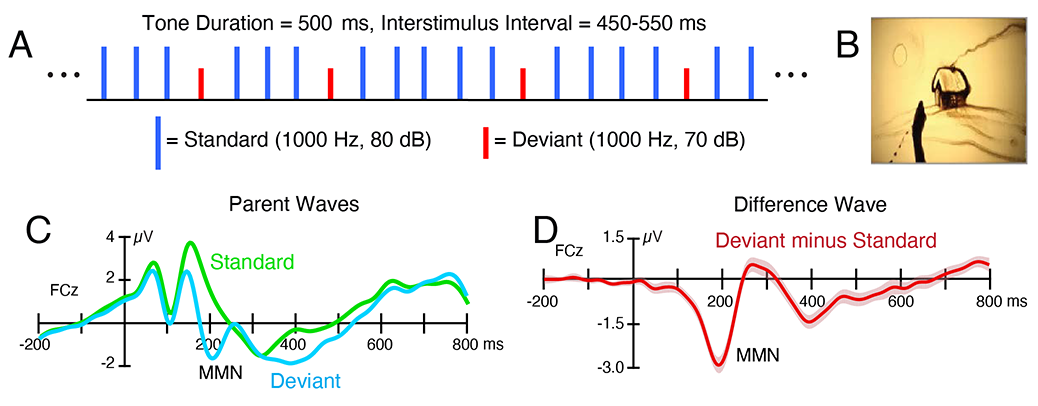
    The exercises in this chapter and the chapters on artifact rejection and correction will use data from the ERP CORE MMN experiment, and this section will provide a brief overview of the experimental design and main results.

    As illustrated in Figure 7.1.A, the experiment involved a sequence of frequently occurring standard tones (1000 Hz, 80 dB, p = .8) and rare deviant tones that were slightly softer (1000 Hz, 70 dB, p = .2). Each tone was presented for 100 ms, and successive tones were separated by a silent interstimulus interval of 450-550 ms. The MMN does not require active attention, so the tones were task-irrelevant. Instead, the participants were instructed to simply watch a small silent movie of a sand drawing in the middle of the computer monitor (Figure 7.1.B). This kept the participants awake and alert, minimizing alpha-band EEG oscillations. The movie was quite small to avoid large eye movements. Additional methodological details can be found in Kappenman et al. (2021).

    The grand average ERPs for the standards and the deviants are shown in Figure 7.1.C. The waveforms are shown for the FCz channel, where the MMN is typically largest. The MMN can be seen as a more negative voltage for the deviants than for the standards from approximately 125–225 ms. The MMN is typically isolated from the other overlapping ERP components by means of a deviant-minus-standard difference wave, which is shown in Figure 7.1.D.

    1-small MMN_Paradigm.png
    Figure 7.1. Experimental paradigm and results from the ERP CORE Mismatch Negativity experiment. (A) Example sequence of standard tones (p=.8) and deviant tones (p=.2). The tones were task-irrelevant. (B) One frame of the silent movie that participants watched while the tones were playing. (C) Grand average ERP waveforms elicited by the standard and deviant tones, averaged over all 40 participants. (D) Grand average difference wave, which was created by subtracting the averaged ERP waveform for the deviant trials from the averaged ERP waveform for the standard trials.


    This page titled 7.2: Design of the Mismatch Negativity (MMN) Experiment is shared under a CC BY 4.0 license and was authored, remixed, and/or curated by Steven J Luck directly on the LibreTexts platform.