Long Run Supply Decisions
The long-run supply curve in a perfectly competitive market has three parts; a downward sloping curve, a flat portion, and an upwards sloping curve.
learning objectives
- Describe the long-run market supply curve of a perfectly competitive market
The long-run supply curve of a market is the sum of a series of short-run supply curves in the market (). Prior to determining how the long-run supply curve looks, its important to understand short-run supply curves.
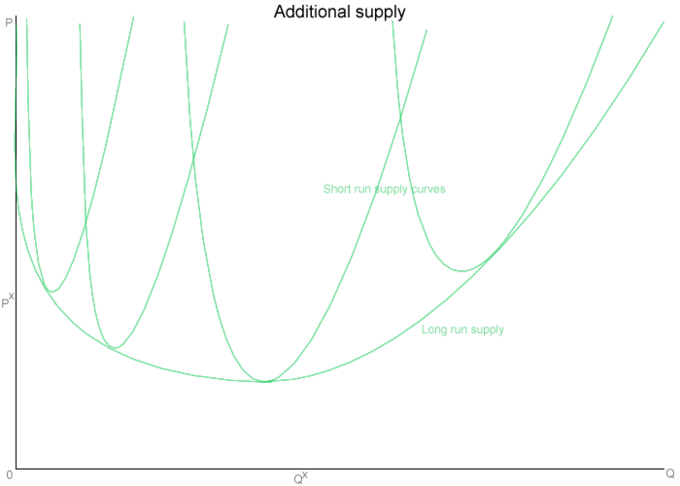
Long-run Supply Curve: As the chart demonstrates, a market’s long-run supply curve is the sum of a series of short-run supply curves in a given market.
Short-Run Supply Curves
While most people focus on the second half of a supply curve, which has a positive slope, that is not how the supply and pricing decision works in practice. As you can see from the chart, the first items that are produced start out with a very high price. This is because it is very expensive for a producer to manufacture one item. The producer has to incur fixed costs, such as learning the necessary skills to produce the item and purchasing new tools. These initial fixed costs make the cost of producing one good very expensive.
However, as more goods are produced, those initial fixed costs are spread out over more items. This decreases the price of per unit of each good produced for a period of time. As a result, in the early stages of production the supply curve is sloping downward as you can see in the chart. This period of supply is known as “increasing returns to scale,” because a proportional increase in resources yields a greater proportional increase in output.
At some point, the per unit share of fixed costs becomes less than the variable costs of producing one more item. Variable expenses include purchasing more raw materials to manufacture another item. When this occurs, the supply curve slopes upward. Thus, in the short-run, a market’s supply curve looks like an oddly shaped “u.” This period of supply is known as “decreasing returns to scale,” because a proportional increase in resources yields a smaller proportional increase in its amount in output. Between these two periods is the “constant returns to scale,” where a proportion increase in resources yields an equal proportional increase in the amount of output.
Long-Run Supply Curves
A market’s long-run supply curve is the sum of the market’s short-run supply curves taken at different points of time. As a result, a long-run supply curve for a market will look very similar to short-run supply curves for a market, but more stretched out; the long-term market curve will a wider “u.” A long-run supply curve connects the points of constant returns to scales of a markets’ short-run supply curves.; the bottom of each short-term supply curve’s “u.” Consider the attached chart.
The first short-run supply curve reflects what happens when a firm enters into a new market for the first time. When it does, it should make an economic profit. In a perfectly competitive market, firms can freely enter and exit an industry. When other business notice that the first firm is making it profit, they will enter the market to capture some of that profit and because there is nothing preventing them from doing so. In the early stages of the market, where only one or a few firms are producing goods, the market experiences increasing returns to scale, similar to what an individual firm would experience.
As more firms enter the market and time passes, production yields less and less returns in comparison to the production. Eventually the market reaches a state of constant returns to scale. How long this period of constant returns is varies by industry. Agriculture has a longer period of constant returns while technology has shorter.
Eventually, production of goods in a market yields less of a return than the amount of goods that go into product, which causes the market to enter into a period of decreasing returns to scale and the market’s supply curve slopes upward.
Long Run Market Equilibrium
The long-run equilibrium of a perfectly competitive market occurs when marginal revenue equals marginal costs, which is also equal to average total costs.
learning objectives
- Describe the long-run market equilibrium
The long-run is the period of time where there are no fixed variables of production. As with any other economic equilibrium, it is defined by demand and supply.
Demand
In a perfect market, demand is perfectly elastic. The demand curve also represents marginal revenue, which is important to remember later when we calculate quantity supplied. That means regardless of how much is produced by the suppliers, the price will remain constant.
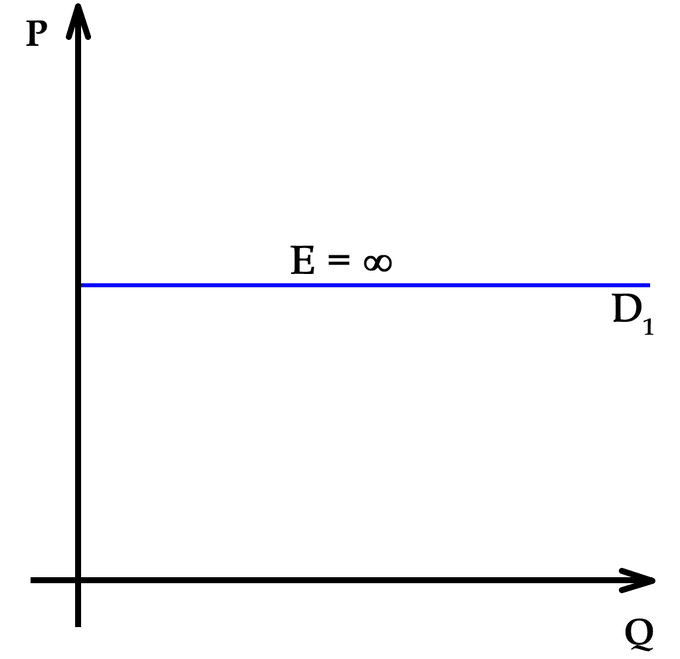
Perfectly Elastic Demand: In a perfectly competitive market, demand is perfectly elastic.
Supply
In a perfectly competitive market, it is assumed that all of the firms participating in production are trying to maximize their profits. So a firm will produce goods until the marginal costs of production equal the marginal revenues from sales. In a perfectly competitive market in the long-term, this is taken one step further. In a perfectly competitive market, long-run equilibrium will occur when the marginal costs of production equal the average costs of production which also equals marginal revenue from selling the goods. So the equilibrium will be set, graphically, at a three-way intersection between the demand, marginal cost and average total cost curves.
Repercussions of Equilibrium
A perfectly competitive market in equilibrium has several important characteristics.
- Firms can’t make economic profit; the best they can do is break even so that their revenues equals their costs.
- The market is productively and allocatively efficient. This means that not only is the market using all of its resources efficiently, it is using its resources in a way that maximizes the social welfare.
- Economic surplus is maximized, which means there is no deadweight loss. Attempting to improve the conditions of one group would harm the interests of the other.
Productive Efficiency
Productive efficiency occurs when production of a good is achieved at the lowest resource cost possible, given the level of production of other goods.
Learning objectives
- Describe the efficiency of production in perfectly competitive markets
Productive efficiency occurs when the economy is getting maximum output from its resources. The concept is illustrated on a production possibility frontier (PPF) where all points on the curve are points of maximum productive efficiency (i.e., no more output can be achieved from the given inputs). An equilibrium may be productively efficient without being allocatively efficient. In other words, just because a market maximizes the output it generates, that doesn’t mean that social welfare is maximized.
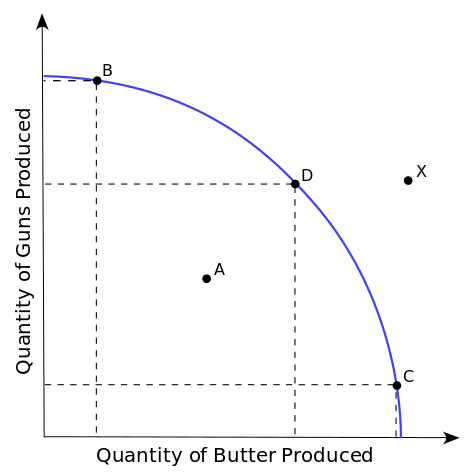
Production Possibilities on Frontier Curve: This chart shows production possibilities for production of guns and butter. Points B, C, and D are productively efficient and point A is not. Point X is only possible if the means of production improve.
Production efficiency occurs when production of one good is achieved at the lowest resource (input) cost possible, given the level of production of the other good(s). Another way to define productive efficiency is that it occurs when the highest possible output of one good is produced, given the production level of the other good(s). In long-run equilibrium for perfectly competitive markets, productive efficiency occurs at the base of the average total cost curve, or where marginal cost equals average total cost. Productive efficiency requires that all firms operate using best-practice technological and managerial processes. By improving these processes, an economy or business can extend its production possibility frontier outward, so that efficient production yields more output.
Monopolistic companies may not be productively efficient because companies operating in a monopoly have less of an incentive to maximize output due to lack of competition. However, due to economies of scale, it may be possible for the profit-maximizing level of output of monopolistic companies to occur with a lower price to the consumer than perfectly competitive companies. So, consumers may pay less with a monopoly, but a monopolistic market would not achieve productive efficiency.
Allocative Efficiency
Free markets iterate towards higher levels of allocative efficiency, aligning the marginal cost of production with the marginal benefit for consumers.
Learning objectives
- Explain resource allocation in terms of consumer and producer surplus and market equilibrium
Allocative efficiency is the degree to which the marginal benefits consumers receive from goods are as close as possible to the marginal costs of producing them. At the optimal level of allocative efficiency in a given market, the last unit’s marginal cost would be perfectly equal to the marginal benefit it provides consumers, resulting in no deadweight loss.
The amount of value generated in a market that efficient equals the social value of the produced output minus the value of resources used in production. Optimal efficiency is higher in free markets, though reality always has some limitations and imperfections to detract from completely perfect allocative efficiency. Markets are not efficient if it is subject to:

Final goods: When an economy has allocative efficiency, it produces goods and services that have the highest demand and that society finds most desirable. For example, for the U.S. to achieve an allocative efficient market, it would need to produce a lot of coffee.
- monopolies,
- monopsonies,
- externalities,
- public goods which construe market failure, or
- price controls which construe government failure in addition to taxation.
Allocative efficiency is the main means to measure the degree markets and public policy improve or harm society or other specific subgroups.
Although there are different standards of evaluation for the concept of allocative efficiency, the basic principle asserts that in any economic system, choices in resource allocation produce both “winners” and “losers” relative to the choice being evaluated. The principles of rational choice, individual maximization, utilitarianism, and market theory further suppose that the outcomes for winners and losers can be identified, compared, and measured.
Under these basic premises, the goal of maximizing allocative efficiency can be defined according to some neutral principle where some allocations are objectively better than others. For example, an economist might say that a change in policy increases allocative efficiency as long as those who benefit from the change (winners) gain more than the losers lose.
Entry and Exit of Firms
The absence of barriers of entry and exit is a necessary condition for a market to be perfectly competitive.
Learning objectives
- Explain the entry and exit of firms in perfectly competitive markets.
Barriers to entry and exit are an important characteristics to consider when analyzing a market. In perfectly competitive markets, there are no barriers to entry or exit. This is a critical characteristic of perfectly competitive markets because firms are able to freely enter and exit in response to potential profit. Therefore, in the long-run firms cannot make economic profit but can only break even.
However, in most other types of markets barriers do exist. These types of barriers, defined below, prevent free entry to or exit from markets.
Barriers to Entry
Barriers to entry are obstacles that make it difficult to enter a given market. The term can refer to hindrances a firm faces in trying to enter a market or industry. Barriers can also be obstacles an individual faces in trying to gain entrance to a profession, such as education or licensing requirements.
Because barriers to entry protect incumbent firms and restrict competition in a market, they can distort prices. Monopolies are often aided by barriers to entry. Examples of barriers to entry include:
- Capital: need the capital to start up such as equipment, building, and raw materials.
- Customer loyalty: Large incumbent firms may have existing customers loyal to established products. The presence of established strong brands within a market can be a barrier to entry in this case.
- Economy of scale: The increase in efficiency of production as the number of goods being produced increases. Cost advantages can sometimes be quickly reversed by advances in technology.
- Intellectual property: Potential entrant requires access to equally efficient production technology as the combatant monopolist in order to freely enter a market. Patents give a firm the legal right to stop other firms producing a product for a given period of time, and so restrict entry into a market. Patents are intended to encourage invention and technological progress by guaranteeing proceeds as an incentive. Similarly, trademarks and service marks may represent a kind of entry barrier for a particular product or service if the market is dominated by one or a few well-known names.
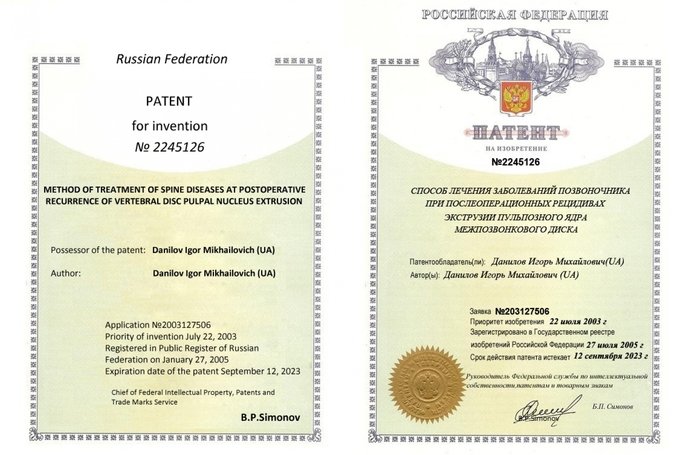
A patent is an example of an intangible asset with a limited life: Patents are an example of intellectual property. If a firm does not own intellectual property relevant to the industry, that could prove to be a significant barrier to entry into that market.
Barriers to Exit
Barriers to exit are obstacles in the path of a firm which wants to leave a given market or industrial sector. These obstacles often cost the firm financially to leave the market and may prohibit it doing so. If the barriers of exit are significant; a firm may be forced to continue competing in a market, as the costs of leaving may be higher than those incurred if they continue competing in the market. The factors that may form a barrier to exit include:
- High investment in non-transferable fixed assets: This is particularly common for manufacturing companies that invest heavily in capital equipment which is specific to one task.
- High redundancy costs: If a company has a large number of employees, employees with high salaries, or contracts with employees which stipulate high redundancy payments, then the firm may face significant cost if it wishes to leave the market.
- Other closure costs: Contract contingencies with suppliers or buyers and any penalty costs incurred from cutting short tenancy agreements.
- Potential upturn:Firms may be influenced by the potential of an upturn in their market that may reverse their current financial situation.
Key Points
- The long-run supply curves of a market is the sum of a series of that market’s short-run supply curves.
- Most supply curves are composed of three periods of production: a period of increasing returns to scale, constant returns to scale, and decreasing returns to scale.
- A long-run supply curve connects the points of constant returns to scales of a markets’ short-run supply curves.
- In a perfectly competitive market, demand is perfectly elastic. This means the demand curve is a horizontal line.
- Once equilibrium has been achieved, firms in a perfectly competitive market can’t achieve economic profit; it can only break even.
- A perfectly competitive market in equilibrium is productively and allocatively efficient.
- An equilibrium may be productively efficient without being allocatively efficient.
- Another way to define productive efficiency is that it occurs when the highest possible output of one good is produced, given the production level of the other good(s).
- Productive efficiency requires that all firms operate using best-practice technological and managerial processes.
- Allocative efficiency occurs where a good or service’s marginal benefit is equal to its marginal cost. At this point the social surplus is maximized with no deadweight loss.
- Free markets that are perfectly competitive are generally allocatively efficient.
- Allocative efficiency is the main means to measure the degree markets and public policy improve or harm society or other specific subgroups.
- Under these basic premises, the goal of maximizing allocative efficiency can be defined according to some neutral principle where some allocations are objectively better than others.
- Barriers to entry are obstacles that make it difficult to enter a given market. The term can refer to hindrances a firm faces in trying to enter a market or industry. Barriers can be obstacles an individual faces in trying to enter into a profession, such as education or licensing requirements.
- Because firms are able to freely enter and exit in response to potential profit, this means that in the long-run firms cannot make economic profit; they can only break even.
- Barriers to exit are obstacles in the path of a firm which wants to leave a given market or industrial sector.
Key Terms
- constant returns to scale: Changes in output resulting from a proportional change in all inputs (where all inputs increase by a constant factor). If output increases by that same proportional change then there are constant returns to scale (CRS).
- decreasing returns to scale: Changes in output resulting from a proportional change in all inputs (where all inputs increase by a constant factor). If output increases by less than the proportional change then there are decreasing returns to scale.
- increasing returns to scale: The characteristic of production in which output increases by more than the proportional increase in inputs.
- long-run: The conceptual time period in which there are no fixed factors of production.
- Productive Efficiency: An economic status that occurs when when the highest possible output of one good is produced, given the production level of the other good(s).
- Allocative efficiency: A state of the economy in which production represents consumer preferences; in particular, every good or service is produced up to the point where the last unit provides a marginal benefit to consumers equal to the marginal cost of producing.
- Barriers to entry: Obstacles that make it difficult to enter a given market. The term can refer to hindrances a firm faces in trying to enter a market or industry, such as government regulation, or a large, established firm taking advantage of economies of scale.
- barriers to exit: Obstacles in the path of a firm that want to leave a market or industrial sector.
LICENSES AND ATTRIBUTIONS
CC LICENSED CONTENT, SPECIFIC ATTRIBUTION
- Long run and short run. Provided by: Wikipedia. Located at: en.Wikipedia.org/wiki/Long_run_and_short_run. License: CC BY-SA: Attribution-ShareAlike
- Perfect competition. Provided by: Wikipedia. Located at: en.Wikipedia.org/wiki/Perfect_competition. License: CC BY-SA: Attribution-ShareAlike
- Principles of Economics/Economies of Scale. Provided by: Wikibooks. Located at: en.wikibooks.org/wiki/Princip...ong_run_supply. License: CC BY-SA: Attribution-ShareAlike
- Principles of Economics/Supply. Provided by: Wikibooks. Located at: en.wikibooks.org/wiki/Princip...ong_run_supply. License: CC BY-SA: Attribution-ShareAlike
- Returns to scale. Provided by: Wikipedia. Located at: en.Wikipedia.org/wiki/Returns_to_scale. License: CC BY-SA: Attribution-ShareAlike
- increasing returns to scale. Provided by: Wikipedia. Located at: en.Wikipedia.org/wiki/increas...s%20to%20scale. License: CC BY-SA: Attribution-ShareAlike
- constant returns to scale. Provided by: Wikipedia. Located at: en.Wikipedia.org/wiki/constan...s%20to%20scale. License: CC BY-SA: Attribution-ShareAlike
- decreasing returns to scale. Provided by: Wikipedia. Located at: en.Wikipedia.org/wiki/decreas...s%20to%20scale. License: CC BY-SA: Attribution-ShareAlike
- HouSupply5. Provided by: Wikibooks. Located at: en.wikibooks.org/wiki/File:HouSupply5.png. License: CC BY-SA: Attribution-ShareAlike
- Long run. Provided by: Wikipedia. Located at: en.Wikipedia.org/wiki/Long_run. License: CC BY-SA: Attribution-ShareAlike
- Perfect competition. Provided by: Wikipedia. Located at: en.Wikipedia.org/wiki/Perfect...tion%23Results. License: CC BY-SA: Attribution-ShareAlike
- long-run. Provided by: Wikipedia. Located at: en.Wikipedia.org/wiki/long-run. License: CC BY-SA: Attribution-ShareAlike
- HouSupply5. Provided by: Wikibooks. Located at: en.wikibooks.org/wiki/File:HouSupply5.png. License: CC BY-SA: Attribution-ShareAlike
- Elasticity-elastic. Provided by: Wikipedia. Located at: en.Wikipedia.org/wiki/File:El...ty-elastic.png. License: CC BY-SA: Attribution-ShareAlike
- Principles of Economics/Allocation. Provided by: Wikibooks. Located at: en.wikibooks.org/wiki/Princip...ive_Efficiency. License: CC BY-SA: Attribution-ShareAlike
- Productive efficiency. Provided by: Wikipedia. Located at: en.Wikipedia.org/wiki/Productive_efficiency. License: CC BY-SA: Attribution-ShareAlike
- Productive Efficiency. Provided by: Wikipedia. Located at: en.Wikipedia.org/wiki/Productive%20Efficiency. License: CC BY-SA: Attribution-ShareAlike
- HouSupply5. Provided by: Wikibooks. Located at: en.wikibooks.org/wiki/File:HouSupply5.png. License: CC BY-SA: Attribution-ShareAlike
- Elasticity-elastic. Provided by: Wikipedia. Located at: en.Wikipedia.org/wiki/File:El...ty-elastic.png. License: CC BY-SA: Attribution-ShareAlike
- Production Possibilities Frontier Curve. Provided by: Wikipedia. Located at: en.Wikipedia.org/wiki/File:Pr...tier_Curve.svg. License: CC BY-SA: Attribution-ShareAlike
- Principles of Economics/Allocation. Provided by: Wikibooks. Located at: en.wikibooks.org/wiki/Princip...ive_Efficiency. License: CC BY-SA: Attribution-ShareAlike
- Allocative efficiency. Provided by: Wikipedia. Located at: en.Wikipedia.org/wiki/Allocative_efficiency. License: CC BY-SA: Attribution-ShareAlike
- Allocative efficiency. Provided by: Wikipedia. Located at: en.Wikipedia.org/wiki/Allocative%20efficiency. License: CC BY-SA: Attribution-ShareAlike
- HouSupply5. Provided by: Wikibooks. Located at: en.wikibooks.org/wiki/File:HouSupply5.png. License: CC BY-SA: Attribution-ShareAlike
- Elasticity-elastic. Provided by: Wikipedia. Located at: en.Wikipedia.org/wiki/File:El...ty-elastic.png. License: CC BY-SA: Attribution-ShareAlike
- Production Possibilities Frontier Curve. Provided by: Wikipedia. Located at: en.Wikipedia.org/wiki/File:Pr...tier_Curve.svg. License: CC BY-SA: Attribution-ShareAlike
- All sizes | Ti(RED) | Flickr - Photo Sharing!. Provided by: Flickr. Located at: www.flickr.com/photos/hryckow...n/photostream/. License: CC BY: Attribution
- Barriers to exit. Provided by: Wikipedia. Located at: en.Wikipedia.org/wiki/Barriers_to_exit. License: CC BY-SA: Attribution-ShareAlike
- Barriers to entry. Provided by: Wikipedia. Located at: en.Wikipedia.org/wiki/Barriers_to_entry. License: CC BY-SA: Attribution-ShareAlike
- Microeconomics/Perfect Competition. Provided by: Wikibooks. Located at: en.wikibooks.org/wiki/Microec...ct_Competition. License: CC BY-SA: Attribution-ShareAlike
- Barriers to entry. Provided by: Wikipedia. Located at: en.Wikipedia.org/wiki/Barriers%20to%20entry. License: CC BY-SA: Attribution-ShareAlike
- barriers to exit. Provided by: Wikipedia. Located at: en.Wikipedia.org/wiki/barriers%20to%20exit. License: CC BY-SA: Attribution-ShareAlike
- HouSupply5. Provided by: Wikibooks. Located at: en.wikibooks.org/wiki/File:HouSupply5.png. License: CC BY-SA: Attribution-ShareAlike
- Elasticity-elastic. Provided by: Wikipedia. Located at: en.Wikipedia.org/wiki/File:El...ty-elastic.png. License: CC BY-SA: Attribution-ShareAlike
- Production Possibilities Frontier Curve. Provided by: Wikipedia. Located at: en.Wikipedia.org/wiki/File:Pr...tier_Curve.svg. License: CC BY-SA: Attribution-ShareAlike
- All sizes | Ti(RED) | Flickr - Photo Sharing!. Provided by: Flickr. Located at: www.flickr.com/photos/hryckow...n/photostream/. License: CC BY: Attribution
- Patent russ. Provided by: Wikimedia. Located at: commons.wikimedia.org/wiki/Fi...atent_russ.jpg. License: CC BY-SA: Attribution-ShareAlike

