Market Power
Market power is a measure of a firm’s economic strength that affects its pricing and supply decisions.
Learning objectives
Summarize the relationship between market power and a firm’s supply decision
Market power is a measure of the economic strength of a firm. It is the ability of a firm to influence the quantity or price of goods and services in a market. A firm is said to have significant market power when price exceeds marginal cost and long run average cost, so the firm makes economic profits. Such firms are often referred to as “price makers.” In contrast, firms with limited to no market power are referred to as “price takers.”
Determinants of Market Power
A firm usually has market power by virtue of controlling a large portion of the market. However, market size alone is not the only indicator of market power. Other factors that affect a firm’s market power include:
- Number of producers
- Size of firms in the market
The numbers and size of firms determine the extent that firms can withstand pressures and threats to change prices or product flows. However, being a large firm does not necessarily equal market power. For example, while conglomerates may be very large, they may play only small roles in many different markets and have no ability to influence prices in any of them.
Barriers to entry determine how contestable the market is. Even highly concentrated markets may be contestable markets if there are no barriers to entry or exit, which limits a firm’s ability to raise its price above competitive levels.
Common barriers to entry include control of a scarce resource, increasing returns to scale, technological superiority, and government-imposed barriers.
- Availability of substitute goods
Greater availability of substitute goods will weaken a firm’s market power.
Relationship between Market Power and Firm Behavior
A firm’s market power influences its behavior. For example, market power gives firms the ability to engage in unilateral anti-competitive behavior. Some of the behaviors that firms with market power are accused of engaging in include predatory pricing, product tying, and creation of overcapacity or other barriers to entry. If no individual participant in the market has significant market power, then anti-competitive behavior can take place only through collusion, or the exercise of a group of participants’ collective market power.

Google Logo: In 2012, the U.S. Federal Trade Commission opened an antitrust probe against Google’s search practices. Google allegedly used its market dominance to promote its own products over competitors’ products in web searches.
A monopoly, a price maker with market power, can raise prices and retain customers because the monopoly has no competitors. If a customer has no other place to go to obtain the goods or services, they either pay the increased price or do without.
An oligopoly may also be a price maker with market power, as firms may be able to collude and control the market price or quantity demanded.
A perfectly competitive firm, a price taker with no market power, cannot raise its price without losing its customers.
Measurement of Market Power
Measurement of market power is often accomplished with concentration ratios or the Herfindahl-Hirschman Index (HHI).
Concentration Ratios
The concentration ratio is the proportion of total industry output produced by the largest firms (usually the four largest). This measure of market power relates the size of firms to the size of the market. For monopolies, the four firm concentration ratio is 100 percent, while the ratio is zero for perfect competition.
Herfindahl-Hirschman Index (HHI)
The Herfindahl-Hirschman Index (HHI) is a measure of the size of firms in relation to the industry, and an indicator of the amount of competition among them. The HHI is calculated by summing the squares of the percentage market shares of all participants in the market. The HHI for perfect competition is zero; for a monopoly, it is 10,000.
For example, if a market consists of five firms with market shares of 40, 20, 20, 15, and 5 percent each, the HHI is 2650. \( (40^2+20^2+20^2+15^2+5^2=2650)\).
Measurement Problems
The use of the concentration ratio or the HHI to measure market power is not perfect. A high concentration ratio or large firm size is not the only way to achieve market power. Many smaller firms acting in unison can achieve the same result. Additionally, the measurements do not convey the extent to which market power may be concentrated in a local market.
Defining Producer Surplus
Producer surplus is the difference between the amount producers get for selling a good and the amount they want to accept for that good.
Learning objectives
Define producer surplus
Producer surplus is the difference between what price producers are willing and able to supply a good for and what price they actually receive from consumers. It is the extra money, benefit, and/or utility producers get from selling a product at a price that is higher than their minimum accepted price, as shown by the supply curve.

Economic Surplus: Producer surplus is the shaded area directly above the supply curve, up to the equilibrium point. Consumer surplus is the shaded area directly under the demand curve, up to the equilibrium point.
For example, above, the equilibrium price is \(P′\). However, at \(P_1\), the producers are willing to sell one unit of a commodity for a price that is lower than \(P′\). The resulting rectangle from \(P_1\) on the \(y\)-axis, to its intersection with the supply curve, up to the level of \(P′\) is the producer surplus at price level \(P_1\).
Similarly, at \(P_2\), the producers are willing to sell two units of a commodity at a price that is still lower than \(P′\). The rectangle from \(P_2\) on the \(y\)-axis, to its intersection with the supply curve, up to the level of \(P′\) is the new producer surplus at price \(P_2\). The total producer surplus at \(P_2\) is the first rectangle at the \(P_1\) price, plus the new rectangle from the \(P_2\) price.
This process is repeated for every price level up to the equilibrium price. To find the resulting total producer surplus, all of the rectangles for the individual price levels are added together, and the total area is the total producer surplus. Below, the total producer surplus is made of all three pink rectangles – the surpluses at price levels of \(P_1\), \(P_2\), and \(P_3\) – added together.
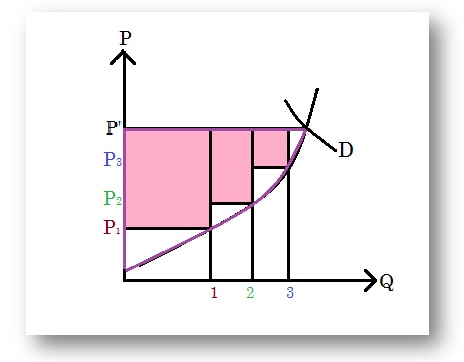
Producer surplus: In the figure, producer surplus at different prices is represented by the pink rectangles.
Impact of Changing Price on Producer Surplus
Producer surplus is affected by changes in price, the demand and supply curve, and the price elasticity of supply.
Learning objectives
Examine producer surplus in terms of changes in demand, supply, price, and price elasticity
Producer surplus is affected by many different factors. Changes in the price level, the demand and supply curves, and price elasticity all influence the total amount of producer surplus, other things held constant.
Changes in Price
Changes in price are directly associated with the amount of surplus a producer will receive. Graphically, the producer surplus is directly above the supply curve, but below the price. Other things equal, as equilibrium price increases, the amount of potential producer surplus and the number of goods supplied increases. Lower prices result in lower potential producer surplus and goods supplied: with a lower equilibrium price, the producer surplus triangle will be smaller.
Economic Surplus: The producer surplus is directly above the supply curve and is shaded in blue.
Demand Curve
Shifts in the demand curve are directly related to the amount of producer surplus. If demand decreases, and the demand curve shifts to the left, producer surplus decreases. Conversely, if demand increases, and the demand curve shifts to the right, producer surplus increases.
At an initial demand represented by the “Demand (1)” curve, producer surplus is the blue triangle made of \(P_1, A\), and \(B\). When demand increases, represented by the “Demand (2)” curve, producer surplus is the larger gray triangle made of \(P_2, A\), and \(C\).
Producer Surplus and the Demand Curve: If the demand curve shifts out, producer surplus increases, as seen by size of the gray triangle.
Supply Curve
Similarly, shifts in the supply curve are also directly related to the amount of potential surplus. Decreases in the supply curve will cause decreases in producer surplus. Increases in the supply curve will cause increases in producer surplus.
At an initial supply represented by the “Supply (1)” curve, producer surplus is the blue triangle made of \(P_1, A\), and \(C\). If supply increases, represented by the “Supply (2)” curve, producer surplus is the larger gray triangle made of \(P_2, B\), and \(D\).
Price Elasticity of Supply
Price elasticity of supply is the relationship between price and quantity changes. It measures how quantity supplied is affected by changes in price. When supply is elastic, producers can increase production without much price or cost change. When supply is inelastic, producers cannot change production easily.
When supply is perfectly elastic, it is depicted as a horizontal line. Producer surplus is zero because the price is not flexible. Producers cannot provide a higher price than market price.
When supply is perfectly inelastic, it is depicted as a vertical line. Producer surplus is infinite because the price is completely flexible.
Key Points
- Firms with market power are said to be “price makers.” They can raise prices and change the quantity supplied of goods and services without hurting profits. Market power often exists when there is a monopoly or oligopoly.
- Firms with limited to no market power are said to be “price takers.” They cannot raise their prices or change the quantity supplied of goods and services without hurting profits. Perfectly competitive firms are examples of price takers with no market power.
- Market power is determined by the number of producers in the market, the size of each firm, barriers to entry in the market, and availability of substitute goods. Firm size and market size alone do not dictate market power.
- Market power is often measured with concentration ratios or the Herfindahl-Hirschman Index, but these are not perfect measures.
- Producer surplus can be thought of as the extra money, utility, or benefits the producer receives by selling a product at a price that is higher than its minimum acceptable price.
- The minimum acceptable price for producers is represented by the supply curve.
- Graphically, producer surplus is the shaded region just above the supply curve, but below the equilibrium price level.
- Changes in the equilibrium price are directly related to producer surplus, other things equal. As the equilibrium price increases, the potential producer surplus increases. As the equilibrium price decreases, producer surplus decreases.
- Shifts in the demand curve are directly related to producer surplus. If demand increases, producer surplus increases. If demand decreases, producer surplus decreases.
- Shifts in the supply curve are directly related to producer surplus. If supply increases, producer surplus increases. If supply decreases, producer surplus decreases.
- Price elasticity of supply is inversely related to producer surplus. If supply is completely elastic, it is drawn as a horizontal line, and producer surplus is zero. If supply is completely inelastic, it is shown as a vertical line, and producer surplus is infinite.
Key Terms
- Herfindahl-Hirschman Index: A measure of the size of firms in relation to the industry and an indicator of the amount of competition among them.
- concentration ratio: The proportion of total industry output produced by the largest firms (usually the four largest).
- contestable market: An imperfectly competitive industry subject to potential entry if prices or profits increase.
- market power: The ability of a firm to profitably raise the market price of a good or service over marginal cost. A firm with total market power can raise prices without losing any customers to competitors.
- producer surplus: The amount that producers benefit by selling at a market price that is higher than the lowest price at which they would be willing to sell.
- price elasticity of supply: A numerical measure of the responsiveness of the quantity supplied of a product to a change in the price of the product alone.
- producer surplus: The amount that producers benefit by selling at a market price that is higher than the lowest price at which they would be willing to sell.
LICENSES AND ATTRIBUTIONS
CC LICENSED CONTENT, SPECIFIC ATTRIBUTION
- BiP 2009 Section 23 Vocabulary Wiki. Provided by: Wikiversity. Located at: en.wikiversity.org/wiki/BiP_2...ocabulary_Wiki. License: CC BY-SA: Attribution-ShareAlike
- Market power. Provided by: Wikipedia. Located at: en.Wikipedia.org/wiki/Market_power. License: CC BY-SA: Attribution-ShareAlike
- Chapter 25 outline. Provided by: crn5555 Wikispace. Located at: crn5555.wikispaces.com/Chapter+25+outline. License: CC BY-SA: Attribution-ShareAlike
- Dominant group/Economics. Provided by: Wikiversity. Located at: en.wikiversity.org/wiki/Dominant_group/Economics. License: CC BY-SA: Attribution-ShareAlike
- Herfindahl index. Provided by: Wikipedia. Located at: en.Wikipedia.org/wiki/Herfindahl_index. License: CC BY-SA: Attribution-ShareAlike
- Boundless. Provided by: Boundless Learning. Located at: www.boundless.com//economics/definition/concentration-ratio. License: CC BY-SA: Attribution-ShareAlike
- market power. Provided by: Wikipedia. Located at: en.Wikipedia.org/wiki/market%20power. License: CC BY-SA: Attribution-ShareAlike
- Boundless. Provided by: Boundless Learning. Located at: www.boundless.com//economics/definition/contestable-market. License: CC BY-SA: Attribution-ShareAlike
- Boundless. Provided by: Boundless Learning. Located at: www.boundless.com//economics/definition/herfindahl-hirschman-index. License: CC BY-SA: Attribution-ShareAlike
- Logo 2013 Google. Provided by: Wikipedia. Located at: en.Wikipedia.org/wiki/File:Logo_2013_Google.png. License: Public Domain: No Known Copyright
- Producer Surplus APMICE. Provided by: wrightslandofeconomics Wikispace. Located at: wrightslandofeconomics.wikisp...Surplus+APMICE. License: CC BY-SA: Attribution-ShareAlike
- 17 Surplus. Provided by: microecon201 Wikispace. Located at: microecon201.wikispaces.com/17+Surplus. License: CC BY-SA: Attribution-ShareAlike
- Partial equilibrium. Provided by: Wikipedia. Located at: en.Wikipedia.org/wiki/Partial_equilibrium. License: CC BY-SA: Attribution-ShareAlike
- producer surplus. Provided by: Wikipedia. Located at: en.Wikipedia.org/wiki/producer%20surplus. License: CC BY-SA: Attribution-ShareAlike
- Logo 2013 Google. Provided by: Wikipedia. Located at: en.Wikipedia.org/wiki/File:Logo_2013_Google.png. License: Public Domain: No Known Copyright
- Economic-surpluses. Provided by: Wikipedia. Located at: en.Wikipedia.org/wiki/File:Ec...-surpluses.svg. License: Public Domain: No Known Copyright
- Producer Surplus. Provided by: Wikipedia. Located at: en.Wikipedia.org/wiki/File:Pr...er_Surplus.jpg. License: CC BY-SA: Attribution-ShareAlike
- Producer Surplus APMICE. Provided by: wrightslandofeconomics Wikispace. Located at: wrightslandofeconomics.wikispaces.com/Producer+Surplus+APMICE. License: CC BY-SA: Attribution-ShareAlike
- Producer surplus. Provided by: Wikipedia. Located at: en.Wikipedia.org/wiki/Producer_surplus. License: CC BY-SA: Attribution-ShareAlike
- Partial equilibrium. Provided by: Wikipedia. Located at: en.Wikipedia.org/wiki/Partial_equilibrium. License: CC BY-SA: Attribution-ShareAlike
- elasticity of supply. Provided by: microecon201 Wikispace. Located at: microecon201.wikispaces.com/elasticity+of+supply. License: CC BY-SA: Attribution-ShareAlike
- Boundless. Provided by: Boundless Learning. Located at: www.boundless.com//economics/...city-of-supply. License: CC BY-SA: Attribution-ShareAlike
- producer surplus. Provided by: Wikipedia. Located at: en.Wikipedia.org/wiki/producer%20surplus. License: CC BY-SA: Attribution-ShareAlike
- Logo 2013 Google. Provided by: Wikipedia. Located at: en.Wikipedia.org/wiki/File:Logo_2013_Google.png. License: Public Domain: No Known Copyright
- Economic-surpluses. Provided by: Wikipedia. Located at: en.Wikipedia.org/wiki/File:Economic-surpluses.svg. License: Public Domain: No Known Copyright
- Producer Surplus. Provided by: Wikipedia. Located at: en.Wikipedia.org/wiki/File:Producer_Surplus.jpg. License: CC BY-SA: Attribution-ShareAlike
- Economic-surpluses. Provided by: Wikipedia. Located at: en.Wikipedia.org/wiki/File:Economic-surpluses.svg. License: Public Domain: No Known Copyright
- WrightsLandofEconomics - Producer Surplus APMICE. Provided by: Wikispaces. Located at: wrightslandofeconomics.wikispaces.com/Producer+Surplus+APMICE. License: CC BY-SA: Attribution-ShareAlike

