When we teach our Asian American Studies courses, we tell students that Asian Americans are not homogenous; we are diverse and there is no one way of “looking” or “acting” Asian. As Asian Americans in California, our experiences growing up in the Bay Area, So Cal, or the Central Valley may be very different from Asian American communities throughout the West, East, Hawai’i, or increasingly Asian Americans in the Midwest and the South. Over 20 million Asian Americans were counted in the 2020 census and have origins in more than 20 different countries (Gebeloff, et al, 2021). Contrary to the “model minority” myth which we’ll get into in a later subsection, Asian Americans represent an array of educational and socioeconomic backgrounds. Simply put, you can’t put Asian Americans in one box.
How and Why They Came
Issues concerning immigration affect many aspects of the Asian American community. This is understandable since almost two-thirds of all Asian Americans are foreign-born. Before trying to examine the many controversies regarding the benefits or costs of immigration, we first need to examine the characteristics of the immigrant population, Asian and otherwise.
The national and ethnic diversity of Asian American immigration history is reflected in the variety of their experiences in joining U.S. society. Asian immigrants have come to the United States primarily in the third wave (1880-1914) and fourth wave (1965-present), but also in the second wave (1820-1860). The 1965 Immigration and Nationality Act removed national-origin quotas established in 1921, resulting in marked population growth during this period with 491,000 Asian immigrants in 1960 and 12.8 million Asian immigrants in 2014, which accounts from a 2,597% increase. As of 2014, the top five origin countries of Asian immigrants were India, China, the Philippines, Vietnam, and Korea.
We should first understand that immigrating to another country is not an easy thing to do. It almost always involves making elaborate preparations and costs a lot of money. Many times it also means giving up personal relationships at home (at least temporarily, if not permanently) and learning a new language and culture. The point is, not everyone who wants to immigrate actually does. In fact, those who are very poor rarely immigrate -- they just don't have the resources. Those who do immigrate tend to be from their country's middle and professional classes.
The first Asian immigrants to come to the United States in the mid-nineteenth century were Chinese. These immigrants were primarily men whose intention was to work for several years in order to earn incomes to send back to their families in China. Their main destination was the American West, where the Gold Rush (’49 ers) was drawing people with its lure of abundant money. The construction of the Transcontinental Railroad was underway at this time, and the Central Pacific section hired thousands of migrant Chinese men to complete the laying of rails across the rugged Sierra Nevada mountain range. Chinese men also engaged in other manual labor like mining and agricultural work. This work was grueling and underpaid, but like many immigrants, they persevered.
Japanese immigration began in the 1880s, on the heels of the Chinese Exclusion Act of 1882. Many Japanese immigrants came to Hawaii to work in the sugar industry; others came to the mainland, especially to California. Unlike the Chinese, however, the Japanese had a strong government in their country of origin that negotiated with the U.S. government to ensure the well-being of their immigrants. Japanese men were able to bring their wives and families to the United States, and were thus able to produce second- and third-generation Japanese Americans more quickly than their Chinese counterparts.
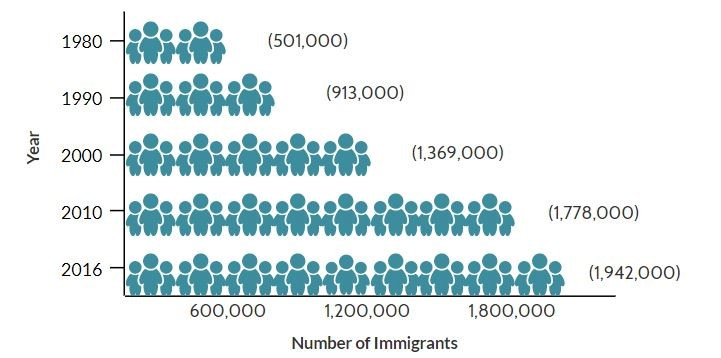
Figure \(\PageIndex{1}\): Filipino Immigrant Population in the United States, 1980-2016. (Data from U.S. Census Bureau 2010 and 2016 American Community Surveys (ACS), and Campbell J. Gibson and Kay Jung, “Historical Census Statistics on the Foreign-born Population of the United States: 1850-2000” (Working Paper no. 81, U.S. Census Bureau, Washington, DC, February 2006) (CC BY 4.0; via Lumens)
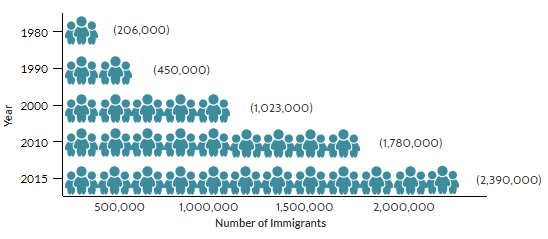
Fourth wave Asian immigration included immigrants from India, Korea, Vietnam, and the Philippines. As you can see in Figure 9.1.2, Indian immigration grew between 1980 and 2010 more than eleven-fold, roughly doubling every decade. It is composed primarily of English-speaking, highly educated immigrants, many of whom qualified for an H-1B (a temporary visa for highly skilled immigrants). In 2013, India and China supplanted Mexico as the top sources of newly arriving immigrants in the United States.
Figure \(\PageIndex{2}\): Indian Immigrant Population in the United States, 1980-2015. (Data from U.S. Census Bureau 2010 and 2015 American Community Surveys (ACS), and 1980, 1990, and 2000 Decennial Census, www.migrationpolicy.org/arti...-united-states) (CC BY 4.0; via Lumens)
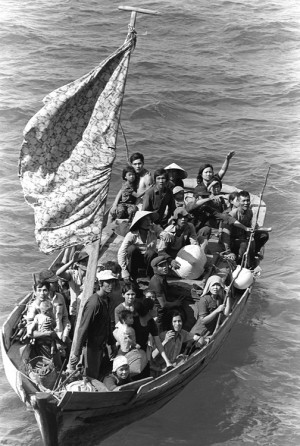
Wars in Korea and Vietnam led to increased immigration from those countries after 1965. While Korean immigration has been fairly gradual, Vietnamese immigration was more concentrated after 1975, when the formerly U.S.-backed city of Saigon fell and a restrictive communist government was established. Whereas many Asian immigrants came to the United States to seek better economic opportunities, Vietnamese immigrants came as political refugees, seeking asylum from repressive conditions in their homeland. The Refugee Act of 1980 helped them settle in the United States, with large numbers coming from Vietnam, Laos, and Cambodia. Many of these refugees settled in California, Minnesota, and Wisconsin, forming ethnic enclaves in urban areas (ethnic enclaves defined in Chapter 1.3).
Figure \(\PageIndex{3}\): Thirty-five Vietnamese refugees wait to be taken aboard the amphibious USS Blue Ridge (LCC-19). They are being rescued from a thirty-five-foot fishing boat 350 miles northeast of Cam Ranh Bay, Vietnam, after spending eight days at sea. (CC PDM 1.0; PH2 Phil Eggman (U.S. Navy) via Wikimedia) (CC BY 4.0; via Lumens)
Current Status
Asian Americans are a rapidly growing part of the population. The New York University (NYU) Center for the Study of Asian American Health examines growth in New York City. Researchers there found that New York City (NYC) is home to nearly 1.2 million documented and undocumented Asian Americans, representing more than 13% of the total NYC population. This diverse population (more than 20 countries of origin and 45 languages and dialects) grew by 110% from 1990 to 2010.
The following list highlights recent Census data on the diversity of Asian American and Pacific Islander (AAPI) communities:
Previous decades showed that Asian Americans were concentrated in east and west coasts, however the 2020 Census revealed that the highest growth of Asian American populations included states in the Southwest and South (Gebeloff, et al, 2021).
In 2020, it was reported that the two largest Asian ethnic groups are Chinese and Indian at 4.1 million each (Monte and Shin, 2022).
They are followed by Filipino (2.9 million), Vietnamese (1.8 million), Korean (1.5 million), Japanese (768,985), Pakistani (≈500,000), Hmong (305,525), Cambodian (259,307), Thai (204,150), Taiwanese (194,263), Laotian (192,929), Bangladeshi (185,177), Burmese (169,915), Nepalese (162,993), Indonesian (76,873), Sri Lankan (51,735), Bhutanese (26,534), Mongolian (21,199), Malaysian (20,758), and Okinawan (3,526) (Monte and Shin, 2022).
The Census counted 532,135 Asian Americans who counted two or more Asian ethnicities (Monte and Shin, 2022).
And 4.1 million people identified as Asian in combination with another race (Monte and Shin, 2022).
Over 1 million and 100,000 people identify as Native Hawaiian Pacific Islander (NHPI).
The largest group is Native Hawaiians at around 620,000, followed by Samoan (212,000), Chamorro (156,000), Tongan (65,000), and Fijian (50,000) (Monte and Shin, 2022).
Immigrant and Emigrant Populations by Country of Origin and Destination
Click below on the Interactive map on immigrant and emigrant populations to examine where many of the world’s 258 million international migrants moved. You can use the dropdown menu to select a country of origin to see where emigrants have settled.
Thumbnail of the interactive map on immigrant and emigrant populations by country. You can open the map in a new tab by clicking on the image."height="570"width="699"src="/@api/deki/files/133737/1_rss.png"/>
Figure \(\PageIndex{4}\): Immigrant and Emigrant Populations by Country of Origin and Destination. (CC BY 4.0; via Lumens)
Other Groups and Their Levels of Success
In regard to other immigrant groups, the statistics above show that immigrants from Asia and Pacific Islands compare quite favorably to other immigrants and to the U.S.-born as well. However, there also seems to be a much wider spread of characteristics among Asian immigrants. In other words, there seems to be many who are more likely to be from rural or working class backgrounds (and therefore have lower socioeconomic attainment rates), along with many other Asian immigrants from middle class and professional backgrounds who have very high attainment rates.
For example, Asian and Pacific Islander immigrants have a much rate of not being proficient in English than do the U.S.-born (which is understandable since English is a foreign language to most Asians) and they also have a higher rate of less than high school completion than do the U.S.-born. On the other hand, Asian & Pacific Islander immigrants have a median personal (per capita) income comparable to the U.S.-born, along with a much higher median family income. They also have higher rates of having a college degree, an advanced degree, and working at a high skill occupation than do the U.S.-born.
Similarly, immigrants from Europe, Russia, and Canada tend to have socioeconomic attainment levels that are very comparable to that for the U.S.-born and in several categories, outperform them as well. These include higher rates of having a college degree, an advanced degree, working in a high skill occupation, and most notably, the highest median personal (per capita) income of all groups in the table. Interestingly, they also have the lowest rate of being in the labor market, which may suggest that many are retired but rather affluent as well.
Overall, all of these socioeconomic measures and statistics comparing immigrants to the U.S.-born population suggest that in most cases, both groups are relatively close to the other. But again, these numbers can be used to support both sides of the immigration debate -- that immigrants are not achieving as well as the U.S.-born and vice-versa. However, it does seem clear that these statistics do not support the stereotype of immigrants as being chronically unemployed, in poverty, and on public assistance. They do suggest that just like any other social group in the U.S., there is a lot of diversity within each group and that we as a society should be careful about making sweeping generalizations about all members of a particular group.
Ethnic Communities & Enclaves
Immigration is a major component in the lives of many Asian Americans -- why they come, how many, and what happens to them after they arrive. Since the establishment of the first Asian American communities in the U.S., Asian American "enclaves" have become a significant part of virtually every major city in America. As more Asians immigrate to the U.S., traditional communities not only grow but also evolve as they absorb the new arrivals and adapt to the non-Asian environment around them. This section looks at the numbers of immigrants who come to the U.S., their ethnic communities, and the economic and cultural issues that affect these groups.
First, The Demographics
Before we explore the origins and dynamics of ethnic enclaves and communities, you may be wondering, considering that about two-thirds of all Asian Americans are immigrants, exactly how many Asians have immigrated to the U.S.? To answer that question, view Table 9.5 below (Immigration and Naturalization Service data). It shows the number of immigrants and refugees/asylees who have arrived in the U.S. for the six largest Asian origin countries, plus Hong Kong (remember, before 1997, Hong Kong was a colony of Great Britain) and all Asian countries combined, for each of the past three decades plus the latest year in which final numbers are available, 2000. Finally, it includes numbers from Europe, the Caribbean, Central and South America, and Mexico for comparison.
Table \(\PageIndex{5}\): The number of immigrants, refugees, and asylees (1971-2004). (Data from the Department of Homeland Security)
1971-1980
1981-1990
1991-2000
2001-2004
China
138,068
354,675
426,722
212,724
Hong Kong
116,935
100,131
110,390
30,336
India
164,175
250,786
365,604
267,081
Japan
49,831
47,195
67,966
31,628
Korea
267,703
333,866
164,192
74,055
Philippines
355,200
548,764
509,913
207,908
Viet Nam
323,086
605,235
493,002
144,494
All Asian Countries
1,798,861
3,450,249
3,147,019
1,332,264
All European Countries
872,226
917,062
1,786,302
738,898
Caribbean, Central & South America
1,424,865
1,924,312
2,236,032
971,635
Mexico
640,496
1,655,843
2,249,837
717,408
As you can see, the Asian ethnic country that has sent the most immigrants to the U.S. since 1971 is the Philippines (over 1.5 million since 1971), followed by India, Korea, and Viet Nam (all around 3/4 of a million). However, these numbers pale in comparison to the number of immigrants from Mexico, who total over 4.5 million since 1971 -- wow! The U.S. is truly the land of immigrants. Before we discuss the socioeconomic and cultural characteristics and impacts of Asian immigrants, let us examine how they've formed their own ethnic communities after arriving in the U.S.
Origins of Asian American Enclaves
The first Asian American enclave ("enclave" and "community" are used interchangeably) were not Chinatowns but were actually Manila Villages in Louisiana in the 1750s. But the Chinatowns that developed as increasing numbers of Chinese workers came to northern California and Hawai'i in the mid-1800s expanded the scale of such enclaves to a whole new level. As the Chinese population spread to other parts of the country, new Chinatowns spread to other major cities, such as New York City, Los Angeles, and Chicago.
But after Chinese immigration was all but stopped in the 1880s, the Japanese then followed in the steps of the Chinese and "Little Tokyos" began cropping up, first in Hawai'i, San Francisco and then in Los Angeles. As the Japanese mainly worked in agriculture, they became drawn to the relatively undeveloped land and abundant farming opportunities in Southern California. Since this period in the early 1900s, a few small Asian American communities existed throughout the country but they were relatively unnoticed for the most part.
However, it was not until the 1965 Hart-Cellar Immigration Act that the structure of Asian American enclaves changed radically. With the influx of new immigrants from China, the Philippines, Korea, India/South Asia, and Viet Nam, almost overnight new ethnic enclaves became established and quickly grew in size, almost exponentially. New enclaves soon appeared in several major U.S. cities while existing ones expanded rapidly.
Soon there were Koreatowns in Los Angeles and New York, Little Manilas in Stockton, Los Angeles, and San Francisco, South Asian enclaves in New York, and Little Saigons in Orange County (CA), San Jose, and Houston. By the mid-1980s, the existing Chinatown in Manhattan grew so much that there wasn't any more land into which it could expand so new Chinatowns sprang up in Sunset Park, Brooklyn and Flushing, Queens.
Today, you could find an Asian American enclave in almost every major metropolitan area you go. Some may even be in place where you would never expect, such as a thriving Hmong community in Minneapolis/St. Paul. There are also expanding Asian communities in many Canadian cities, in particular Toronto and Vancouver. Each Asian community offers its own mix of traditional culture and cuisine along with new elements borrowed from its surrounding community.
Why Enclaves Are So Popular
On the continuum of intergroup relations, ethnic enclaves are an example of separatism. As Sociologists and other social scientists note many reasons why these ethnic enclaves are so popular with new immigrants and Asian Americans who have lived in the U.S. all their lives. They actually have different definitions for an ethnic "community" versus an ethnic "enclave." Without getting into the academic details too much, enclaves are ethnic communities that have a well-developed economic structure that operates mainly through racial-ethnic dynamics.
At any rate, we will discuss the issue of Asian American small businesses in another section. For now, we'll focus on how these ethnic enclaves grew so quickly and why they continue to thrive. In one word, it's because of immigration. Immigrants from Asia keep coming to these ethnic communities and infuse them with new life.
There are many theories on why people immigrate to the U.S., especially from Asian countries. Again, without getting too academic, the usual scenario goes something like this: American multinational corporations set up businesses in foreign countries and soon begin to dominate that country's politics and economy. This "globalization of capital" disrupts and transforms the traditional way people in these Asian countries make a living as the fundamental structure of their national economy changes from one dominated by farming and agriculture to the beginnings of a modern capitalist economy that emphasizes manufacturing and export sectors.
Figure \(\PageIndex{7}\): Asian businesses in the enclaves provide immigrants with jobs. (CC BY-SA 4.0; Nandoro via Wikimedia)
Many workers struggle to survive economically, to adapt to these rapid changes, and many become "displaced" (i.e., they lose their jobs or their land). Nonetheless, having already been exposed to U.S. culture, either through direct contact with those connected to the American businesses now operating in their country or through TV programs and U.S. media portrayals, many workers dream about working in the U.S. and earning lots of money. Their expectations for "the good life" become heightened but they also realize that they can't achieve these new goals in their current situation. They also see that by working in the U.S. and earning more money, they can help out other family members who have also been displaced.
In the meantime, companies in the U.S. are looking to hire immigrant workers who are frequently willing work for lower wages than U.S.-born workers. Many times, these companies actively recruit foreign workers to come to the U.S. Further, earlier immigrants from that country help in the immigration process by providing helpful information about jobs or assistance in the actual immigration and adjustment process. After this initial cycles, immigration becomes almost self-perpetuating through these established social networks as immigrant workers repeat the cycle of helping their family, relatives, and friends come to the U.S. to find work.
Once these Asian immigrants get to the U.S., they frequently end up living or working in these established Asian enclaves. This makes sense because these enclaves give them a sense of familiarity and emotional comfort, which makes it easier for them to adapt to life in the U.S. They also are more likely to get a job in the enclave, especially if they are not fluent enough in English to get a job outside the enclave. Being employed also helps them adjust to their new life in the U.S.
Finally, these new workers help these small ethnic businesses survive and even prosper, perhaps to the point where they can contribute to the local economy in the form of taxes and hiring more workers, Asian and non-Asian. In the meantime, non-Asians are able to learn about and enjoy the rich Asian culture and food of these enclaves. These new understandings and friendships can form the bridge that helps us to overcome the old suspicions of "us" versus "them" and that immigrants can be Americans too.
At the same time, many point out that not everything is always quite so rosy for these Asian immigrant workers. They argue that many Asian business owners are more than willing to exploit the relative powerlessness of these new immigrants and their willingness to accept lower wages and less-than-optimum working conditions. Specifically, many Asian-owned sweatshops, restaurants, and other small businesses have been accused of taking advantage of their own people in this manner for their own financial gain.
In fact, many Asian American non-profit community organizations were established to protest against these exploitative conditions by picketing Asian small businesses and pressuring their owners to improve working conditions and wages, and by trying to unionize these immigrant workers. Academic research also shows that working within an ethnic enclave is frequently beneficial for Asian business owners but not for their workers who may be able to earn more and enjoy slightly better working conditions in jobs outside the ethnic enclave.
On the other hand, other scholars argue that while immigrant workers in ethnic enclaves may be slightly '"penalized" in terms of wages and working conditions, they benefit in other ways. Specifically, they enjoy the psychological familiarity and comfort of being surrounded by others like them as they adapt to a strange new society. They also learn the ins and outs of running a small business; in fact, many workers eventually go on to opening up their own small businesses, sometimes by buying the business from their former owners.
In short, while there are some disadvantages for workers in the ethnic enclave, the fact remains that Asian ethnic communities have the enormous potential to benefit everyone involved -- new immigrants, established Asian Americans, the local non-Asian community, and American society as a whole.
Little Manila
Filipina American historian, the late Dawn Mabalon (2013) discusses the Filipinx American movement in Stockton, CA from 1967 to 1972 in her text Little Manila is in the Heart: The Making of a Filipina/o American Community in Stockton, California. She writes, “Galvanized by anger over displacements of urban renewal and freeway construction, these seemingly disparate groups drew on their community development to forge a formidable alliance that challenged the white and Filipina/o power structure in Stockton, as well as the notion that Filipinas/os should remain second-class citizens” (Mablon, 2013 p. 300).
Mabalon (2013) recognized that contrary to popular belief about Filipinas/xs/os, a lot of conflict that made organizing the community difficult wasn’t due to regionalism (i.e. differences between being from Luzon, Visayas, or Mindanao) but instead language differences, whether Tagalog, Visayan languages, Ilocano, and others. Mabalon (2013) recalls the discrimination and segregation that Filipinxs faced.
As mentioned earlier, some of the impetus for fighting was due to the idea that Filipinx Americans were considered “second-class citizens.” The following memory from a Stockton resident during that time shows the discrimination and treatment of Filipinas/xs/os in regards to basic needs. This discrimination dehumanized them and is also reminiscent of Civil Rights Struggles in the 1960's. Mabalon (2013) writes,
"The only place Filipinas/os were allowed to live and congregate in downtown was south of Main Street, in the Oriental Quarter. Most institutions, businesses, and gathering places outside of the campo and the streets of the West End were strictly forbidden to Filipinas/os. Many hotels in the downtown West End refused to rent rooms to them. Immigrants recalled seeing the signs that warned Filipinas/os not to let the sun set on them in the city. "I personally saw signs on some hotel stairways on El Dorado Street, openly discriminating against Filipinos saying ‘Positively No Filipinos allowed’ or ‘No Filipinos or dogs allowed,’ " remembered by Anita Bautista, a second-generation Pinay" (p. 113).
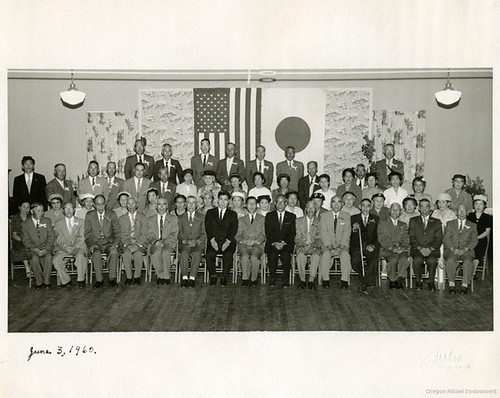
Japantown
What was once a comfortable Japantown in San Francisco became a place that completely changed when Japanese Americans were forced to leave West coast cities during World War II due to Roosevelt's Executive Order 9066 signed two months after the bombing of Pearl Harbor. When Japanese American residents of Japantown in San Francisco came back to their homes after living in the camps, they sometimes came to find new ownership and establishments, as well as sometimes losing their homes. Upon returning, they found that a lot of the area had been targeted for redevelopment. Some residents were able to come back and those who were able have been fighting against redevelopment ever since, a common occurrence amongst communities of color in urban spaces.
To “Save Japantown,” they formed a committee that included “designated city planners, local community, merchants, homeowners’ associations, and residents.” (Takashi, 2014, p. 6). Efforts to “Save Japantown” have faced the difficult challenge of balancing various interests and prioritizing cultural preservation or economic revitalization. One issue included whose interest did the initiative serve? For example, Japanese Americans may be fighting to preserve Japanese culture but others argue that Japanese Americans used to be against Japanese (as in Japan) investments and are now fighting against outside investments (Takashi, 2014, p.10). Another issue was what exactly did preservation look like? As with other ethnic neighborhoods, they fought gentrification, fighting against outsiders redeveloping the area and taking away their ethnic ties and local establishment. Further, Takashi (2014) writes,
"Interviewee C : Business owner and community leader (Sansei male):
I think most of the property owners are Nisei and … don’t always like governmental intervention. They are like “let me do whatever I want on my property” … “let me control my own destiny” … “I don’t want government to tell me what to do” … it’s typical Nisei. I’m sure all the experience they’ve had through the Depression, the War and discrimination and redevelopment … Everything has affected their decisions" (p. 9).
As expressed in this quotation, there is a lot of history impacting the way that the different groups involved are navigating how to “Save Japantown” including within the Japanese and Japanese American community. One white community planner called the presence and impact of history “an open wound” within the community and efforts to save the community (Takashi, 2014).
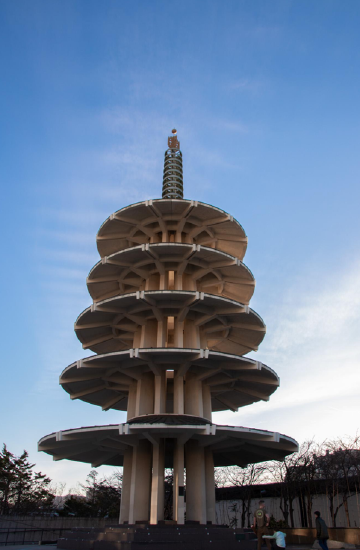
Figure \(\PageIndex{9}\): Peace Pagoda in Japantown, San Francisco. (CC BY 4.0; Photo by Jordan Burkart)
Our Local Stories: Japanese Immigrants
Japanese immigrants began their journey to the United States in search of a better life in the late 1800s, escaping instability in Japan. They faced hardships such as hostile neighbors, tough working conditions, and legislative attacks.
The arrival of Japanese immigrants to California coincided with the departure of Chinese laborers who had worked on the transcontinental railroad. Chinese workers moved to urban areas due to anti-Chinese sentiment and the Chinese Exclusion Act of 1882. This created a labor vacuum in California's agricultural regions, which Japanese immigrants began to fill.
Japanese immigration to California increased significantly in the mid-1880s, encouraged by employers to address the shortage of cheap Asian labor caused by the Chinese Exclusion Act. Many Japanese immigrants also arrived from Hawaii after its annexation by the U.S. in 1898. Despite their contributions to American ideals, Japanese immigrants faced prejudice and racism.
After 1900, Japanese immigration to Hawaii and the West Coast grew as people sought economic security. They formed communities in rural California, often settling near others from the same prefecture in Japan. Over time, many transitioned from agricultural laborers to tenant farmers and business owners. Sanger, CA was one of those places with Japanese Americans settling in the area in the 1890's. Japanese immigrants worked mainly in agriculture from working the fields to owning companies such as Round Mountain Citrus where fruit was packed to send to San Francisco markets. Home Grocery, Star Restaurant, and the Sanger Japanese Community Hall were owned and supported by the Japanese community.
In Fresno, Chinatown was home to another group of Japanese Americans. Several of the most popular businesses in Chinatown were owned by Japanese families including attorney Y. R. Hiraoka, Dentist Dr. F. Inada, and Royal Jewlers. Nakamura Cyclery was one of those places where local kids hung out. The store opened around 1915 and eventually sold more than just bicycles, selling guns, ammunition, fishing tackle, paints, and hardware by the 1930's.
In 1942 hundreds of Japanese in Fresno were forcibly relocated to the Fresno Assembly Center at the fairgounds and later sent to internment camps throughout the country. While many homes, businesses, and livelihoods were lost, Nakamura Cyclery remained and was returned to the Maruko family after the end of the war.
Resources
History of Japanese Americans in Sanger dates back to 1890's (1988). Sanger Herald History Edition, pg. 84-85.
nineteenth-century San Francisco health officials and politicians conceived of Chinatown as the preeminent site of urban sickness, vice, crime, poverty, and depravity; furthermore, “health authorities readily conflated the physical condition of Chinatown with the characteristics of Chinese people. They depicted Chinese immigrants as a filthy and diseased “race” who incubated such incurable afflictions as smallpox, syphilis, and bubonic plague and infected white Americans” (San Francisco Board of Health, 1876-1881 in Shah, 2001, pp. 1-2).
These attributes contributed to the idea of who is an “acceptable” kind of immigrant, who is healthy and desirable.
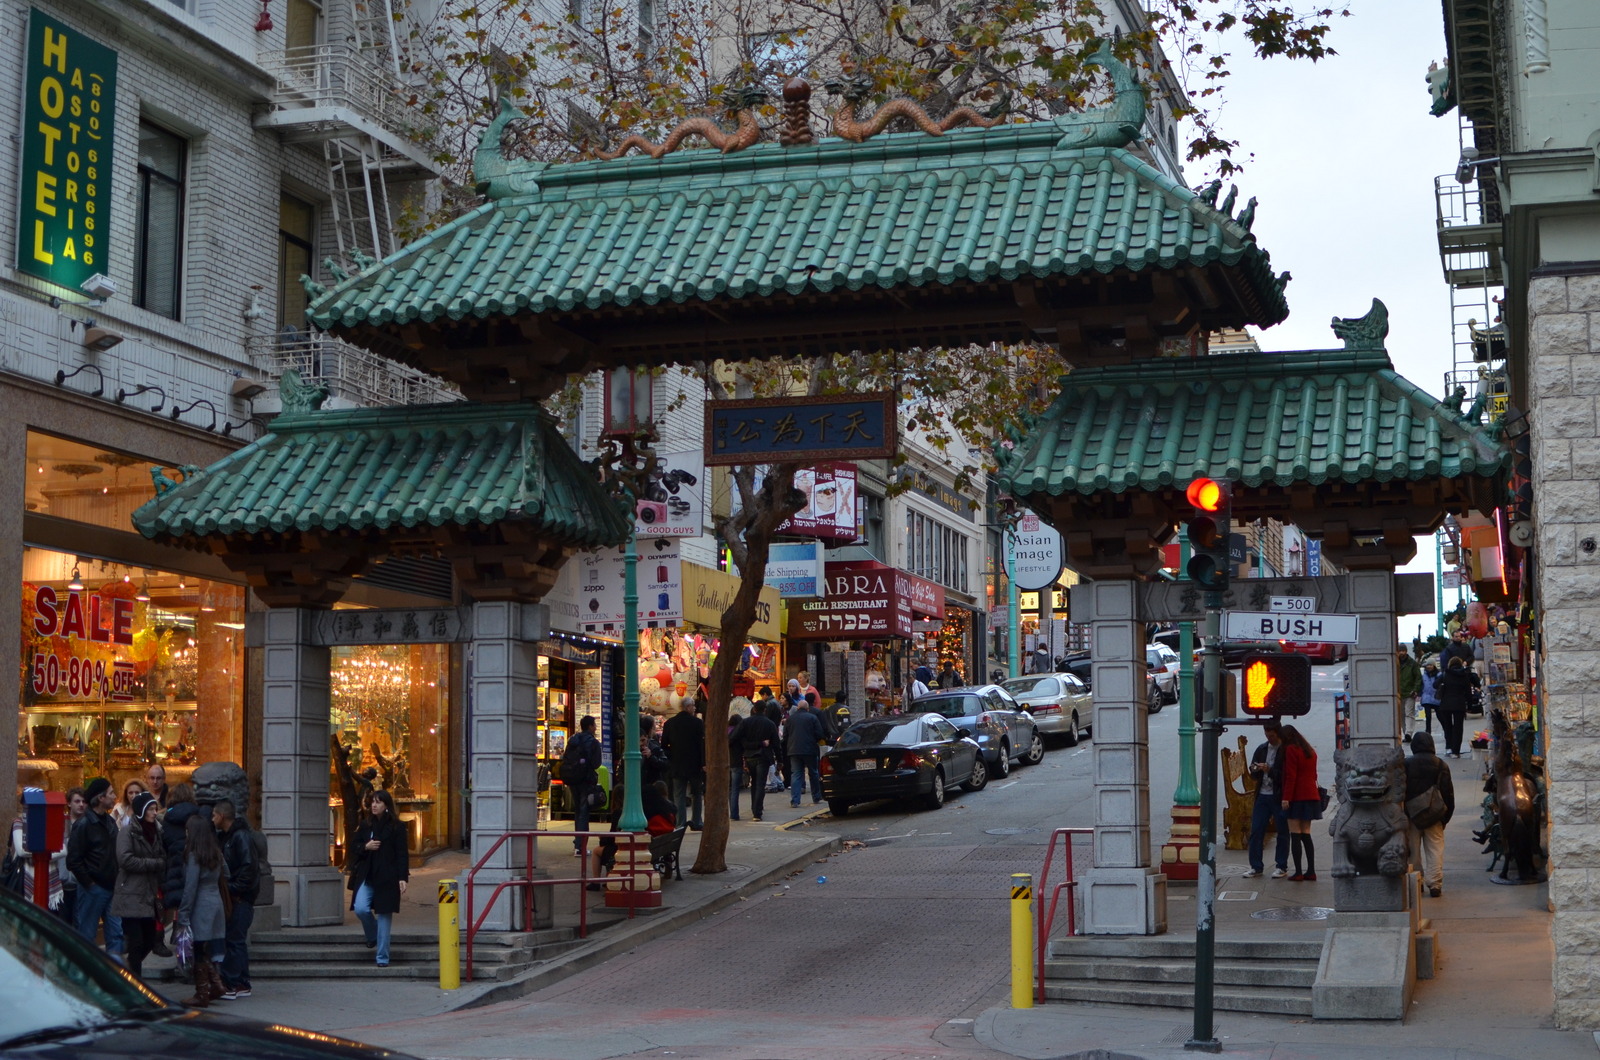
Figure \(\PageIndex{10}\): "Dragon Gate" in San Francisco. (CC BY 4.0; Photo by Jordan Burkart)
Shah (2001) writes that during the 19th century, “Chinese Americans found it impossible to move outside the boundaries of Chinatown. Attempts to move encountered resistance from white real estate brokers, who refused to show Chinese Americans houses in exclusively white neighborhoods, and from white landlords, who turned down Chinese tenants (p. 230). Shah found various sources that demonstrate this that includes a Survey of Race Relations collection and interviews as a part of Combined Asian American Resources Oral History Project. Because of this, Chinese Americans lived in segregated Chinatowns before being able to slowly find housing in white neighborhoods in the twentieth century when they proved they could be trusted to be clean, “adapted to American living styles and standards in furnishings and decor and by Chinese families who conformed to idealized nuclear-family social dynamics” (p. 230). Such heteronormativity contrasted with the historically bachelor societies in Chinatowns and other ethnic neighborhoods that were said to harbor disease and promote uncleanliness amongst same-sex housing (p. 230).
In their quest for humanization, middle-class Chinese Americans fought laws and went to court to challenge their treatment, and gained media visibility and sympathy from many. Shah (2013) remarks that this helped shift perceptions of Chinese Americans, but sometimes at the cost of others. For example, fighting for middle-class Chinese Americans and making the claim that they are upright and moral, clean citizens and that their wealth and status proves it, often came at the detriment of those who lived in bachelor societies (p. 230). Many of these bachelor societies existed because of the limited immigration allowable for Asian women and thus the settling and homemaking often done by longer-term immigrants.
Ethnic Enclave
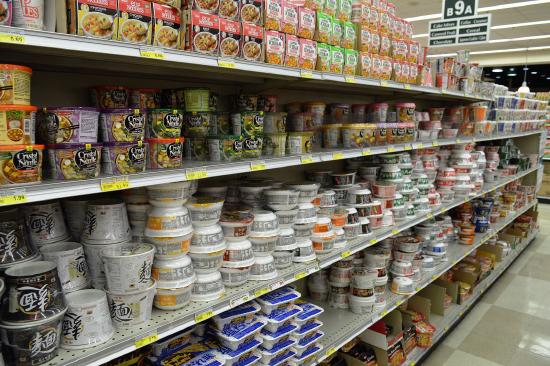
Can you think of a current Asian American Ethnic Enclave in the Fresno area? Remember, ethnic enclaves are neighborhoods where one ethnic group predominately lives and is supported by businesses, groceries, restaurants, religious and social groups, schools, arts, and cultural events. Review the criteria for ethnic enclaves in chapter 2.2.
Hint: an ethnic enclave is generally NOT an entire city!
Figure \(\PageIndex{11}\): Asian Americans as a Percentage of a County's Total Population. (Used with permission, CensusScope.org /Social Science Data Analysis Network) (CC BY 4.0; via Lumens)
The map above is from CensusScope/Social Science Data Analysis Network and it shows Asian Americans as a percentage of a county's total population from the 2000 census. What it basically shows, not surprisingly, is that the counties that have the largest proportion of their population as Asian American are located in California, Washington, and along the mid-Atlantic and New England states. However, there is also a scattering of counties in the midwest and Texas that, while not huge, have a notable proportion of their population as Asian as well.
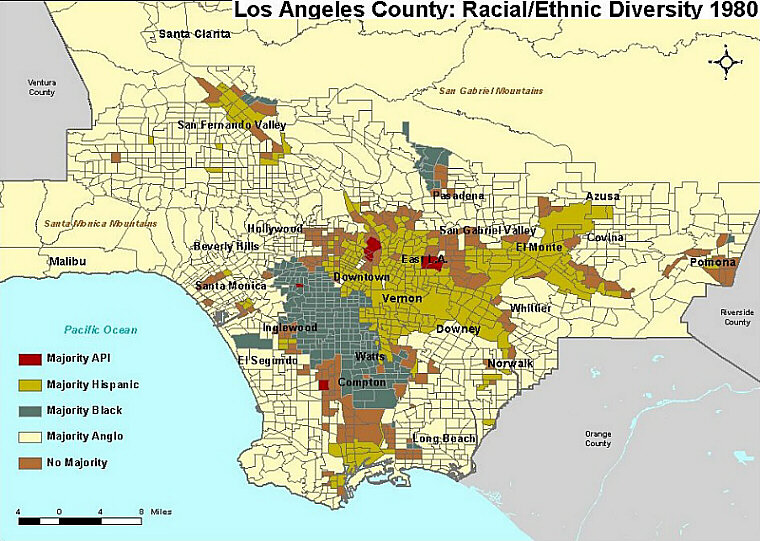
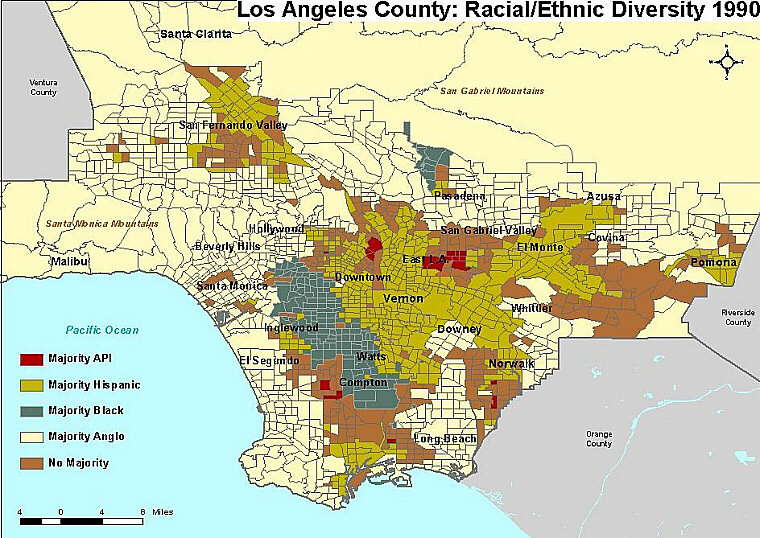
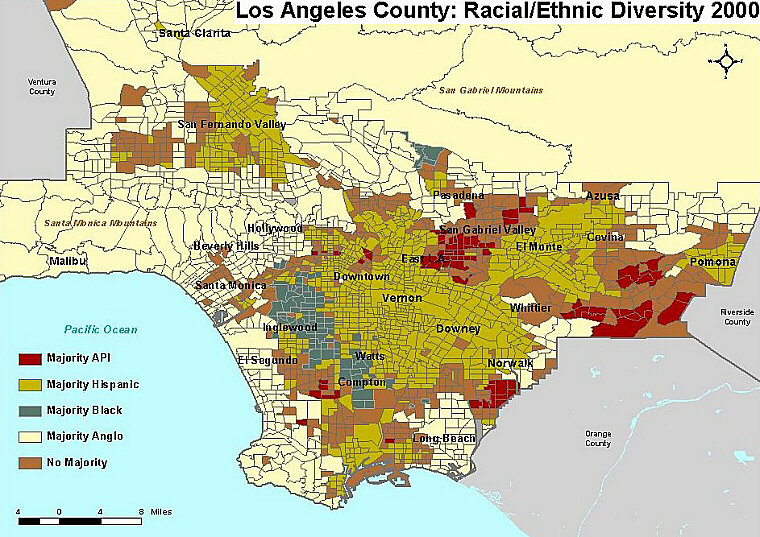
To look in more detail at perhaps the most dynamic county in the U.S. in terms of racial/ethnic diversity, the maps below are compiled by Michele Zonta and Paul Ong at the Ralph & Goldy Lewis Center for Regional Policy Analysis at UCLA. The maps illustrate different racial-ethnic distributions and concentrations in cities within Los Angeles (L.A.) County for 1980, 1990, and 2000. The results show that in 1980, the only cities that had an Asian Pacific Islander (API) majority were ones directly north of downtown and in east L.A. However, by 1990, more API majorities sprung up in east L.A. and west of Compton. Most recently in 2000, API majorities have expanded to include most of east L.A. and San Gabriel and much of the eastern part of the county.
Figure \(\PageIndex{12}\): Growth of API in Southern California. (Courtesy of Asian-Nation.org)
Undocumented Asian Americans
Tracy Buenavista (2018) states, "more than one million are undocumented Asian immigrants, or 12 percent of the total undocumented population" out of a total of about 11 million undocumented people in the U.S. (p. 79). Buenavista argues that because Asian American undocumented students are more so seen as "silent", she claims it "prevent[s] them from seeking support networks and resources among the larger undocumented immigrant community" and that even though they refrain from seeking support, they still achieve "academic mobility like college access" (p. 80).
Enriquez (2019) compares some differences between Latinx undocumented students and Asian undocumented students. One Asian undocumented immigrant recognized how they were seen differently from Mexican undocumented immigrants and how it enables them more access. “Edith Oh, a Korean [undocumented immigrant] student, noted, ‘They would probably think you’re legal here [Asians] and you followed all the laws…I guess just [because] Asians are obedient. Since they were little they listen to their parents. And they follow the laws [and] regulations' ” (p. 265). Enriquez specifically states how such assumptions about Asian undocumented immigrants helped keep them safe as people didn’t assume they were undocumented and so people were less likely to question them about lacking documentation (p. 265). There were markers that indicate a lack of foreignness to people or a status attributed to something else. “Anna Kwon, who arrived at the age of ten, explained, ‘They assume that I’m Korean American since I speak [English] fluently. So it’s like, they don’t assume that I’m undocumented’ ” (p. 266). However, she adds that if not documented, “they would think I’m an international student” (p. 266).
Evolution of Multiracial/Hapa Asian Americans
Asian Americans of mixed racial ancestry have been referred to as multiracial, mixed-race, biracial, "Hapa" (a native Hawaiian term that originally meant half Hawaiian), and Amerasian, among others. Their presence in not only the Asian American community but also in mainstream American society has a long history. However, the political, demographic, and cultural implications of their increasing numbers have only recently emerged for both Asian Americans and non-Asians alike.
The origin of mixed-race or multiracial Asian Americans can be traced back to the early period of Asian immigration to the U.S. in the mid-1700s, with large scale migrations common by the mid-1800s. Because the vast majority of these early Asian immigrants were men (mostly from the Philippines or China), in many instances, if they wanted to be in the company of women, these early Asian immigrants had little choice but to socialize with non-Asian women. Eventually, the children from these interracial unions became the first multiracial Asian Americans, especially in Hawai'i where Chinese-Native Hawaiian intermarriages were common.
Eventually, as the numbers of immigrants from Asia began to swell in the mid- and late-1800s, the native white population increasingly began to view their presence in the U.S. with hostility. Objections were raised concerning perceived economic competition with native U.S. workers that Asian immigrants supposedly posed, along with doubts over whether Asians were cultural and racially compatible with mainstream American society.
This nativist and xenophobic backlash, popularly characterized as the "anti-Chinese movement," eventually led to several pieces of legislation at the local, state, and federal levels, culminating with the Chinese Exclusion Act of 1882. These laws restricted the rights and activities of first, Chinese immigrants, then later broadened to include virtually all subsequent immigrants from Asia. Included in these restrictive laws were anti-miscegenation provisions that prevented Asians from marrying whites.
These anti-miscegenation laws were first passed in the 1600s to prevent freed Black slaves from marrying whites. Later versions added persons of Asian origin or ancestry to the list of groups forbidden to marry whites. While early examples of such anti-miscegenation laws singled out those of "Mongoloid" origin specifically, they were later amended to include Filipinos (who claimed that they were of "Malay" origin) and Asian Indians (who characterized themselves as "Aryan" in origin).
One noteworthy exception was the War Brides Act of 1945 that allowed American GIs to marry and bring over wives from Japan, China, the Philippines, and Korea. Several thousands of Asian women immigrated to the U.S. as war brides and their offspring became the first notable cohort of multiracial Asian Americans. Anti-miscegenation laws were finally declared unconstitutional in the 1967 U.S. Supreme Court Loving v. Virginia case.
Interracial marriages involving Asian Americans and their multiracial offspring started to increase significantly following the passage of the Immigration Act of 1965. This Act replaced the restrictive National Origins quota system that had been in place for the past four decades and which effectively limited the number of Asian immigrants to a token few each year.
In its place, the 1965 Immigration Act was structured around provisions that favored the immigration of family members, relatives, and professional workers. Eventually, these provisions substantially increased the numbers of Asian immigrants coming to the U.S., which in turn significantly increased the marriage pool, or the numbers of potential marriage partners, for Asians and non-Asians alike.
The end of the Viet Nam War also played an important role in increasing the numbers and visibility of multiracial Asian Americans, in this case "Amerasians" -- the children of Vietnamese mothers and American GIs who served in Viet Nam. After the fall of Saigon in and the reunification of Viet Nam in 1975, several thousand Amerasians were left behind as all remaining American personnel were evacuated. After enduring systematic discrimination and hostility back in Viet Nam as direct legacies of the U.S.'s involvement in the war, the Vietnamese Amerasian Homecoming Act of 1988 allowed approximately 25,000 Amerasians and their immediate relatives to immigrate to the U.S.
Characteristics and Demographics of Multiracials
Efforts to get an accurate national count of multiracial Asian Americans have been stymied in previous censuses since respondents could not choose more than one racial/ethnic identity. However, for the 2000 Census, the Census Bureau reversed its policy and allowed respondents to identify with more than one "race," finally allowing researchers to get a reliable count of the number of multiracial Asian Americans in the U.S.
According to the 2000 census, (The Asian Population: 2000), out of the 281,421,906 people living in the U.S., 10,242,998 of them identified themselves as entirely of Asian race (3.6%). Additionally, there were 1,655,830 people who identified themselves as being part Asian and part one or more other races (as noted in the Methodology explanation, the Census Bureau considers Hispanics/Latinos to be an ethnic, rather than a racial, group). The following table breaks down the distributions of Asian Americans who identify with more than one race.
Table \(\PageIndex{13}\): Number of Multiracial Asians by Racial/Ethnic Combinations, 2000. (Data via U.S. Census Bureau)
Number of Multiracial Asians by Racial/Ethnic Combinations, 2000
Number
% of all Multiracial Asians
Asian and Other Race(s)
1,655,830
100%
Asian and white
868,395
52.4%
Asian and Native Hawaiian/Pacific Islander
138,802
8.4%
Asian and Black/African American
106,782
6.4%
Asian and Some Other Race
249,108
15.0%
All Other Combinations, incl. Other Asian
292,743
17.7%
All Asians Alone or with Other Races
11,898,828
4.2% of Total U.S. Population
As we can see, by far the largest group of multiracial Asians are those who are half Asian and half white. Historically, many of these mixed-race Asians have also been called "Amerasians." These include older multiracial Asian Americans who are the children of war brides and U.S. military personnel stationed in countries such as Japan, the Philippines, and South Korea, along with those who are the result of more recent non-military interracial marriages involving Asian Americans.
The Hapa Issues Forum quotes a recent Congressional Record report that indicated "between 1968 and 1989, children born to parents of different races increased from 1% of total births to 3.4%." The 2000 Census further shows that 30.7% of those who identify as at least part Japanese are multiracial, the highest proportion among the six largest Asian American ethnic groups. Next are Filipinos (21.8% of whom are multiracial), Chinese (15.4%), Korean (12.3%), Asian Indian (11.6%), and Vietnamese (8.3%).
Overall, the Census Bureau reports that there are about 1.8 million Americans who identify has half-Asian and half one or more other races. Of these, 52% are half -Asian and half-white. If we include all multiracial Asian Americans as their own "ethnic" group, they would be the fourth-largest group, comprising 8% of the entire Asian American population. Multiracial Asian Americans would also be the fastest-growing group as well.
In fact, demographers predict that by the year 2020 almost 20% of all Asian Americans will be multiracial and that figure will climb to 36% by the year 2050. In other words, as intermarriages involving Asians increase, multiracial Asians are becoming a more prominent group within the Asian American community, and within mainstream American society in general.
Hawaiʻi Plantation Labor
Hawai'i became a popular place for Asian immigrants who wanted to come to the United States. They worked on largely sugar plantations for low wages, they fought for better conditions in their work and home, they were pitted against one another in their struggle against the white plantation leadership. Besides Japanese laborers, there were others that were “Hawaiians, Filipinos, Puerto Ricans, Chinese… Portuguese, and Koreans” with an “overseer” that was usually “white” (Takaki, 2008, p. 240). Women laborers made less than men despite doing the same work (Lillian Ota Takaki in Takaki, 2008, p. 240). Lillian Takaki writes, “ ‘Female field hands, for example, received an average wage of only fifty-five cents per day in 1915, compared to the seventy-eight cents for male field hands’.” (Takaki in Takaki, 2008, p. 240). Laborers complained that working in the fields was very difficult and they “worked like machines” and were “watched constantly” (Takaki, 2008, p. 240).
Takaki states that Japanese laborers were stereotyped as not causing trouble because they are “accommodating” and didn’t make a lot of noise but in reality they constantly fought back about the conditions they faced at work especially through striking (Takaki, 2008, p. 242). What Japanese and other workers realized was that when members of their group fought for better working conditions, others would be used and pitted against them through a “divide-and-control” or divide-and-conquer technique. They would amplify and pit needs and advantages against the needs and disadvantages of others and therefore attempt to highlight differences through preferences in order to squash any semblance of commonalities that people would recognize across groups. Many times groups were able to see how they were being used against one another and came together to fight for better working conditions.
From the beginning, the workers camps were cramped. Later as laborers had families, “… [planters] wanted to ‘stimulate’ a ‘home feeling’ in order to make their workers happier and more productive” (Takaki, 2008, p.247). For some of the various ethnic groups including Japanese laborers, there were religious institutions, language schools, and sometimes for many the sharing of ethnic foods (p. 248). Pidgin was created and grew into popularity, with Pidgin being "a simple English that incorporated Hawaiian, Japanese, Portuguese, and Chinese phrases as well as their rhythms and intonations" (p. 249). Pidgin was spoken on the plantation amongst the workers who created this common dialect to speak with one another. Tagalog and Ilocano were also said to have influenced Pidgin but the earlier mentioned languages were said to have the biggest influence.
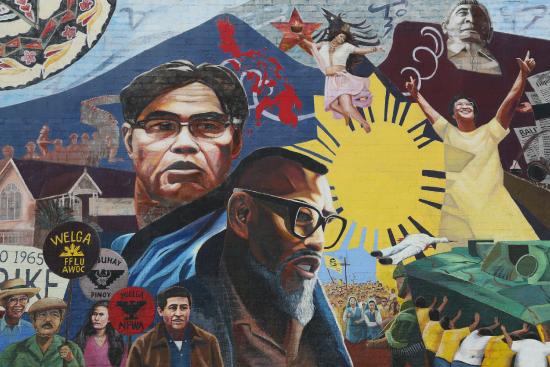
Philip Vera Cruz became the second vice-president of the United Farm Workers union (UFW) until his resignation in 1977. He was the highest-ranking Filipinx officer in the UFW. Before helping to form the UFW and leading the grape strike, Vera Cruz was an officer in the Agricultural Workers Organizing Committee (AWOC), AFL-CIO which combined with the National Farm Workers Association (NFWA) led by César Chávez and Dolores Huerta, to form the UFW (Scharlin and Villanueva 2000, 31). For Vera Cruz, participating in the UFW changed his life, stating that joining the union gave him “the opportunity to participate in the political struggles of this country…as a worker struggling along with my fellow workers for our constitutional rights” (p. 33).
Vera Cruz was a farm laborer, and when he joined the AWOC, he also studied the history of labor movements. He understood the value in multiethnic strikes, while a majority-white led Teamsters union tried to convince Filipinx workers from merging with Mexican workers. Vera Cruz, along with others in the AWOC, including Larry Itliong, understood that “we must unite all the races so we’ll have one strong union that represents all workers. We explained how in the past you could see that because the workers were divided they were weak” (Scharlin and Villanueva, 2000, p. 46), also pointing out that growers would play one group off another in order to maximize their profits. Vera Cruz noted that Itliong had reservations about merging with Mexican workers, fearing that Filipinx workers would be pushed out, but ultimately he felt that his primary goal was to improve the conditions for all farm workers. On August 1966, a year into the grape strike, the AWOC and NFWA merged and turned into one union: the United Farm Workers Organizing Committee (UFW), vastly supported by both Filipinx and Mexican farm workers. Vera Cruz also pointed out the role that Teamsters played to “fan the flames” between whatever disputes existed between Filipinx and Mexican farm workers, eager to bring Filipinx members over to their union (p. 49). See also Chapter 11, section 11.5 on the agricultural labor movement in California.
From Colonization to Nursing
Catherine Ceniza Choy (2019), writes that “U.S. colonization” greatly contributed to the high amount of Filipinx nurses in the United States due to “Americanized professional nurse training,” English being one of the main languages for exams, and the presence of other types of medical nursing courses to students. Choy further writes, “According to the 2016 Survey of California Registered Nurses, Filipinos make up the second largest group of the state’s active RN workforce, nearly 18 percent. Among younger nurses, they’re even more predominant, with Filipino nurses representing nearly a quarter of nurses between ages 35 to 44 years and more than one-fifth of RNs 45 to 54 years old” (2019). However, “from Covid, Filipino nurses are just 4 percent of the nursing workforce in the United States, but constitute nearly one-third of nursing deaths due to Covid-19, according to a research study conducted by National Nurses United last fall” (Ocampo, 2021).
Choy (2019) writes,
Filipino immigrant nurses also bring experience with Philippine traditional therapies such as hilot, faith healing, and the use of medicinal plants. Hilot is a traditional form of massage therapy or chiropractic manipulation that relieves aches and pains. This knowledge of Philippine healing modalities is important not solely because the use of alternative therapies in the U.S. has become more mainstream, but also because a growing number of Americans are of Filipino heritage. Between 1980 and 2016, the Filipino immigrant population in the United States nearly quadrupled. California is home to the largest Filipino-American population in the nation with over 1.6 million of Filipino descent (Choy, 2019).

 Japantown
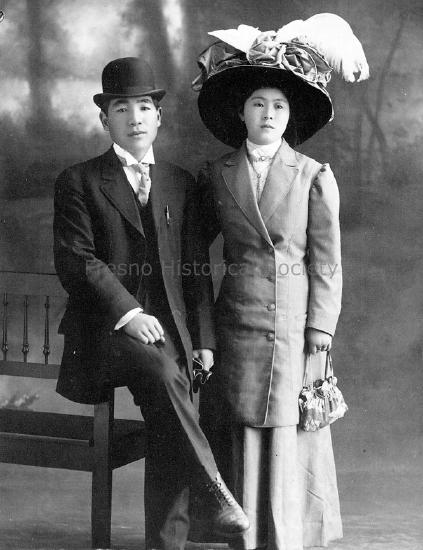 Japanese immigrants began their journey to the United States in search of a better life in the late 1800s, escaping instability in Japan. They faced hardships such as hostile neighbors, tough working conditions, and legislative attacks.
 In Fresno, Chinatown was home to another group of Japanese Americans. Several of the most popular businesses in Chinatown were owned by Japanese families including attorney Y. R. Hiraoka, Dentist Dr. F. Inada, and Royal Jewlers. Nakamura Cyclery was one of those places where local kids hung out. The store opened around 1915 and eventually sold more than just bicycles, selling guns, ammunition, fishing tackle, paints, and hardware by the 1930's.