
6.3.2: Who the Poor Are- Social Patterns of Poverty
- Page ID
- 90921
Learning Objectives
- Describe racial/ethnic differences in the poverty rate.
- Discuss how family structure is related to the poverty rate.
- Explain what poverty and labor force participation data imply about the belief that many poor people lack the motivation to work.
Who are the poor? Although the official poverty rate in 2010 was 15.1 percent, this rate differs by the important sociodemographic characteristics of race/ethnicity, gender, and age, and it also differs by region of the nation and by family structure. The poverty rate differences based on these variables are critical to understanding the nature and social patterning of poverty in the United States. We look at each of these variables in turn with 2010 census data (DeNavas-Walt, et, al., 2011).
Race/Ethnicity
-
Here is a quick quiz; please circle the correct answer.
-
Most poor people in the United States are
- Black/African American
- Latino
- Native American
- Asian
- White
-
-
What did you circle? If you are like the majority of people who answer a similar question in public opinion surveys, you would have circled a. Black/African American. When Americans think about poor people, they tend to picture African Americans (White, 2007). This popular image is thought to reduce the public’s sympathy for poor people and to lead them to oppose increased government aid for the poor. The public’s views on these matters are, in turn, thought to play a key role in government poverty policy. It is thus essential for the public to have an accurate understanding of the racial/ethnic patterning of poverty.

The most typical poor people in the United States are non-Latino whites. These individuals comprise 42.4 percent of all poor Americans.Franco Folini – Homeless guys with dogs – CC BY-SA 2.0.
Unfortunately, the public’s racial image of poor people is mistaken, as census data reveal that the most typical poor person is white (non-Latino). To be more precise, 42.4 percent of poor people are white (non-Latino), 28.7 percent are Latino, 23.1 percent are black, and 3.7 percent are Asian (see Figure 2.2 “Racial and Ethnic Composition of the Poor, 2010 (Percentage of Poor Persons Who Belong to Each Group)”). As these figures show, non-Latino whites certainly comprise the greatest number of the American poor. Turning these percentages into numbers, they account for 19.6 million of the 46.2 million poor Americans.
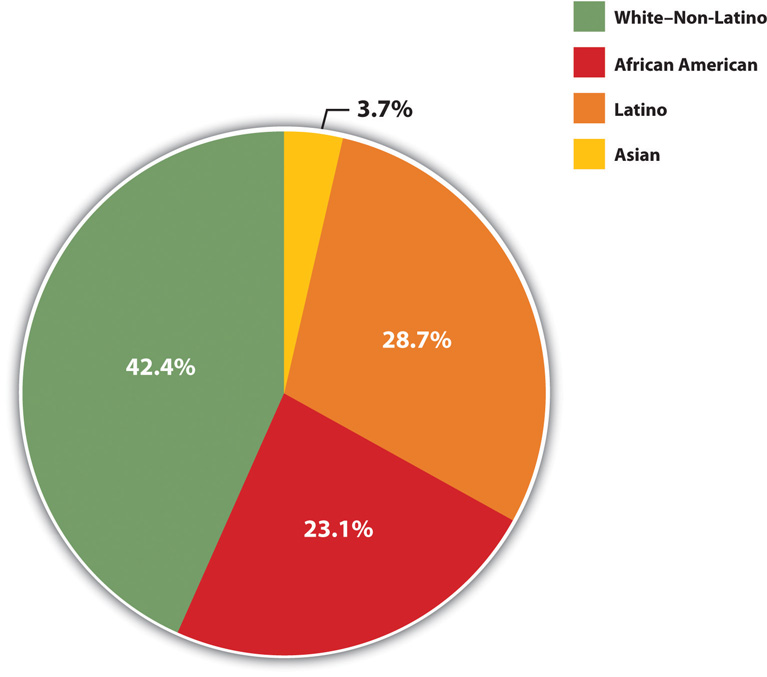
Figure 2.2 Racial and Ethnic Composition of the Poor, 2010 (Percentage of Poor Persons Who Belong to Each Group). Source: Data from DeNavas-Walt, C., Proctor, B. D., & Smith, J. C. (2011). Income, poverty, and health insurance coverage in the United States: 2010 (Current Population Report P60-239). Washington, DC: US Census Bureau.
It is also true, though, that race and ethnicity affect the chances of being poor. While only 9.9 percent of non-Latino whites are poor, 27.4 percent of African Americans, 12.1 percent of Asians, and 26.6 percent of Latinos (who may be of any race) are poor (see Figure 2.3 “Race, Ethnicity, and Poverty, 2010 (Percentage of Each Group That Is Poor)”). Thus African Americans and Latinos are almost three times as likely as non-Latino whites to be poor. (Because there are so many non-Latino whites in the United States, the greatest number of poor people are non-Latino white, even if the percentage of whites who are poor is relatively low.) The higher poverty rates of people of color are so striking and important that they have been termed the “colors of poverty” (Lin & Harris, 2008).
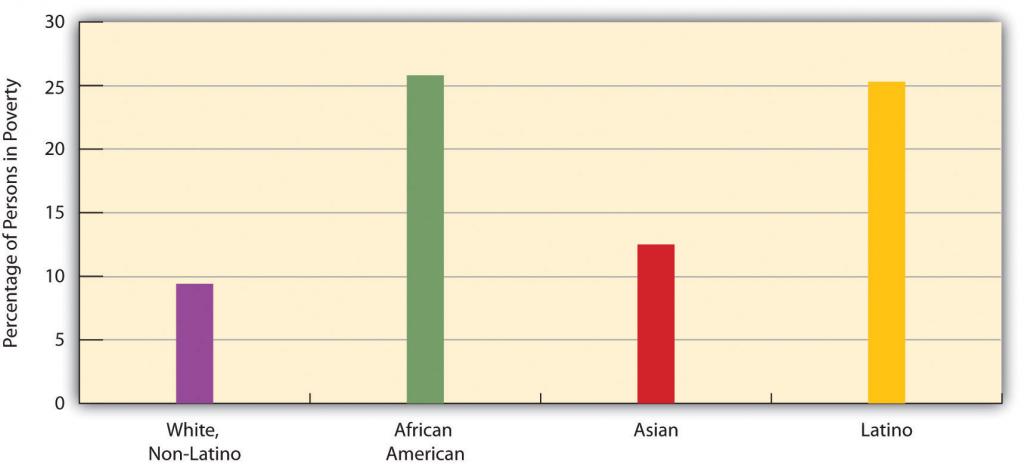
Figure 2.3 Race, Ethnicity, and Poverty, 2010 (Percentage of Each Group That Is Poor) Source: Data from DeNavas-Walt, C., Proctor, B. D., & Smith, J. C. (2011). Income, poverty, and health insurance coverage in the United States: 2010 (Current Population Report P60-239). Washington, DC: US Census Bureau.