
6.3.5: Global Poverty
- Page ID
- 90924
Learning Objectives
- Describe where poor nations tend to be located.
- Explain the difference between the modernization and dependency theories of poverty.
- List some of the consequences of global poverty.
As serious as poverty is in the United States, poverty in much of the rest of the world is beyond comprehension to the average American. Many of the world’s poor live in such desperate circumstances that they would envy the lives of poor Americans. Without at all meaning to minimize the plight of the American poor, this section provides a brief look at the world’s poor and at the dimensions of global poverty
Global Inequality
The world has a few very rich nations and many very poor nations, and there is an enormous gulf between these two extremes. If the world were one nation, its median annual income (at which half of the world’s population is below this income and half is above it) would be only $1,700 (Dikhanov, 2005). The richest fifth of the world’s population would have three-fourths of the world’s entire income, while the poorest fifth of the world’s population would have only 1.5 percent of the world’s income, and the poorest two-fifths would have only 5.0 percent of the world’s income (Dikhanov, 2005). Reflecting this latter fact, these poorest two-fifths, or about 2 billion people, live on less than $2 per day (United Nations Development Programme, 2009). As Figure 2.5 “Global Income Distribution (Percentage of World Income Held by Each Fifth of World Population)” illustrates, this distribution of income resembles a champagne glass.
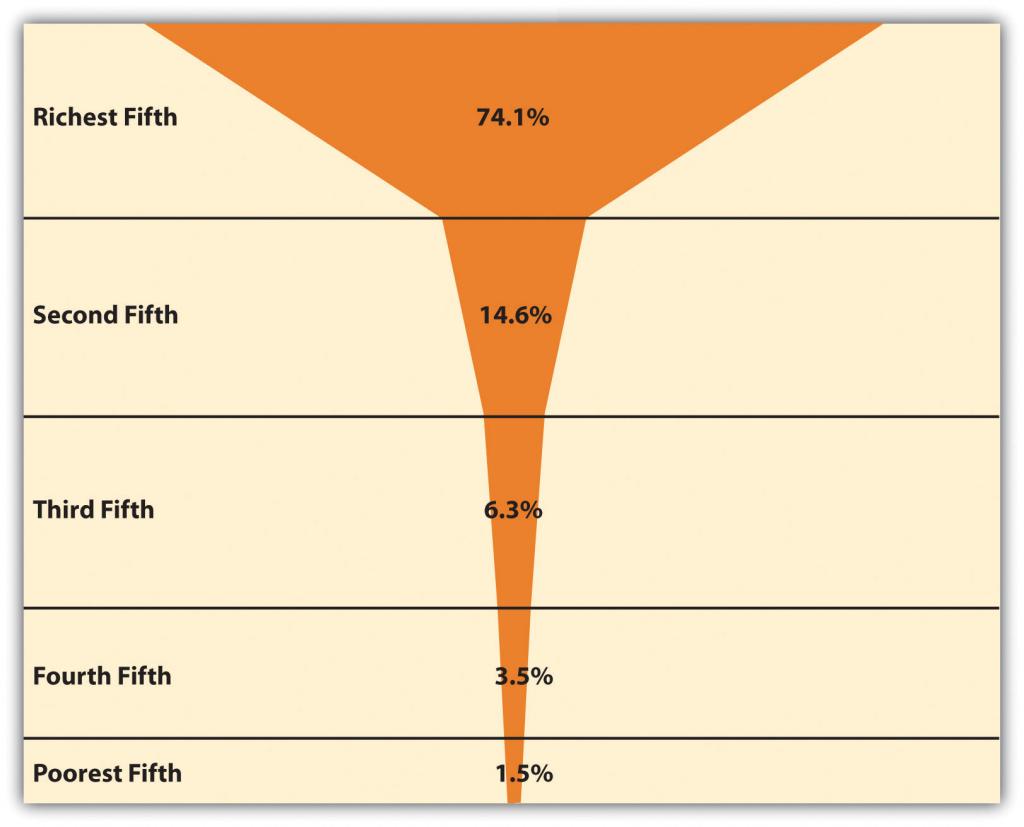
Figure 2.5 Global Income Distribution (Percentage of World Income Held by Each Fifth of World Population)
Source: Data from Dikhanov, Y. (2005). Trends in global income distribution, 1970–2000, and scenarios for 2015. New York, NY: United Nations Development Programme.
To understand global inequality, it is helpful to classify nations into a small number of categories based on their degree of wealth or poverty, their level of industrialization and economic development, and related factors. Over the decades, scholars and international organizations such as the United Nations and the World Bank have used various classification systems, or typologies. A popular typology today simply ranks nations into groups called wealthy (or high-income) nations, middle-income nations, and poor (or low-income) nations, based on measures such as gross domestic product (GDP) per capita (the total value of a nation’s goods and services divided by its population). This typology has the advantage of emphasizing the most important variable in global stratification: how much wealth a nation has. At the risk of being somewhat simplistic, the other important differences among the world’s nations all stem from their degree of wealth or poverty. Figure 2.6 “Global Stratification Map” depicts these three categories of nations (with the middle category divided into upper-middle and lower-middle). As should be clear, whether a nation is wealthy, middle income, or poor is heavily related to the continent on which it is found.
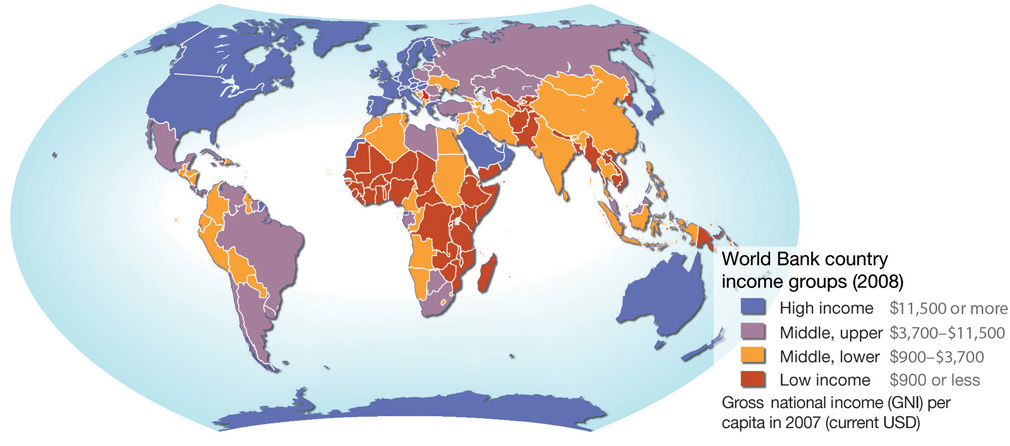
Figure 2.6 Global Stratification Map
Source: Adapted from UNEP/GRID-Arendal Maps and Graphics Library. (2009).Country income groups (World Bank classification). Retrieved from http://maps.grida.no/go/graphic/coun...classification.