
8.6: How We See
- Page ID
- 59902
\( \newcommand{\vecs}[1]{\overset { \scriptstyle \rightharpoonup} {\mathbf{#1}} } \)
\( \newcommand{\vecd}[1]{\overset{-\!-\!\rightharpoonup}{\vphantom{a}\smash {#1}}} \)
\( \newcommand{\dsum}{\displaystyle\sum\limits} \)
\( \newcommand{\dint}{\displaystyle\int\limits} \)
\( \newcommand{\dlim}{\displaystyle\lim\limits} \)
\( \newcommand{\id}{\mathrm{id}}\) \( \newcommand{\Span}{\mathrm{span}}\)
( \newcommand{\kernel}{\mathrm{null}\,}\) \( \newcommand{\range}{\mathrm{range}\,}\)
\( \newcommand{\RealPart}{\mathrm{Re}}\) \( \newcommand{\ImaginaryPart}{\mathrm{Im}}\)
\( \newcommand{\Argument}{\mathrm{Arg}}\) \( \newcommand{\norm}[1]{\| #1 \|}\)
\( \newcommand{\inner}[2]{\langle #1, #2 \rangle}\)
\( \newcommand{\Span}{\mathrm{span}}\)
\( \newcommand{\id}{\mathrm{id}}\)
\( \newcommand{\Span}{\mathrm{span}}\)
\( \newcommand{\kernel}{\mathrm{null}\,}\)
\( \newcommand{\range}{\mathrm{range}\,}\)
\( \newcommand{\RealPart}{\mathrm{Re}}\)
\( \newcommand{\ImaginaryPart}{\mathrm{Im}}\)
\( \newcommand{\Argument}{\mathrm{Arg}}\)
\( \newcommand{\norm}[1]{\| #1 \|}\)
\( \newcommand{\inner}[2]{\langle #1, #2 \rangle}\)
\( \newcommand{\Span}{\mathrm{span}}\) \( \newcommand{\AA}{\unicode[.8,0]{x212B}}\)
\( \newcommand{\vectorA}[1]{\vec{#1}} % arrow\)
\( \newcommand{\vectorAt}[1]{\vec{\text{#1}}} % arrow\)
\( \newcommand{\vectorB}[1]{\overset { \scriptstyle \rightharpoonup} {\mathbf{#1}} } \)
\( \newcommand{\vectorC}[1]{\textbf{#1}} \)
\( \newcommand{\vectorD}[1]{\overrightarrow{#1}} \)
\( \newcommand{\vectorDt}[1]{\overrightarrow{\text{#1}}} \)
\( \newcommand{\vectE}[1]{\overset{-\!-\!\rightharpoonup}{\vphantom{a}\smash{\mathbf {#1}}}} \)
\( \newcommand{\vecs}[1]{\overset { \scriptstyle \rightharpoonup} {\mathbf{#1}} } \)
\(\newcommand{\longvect}{\overrightarrow}\)
\( \newcommand{\vecd}[1]{\overset{-\!-\!\rightharpoonup}{\vphantom{a}\smash {#1}}} \)
\(\newcommand{\avec}{\mathbf a}\) \(\newcommand{\bvec}{\mathbf b}\) \(\newcommand{\cvec}{\mathbf c}\) \(\newcommand{\dvec}{\mathbf d}\) \(\newcommand{\dtil}{\widetilde{\mathbf d}}\) \(\newcommand{\evec}{\mathbf e}\) \(\newcommand{\fvec}{\mathbf f}\) \(\newcommand{\nvec}{\mathbf n}\) \(\newcommand{\pvec}{\mathbf p}\) \(\newcommand{\qvec}{\mathbf q}\) \(\newcommand{\svec}{\mathbf s}\) \(\newcommand{\tvec}{\mathbf t}\) \(\newcommand{\uvec}{\mathbf u}\) \(\newcommand{\vvec}{\mathbf v}\) \(\newcommand{\wvec}{\mathbf w}\) \(\newcommand{\xvec}{\mathbf x}\) \(\newcommand{\yvec}{\mathbf y}\) \(\newcommand{\zvec}{\mathbf z}\) \(\newcommand{\rvec}{\mathbf r}\) \(\newcommand{\mvec}{\mathbf m}\) \(\newcommand{\zerovec}{\mathbf 0}\) \(\newcommand{\onevec}{\mathbf 1}\) \(\newcommand{\real}{\mathbb R}\) \(\newcommand{\twovec}[2]{\left[\begin{array}{r}#1 \\ #2 \end{array}\right]}\) \(\newcommand{\ctwovec}[2]{\left[\begin{array}{c}#1 \\ #2 \end{array}\right]}\) \(\newcommand{\threevec}[3]{\left[\begin{array}{r}#1 \\ #2 \\ #3 \end{array}\right]}\) \(\newcommand{\cthreevec}[3]{\left[\begin{array}{c}#1 \\ #2 \\ #3 \end{array}\right]}\) \(\newcommand{\fourvec}[4]{\left[\begin{array}{r}#1 \\ #2 \\ #3 \\ #4 \end{array}\right]}\) \(\newcommand{\cfourvec}[4]{\left[\begin{array}{c}#1 \\ #2 \\ #3 \\ #4 \end{array}\right]}\) \(\newcommand{\fivevec}[5]{\left[\begin{array}{r}#1 \\ #2 \\ #3 \\ #4 \\ #5 \\ \end{array}\right]}\) \(\newcommand{\cfivevec}[5]{\left[\begin{array}{c}#1 \\ #2 \\ #3 \\ #4 \\ #5 \\ \end{array}\right]}\) \(\newcommand{\mattwo}[4]{\left[\begin{array}{rr}#1 \amp #2 \\ #3 \amp #4 \\ \end{array}\right]}\) \(\newcommand{\laspan}[1]{\text{Span}\{#1\}}\) \(\newcommand{\bcal}{\cal B}\) \(\newcommand{\ccal}{\cal C}\) \(\newcommand{\scal}{\cal S}\) \(\newcommand{\wcal}{\cal W}\) \(\newcommand{\ecal}{\cal E}\) \(\newcommand{\coords}[2]{\left\{#1\right\}_{#2}}\) \(\newcommand{\gray}[1]{\color{gray}{#1}}\) \(\newcommand{\lgray}[1]{\color{lightgray}{#1}}\) \(\newcommand{\rank}{\operatorname{rank}}\) \(\newcommand{\row}{\text{Row}}\) \(\newcommand{\col}{\text{Col}}\) \(\renewcommand{\row}{\text{Row}}\) \(\newcommand{\nul}{\text{Nul}}\) \(\newcommand{\var}{\text{Var}}\) \(\newcommand{\corr}{\text{corr}}\) \(\newcommand{\len}[1]{\left|#1\right|}\) \(\newcommand{\bbar}{\overline{\bvec}}\) \(\newcommand{\bhat}{\widehat{\bvec}}\) \(\newcommand{\bperp}{\bvec^\perp}\) \(\newcommand{\xhat}{\widehat{\xvec}}\) \(\newcommand{\vhat}{\widehat{\vvec}}\) \(\newcommand{\uhat}{\widehat{\uvec}}\) \(\newcommand{\what}{\widehat{\wvec}}\) \(\newcommand{\Sighat}{\widehat{\Sigma}}\) \(\newcommand{\lt}{<}\) \(\newcommand{\gt}{>}\) \(\newcommand{\amp}{&}\) \(\definecolor{fillinmathshade}{gray}{0.9}\)- Describe the basic anatomy of the visual system
- Describe how light waves enable vision
Anatomy of the Visual System
The eye is the major sensory organ involved in vision (Figure 1). Light waves are transmitted across the cornea and enter the eye through the pupil. The cornea is the transparent covering over the eye. It serves as a barrier between the inner eye and the outside world, and it is involved in focusing light waves that enter the eye. The pupil is the small opening in the eye through which light passes, and the size of the pupil can change as a function of light levels as well as emotional arousal. When light levels are low, the pupil will become dilated, or expanded, to allow more light to enter the eye. When light levels are high, the pupil will constrict, or become smaller, to reduce the amount of light that enters the eye. The pupil’s size is controlled by muscles that are connected to the iris, which is the colored portion of the eye.
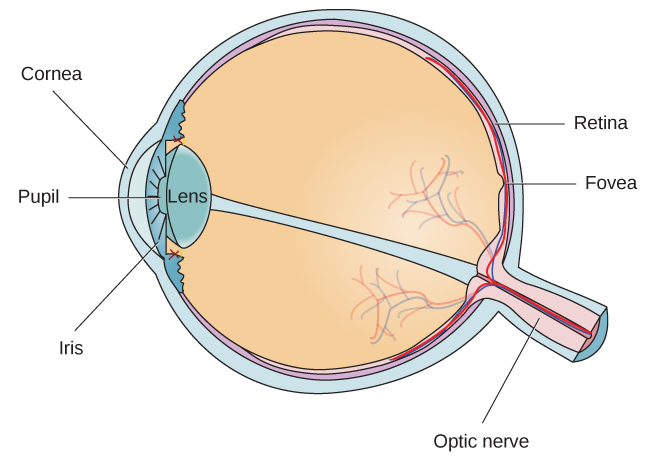
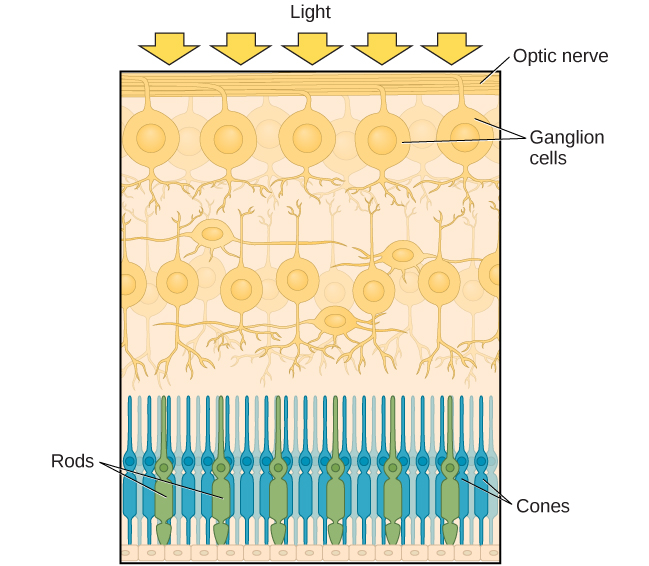
After passing through the pupil, light crosses the lens, a curved, transparent structure that serves to provide additional focus. The lens is attached to muscles that can change its shape to aid in focusing light that is reflected from near or far objects. In a normal-sighted individual, the lens will focus images perfectly on a small indentation in the back of the eye known as the fovea, which is part of the retina, the light-sensitive lining of the eye. The fovea contains densely packed specialized photoreceptor cells (Figure 2). These photoreceptor cells, known as cones, are light-detecting cells. The cones are specialized types of photoreceptors that work best in bright light conditions. Cones are very sensitive to acute detail and provide tremendous spatial resolution. They also are directly involved in our ability to perceive color.
While cones are concentrated in the fovea, where images tend to be focused, rods, another type of photoreceptor, are located throughout the remainder of the retina. Rods are specialized photoreceptors that work well in low light conditions, and while they lack the spatial resolution and color function of the cones, they are involved in our vision in dimly lit environments as well as in our perception of movement on the periphery of our visual field.
We have all experienced the different sensitivities of rods and cones when making the transition from a brightly lit environment to a dimly lit environment. Imagine going to see a blockbuster movie on a clear summer day. As you walk from the brightly lit lobby into the dark theater, you notice that you immediately have difficulty seeing much of anything. After a few minutes, you begin to adjust to the darkness and can see the interior of the theater. In the bright environment, your vision was dominated primarily by cone activity. As you move to the dark environment, rod activity dominates, but there is a delay in transitioning between the phases. If your rods do not transform light into nerve impulses as easily and efficiently as they should, you will have difficulty seeing in dim light, a condition known as night blindness.
Rods and cones are connected (via several interneurons) to retinal ganglion cells. Axons from the retinal ganglion cells converge and exit through the back of the eye to form the optic nerve. The optic nerve carries visual information from the retina to the brain. There is a point in the visual field called the blind spot: Even when light from a small object is focused on the blind spot, we do not see it. We are not consciously aware of our blind spots for two reasons: First, each eye gets a slightly different view of the visual field; therefore, the blind spots do not overlap. Second, our visual system fills in the blind spot so that although we cannot respond to visual information that occurs in that portion of the visual field, we are also not aware that information is missing.
Try It
Query \(\PageIndex{1}\)
The optic nerve from each eye merges just below the brain at a point called the optic chiasm. As Figure 3 shows, the optic chiasm is an X-shaped structure that sits just below the cerebral cortex at the front of the brain. At the point of the optic chiasm, information from the right visual field (which comes from both eyes) is sent to the left side of the brain, and information from the left visual field is sent to the right side of the brain.
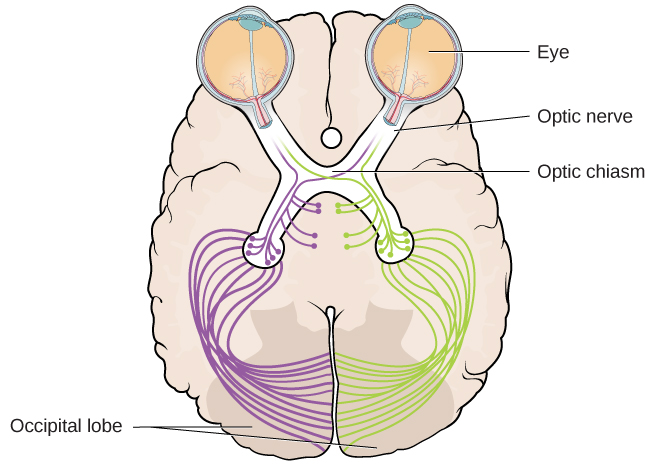
Once inside the brain, visual information is sent via a number of structures to the occipital lobe at the back of the brain for processing. Visual information might be processed in parallel pathways which can generally be described as the “what pathway” (the ventral pathway) and the “where/how” pathway (the dorsal pathway). The “what pathway” is involved in object recognition and identification, while the “where/how pathway” is involved with location in space and how one might interact with a particular visual stimulus (Milner & Goodale, 2008; Ungerleider & Haxby, 1994). For example, when you see a ball rolling down the street, the “what pathway” identifies what the object is, and the “where/how pathway” identifies its location or movement in space.
Try It
Query \(\PageIndex{2}\)
Query \(\PageIndex{3}\)
Query \(\PageIndex{4}\)
Query \(\PageIndex{5}\)
Amplitude and Wavelength
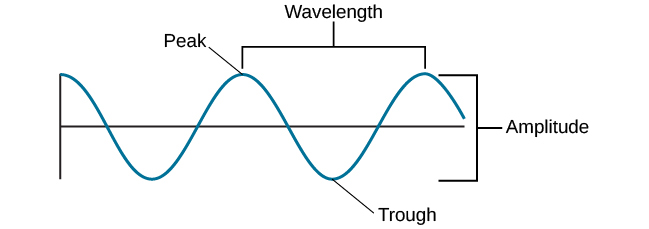
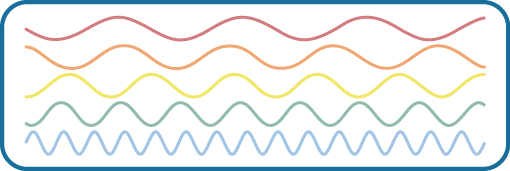
As mentioned above, light enters your eyes as a wave. It is important to understand some basic properties of waves to see how they impact what we see. Two physical characteristics of a wave are amplitude and wavelength (Figure 5). The amplitude of a wave is the height of a wave as measured from the highest point on the wave (peak or crest) to the lowest point on the wave (trough). Wavelength refers to the length of a wave from one peak to the next.
Wavelength is directly related to the frequency of a given wave form. Frequency refers to the number of waves that pass a given point in a given time period and is often expressed in terms of hertz (Hz), or cycles per second. Longer wavelengths will have lower frequencies, and shorter wavelengths will have higher frequencies (Figure 6).
Light Waves
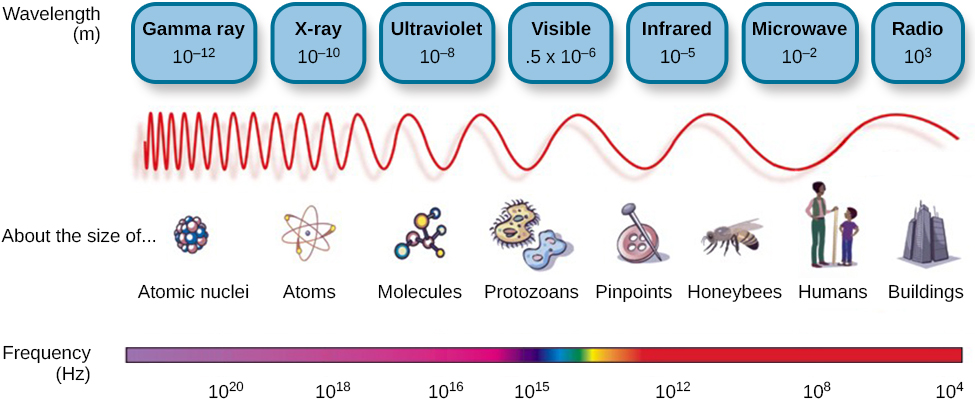
The visible spectrum is the portion of the larger electromagnetic spectrum that we can see. As Figure 7 shows, the electromagnetic spectrum encompasses all of the electromagnetic radiation that occurs in our environment and includes gamma rays, x-rays, ultraviolet light, visible light, infrared light, microwaves, and radio waves. The visible spectrum in humans is associated with wavelengths that range from 380 to 740 nm—a very small distance, since a nanometer (nm) is one billionth of a meter. Other species can detect other portions of the electromagnetic spectrum. For instance, honeybees can see light in the ultraviolet range (Wakakuwa, Stavenga, & Arikawa, 2007), and some snakes can detect infrared radiation in addition to more traditional visual light cues (Chen, Deng, Brauth, Ding, & Tang, 2012; Hartline, Kass, & Loop, 1978).
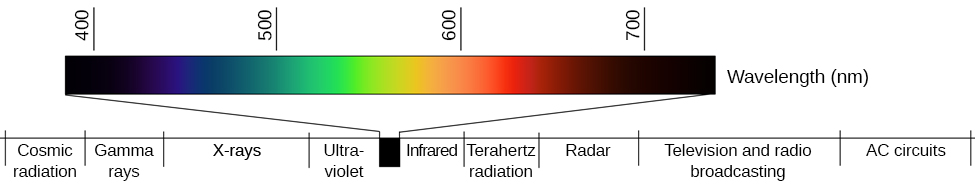
In humans, light wavelength is associated with perception of color (Figure 8). Within the visible spectrum, our experience of red is associated with longer wavelengths, greens are intermediate, and blues and violets are shorter in wavelength. (An easy way to remember this is the mnemonic ROYGBIV: red, orange, yellow, green, blue, indigo, violet.) The amplitude of light waves is associated with our experience of brightness or intensity of color, with larger amplitudes appearing brighter.
Try It
Query \(\PageIndex{6}\)
Query \(\PageIndex{7}\)
Query \(\PageIndex{8}\)
Query \(\PageIndex{9}\)
Query \(\PageIndex{10}\)
Query \(\PageIndex{11}\)
Glossary
amplitude: height of a wave
blind spot: point where we cannot respond to visual information in that portion of the visual field
cone: specialized photoreceptor that works best in bright light conditions and detects color
cornea: transparent covering over the eye
electromagnetic spectrum: all the electromagnetic radiation that occurs in our environment
fovea: small indentation in the retina that contains cones
frequency: number of waves that pass a given point in a given time period
hertz (Hz): cycles per second; measure of frequency
iris: colored portion of the eye
lens: curved, transparent structure that provides additional focus for light entering the eye
optic chiasm: X-shaped structure that sits just below the brain’s ventral surface; represents the merging of the optic nerves from the two eyes and the separation of information from the two sides of the visual field to the opposite side of the brain
optic nerve: carries visual information from the retina to the brain
peak: (also, crest) highest point of a wave
photoreceptor: light-detecting cell
pupil: small opening in the eye through which light passes
retina: light-sensitive lining of the eye
rod: specialized photoreceptor that works well in low light conditions
trough: lowest point of a wave
visible spectrum: portion of the electromagnetic spectrum that we can see
wavelength: length of a wave from one peak to the next peak
Licenses and Attributions
CC licensed content, Shared previously
- Vision, Waves and Wavelengths. Authored by: OpenStax College. Located at: http://cnx.org/contents/Sr8Ev5Og@5.49:E-7sLQFP@5/Vision. License: CC BY: Attribution. License Terms: Download for free at http://cnx.org/content/col11629/latest/.
- Vision, information on ventral and dorsal pathways. Authored by: Simona Buetti and Alejandro Lleras . Provided by: University of Illinois at Urbana-Champaign. Located at: http://nobaproject.com/modules/vision. License: CC BY-NC-SA: Attribution-NonCommercial-ShareAlike
- Waves and Wavelengths. Authored by: OpenStax College. Located at: http://cnx.org/contents/Sr8Ev5Og@5.52:1Cicp6CO@8/Waves-and-Wavelengths. License: CC BY: Attribution. License Terms: Download for free at http://cnx.org/contents/4abf04bf-93a...fd46e68cc@5.48