Learning Objectives
By the end of this section, you will be able to:
- Understand how individual measures of public opinion affect aggregate measures of public opinion
Public Opinion Polls
The public opinion poll is the most common way to measure public opinion. Using this method, scientists interview (survey) a broad pool of citizens and draw inferences (reasonable guesses) from the responses.
Imagine you are making a large pot of spaghetti sauce. But you want to test the sauce before you serve it to others. By tasting a sample you can make a reasonable guess as to what the entire batch of sauce tastes like. The small spoon you use to test the sauce must contain all the ingredients and seasoning proportionally to the larger pot of sauce. It’s the same dynamic in polling (NBC News Learn 2020). If we want to gauge what the public believes on a set of issues, then our sample must include all the different combinations of demographics and regional influences in that larger body.
How does a smaller sample truly represent the larger public? First, it must be representative, or have all the same features and elements as the larger body. To achieve this, researchers and political scientists use randomization when choosing respondents. Through this process, everyone has an equal chance of being chosen for the smaller representative sample.
Imagine, if you had a perfectly weighted six-sided die. If you rolled it six times, odds are you will not get one of each number. If you rolled the dice 60 times, you’ll probably get at least a couple of rolls with each number. If you rolled the dice 600 times, you’ll get closer to 100 for each number. And if you rolled the dice 6000 times, you would get even closer to an equal distribution. In other words, the more times you roll the die, the more likely you are to have an equal distribution of each number.
Even when following the laws of randomization, all public polls have a margin of error, which is a statistical estimation of the accuracy of your sample. Getting back to the sauce analogy, if you use a larger spoon to sample your spaghetti sauce, you’ll likely get more of all the active ingredients than if you use a smaller spoon. The larger spoon will have a lower margin of error than the smaller spoon. In other words, statistically, the larger random sample is more likely to be accurate than the smaller one.
When reading polls, this number is represented by using a “+/-” classification. So, if the poll claims that 45% of the public enjoys a particular beverage, and the margin of error is “+/- 5%”, that means the polling is really claiming that somewhere between 40-50% enjoy that particular drink. How do you know if the actual number is 40% and not 42% or 45%? The short answer is we do not. If we get a larger sample, we may be able to reduce our margin of error and get a more precise snapshot, but that’s about the only alternative. Public opinion polling is a tool designed to estimate the public’s view. As long as one knows the limitations of this tool then polls can be a valuable technique to gauge opinion.
Focus Groups
Another way to measure public opinion is by using a focus group, or small subset of individuals that are exposed to a treatment of some kind and then are asked about their impressions of that treatment. In this format, group members are allowed to interject their opinions, which provides more real-life interaction that can be organically followed. Focus groups are a wonderful tool to see how opinions can be formed or how dominant personalities can influence those around them, but can not be generalized to the public at large.
Modes of Contact and Types of Polls
The best scientific polls are usually done over the phone by Random Digit Dial (RDD).
Advantages
- Computers can make contact with many individuals within a short period of time
- Phone numbers can be randomly dialed, which is one way to achieve a random sample
- Findings are more accurate
Disadvantages
- Biases against individuals who do not have phones, primarily only using cell phones
- Can be expensive (time to call thousands of respondents, collect, calculate, and interpret data)
Online polls have been used with greater frequency as technology has evolved. Potential problems will quickly manifest. Many people are skeptical of unknown sources. Low response rates make the results less accurate, because there is uncertainty as to what population is answering the question. Some pollsters may offer financial incentives (like a gift card or a lottery drawing) to improve their response rate, which create bias.
Examples of political polls
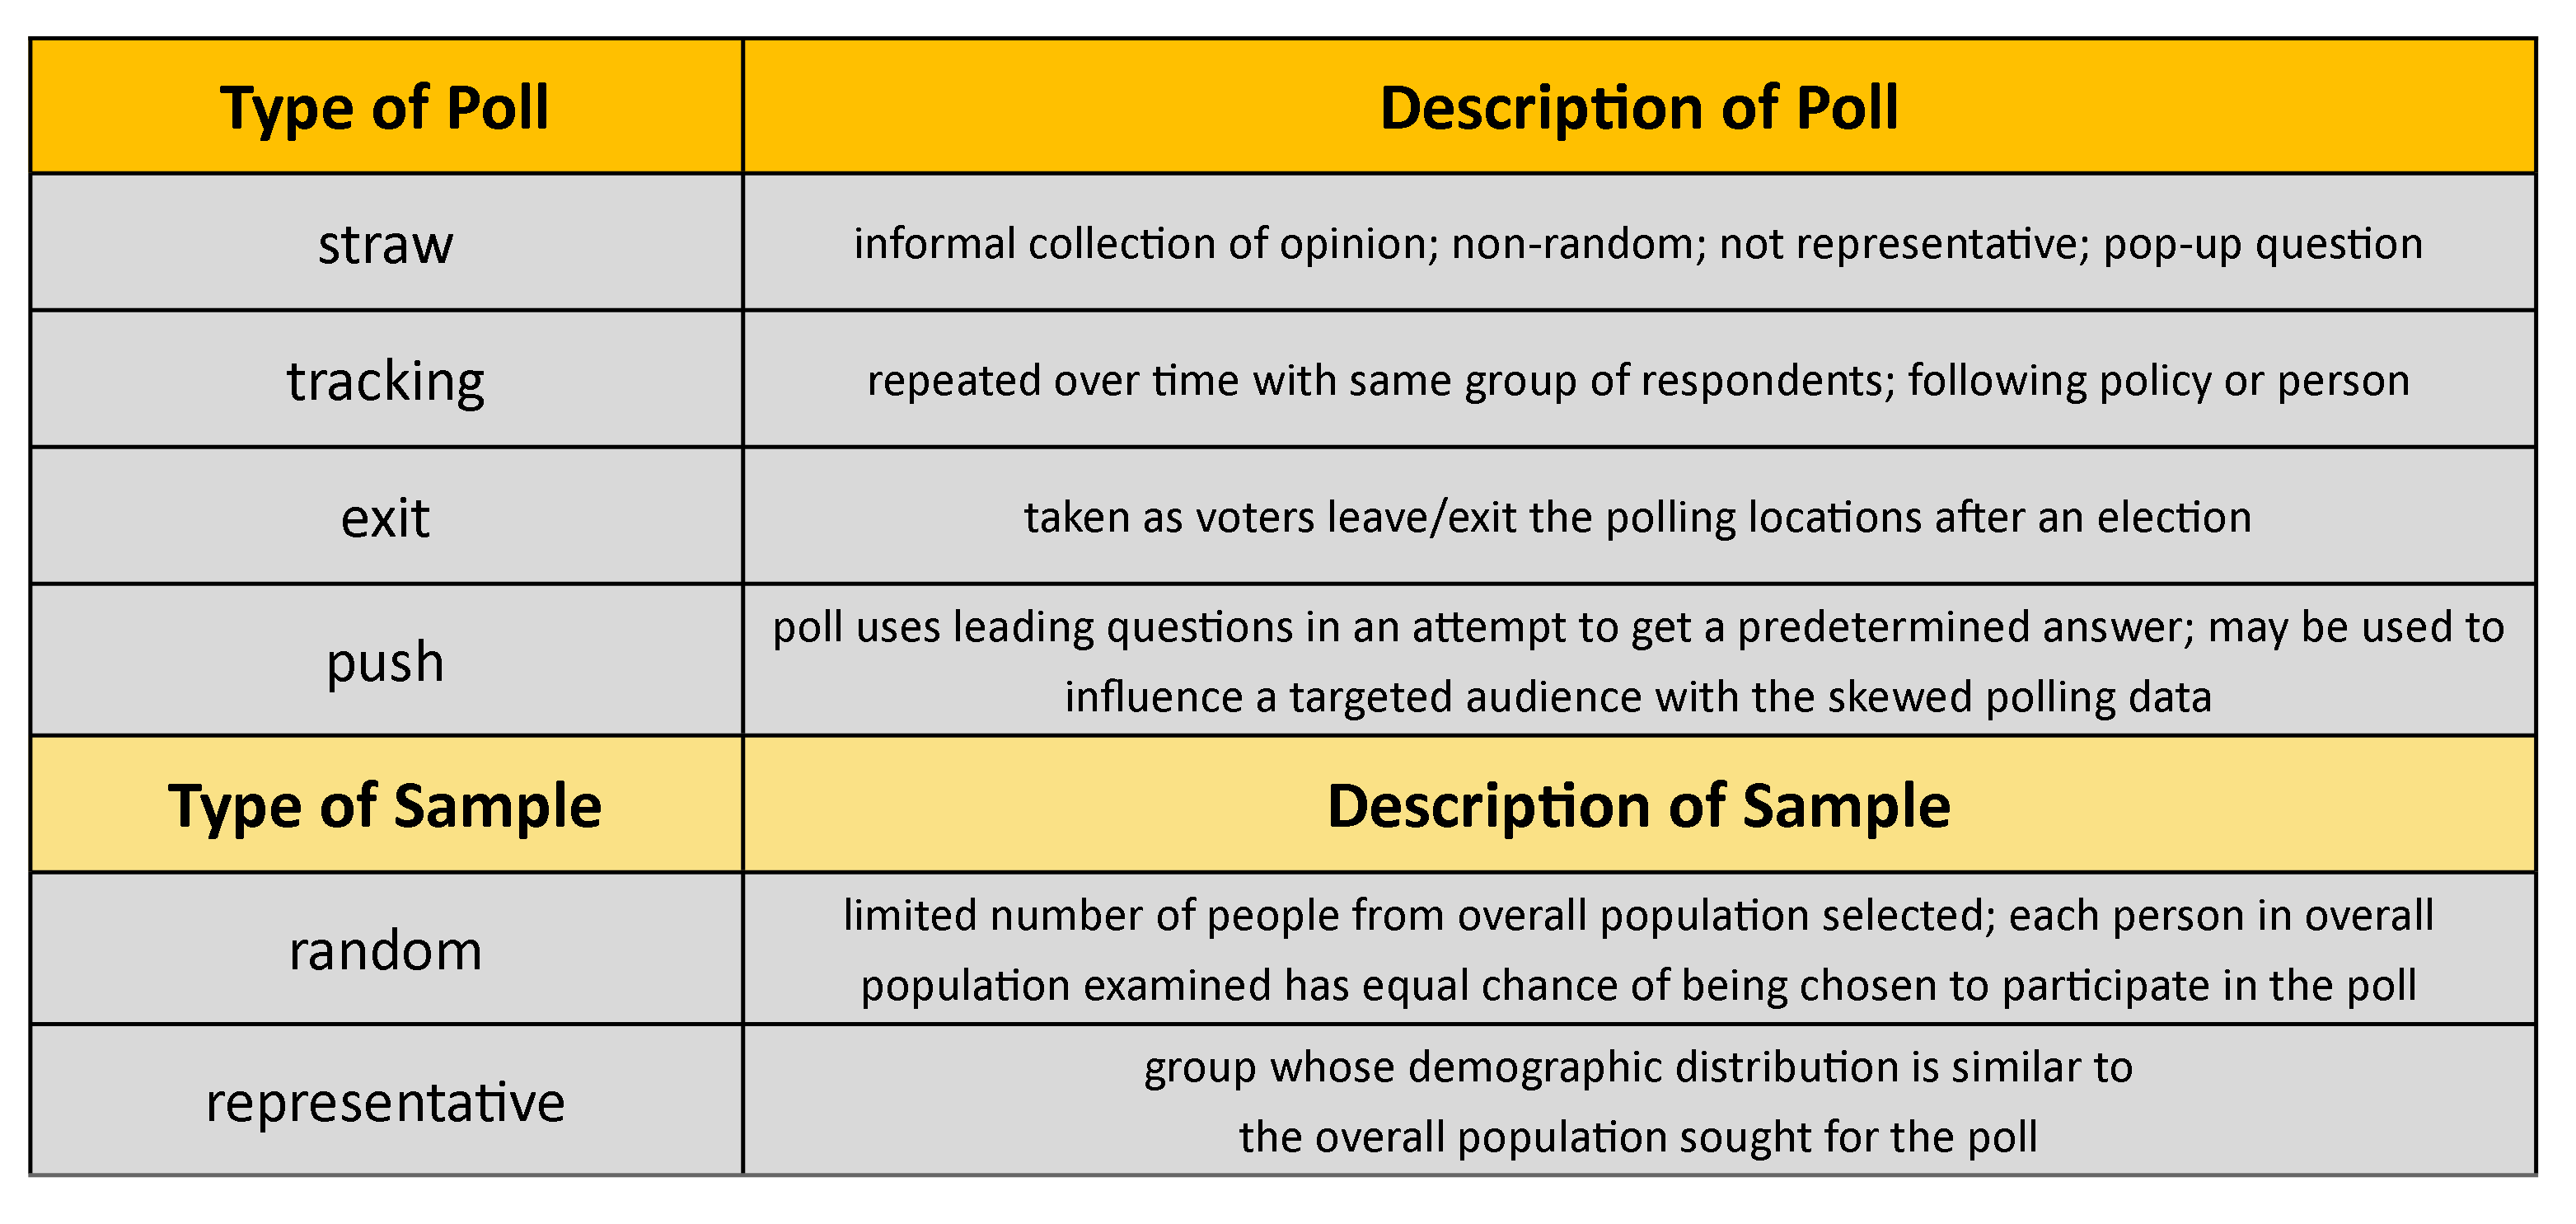
- Tracking Polls is a common tool used to measure approval ratings among public officials. It collects a sample over the period of a few days (typically 3-7), and uses a rolling sample. Contacts are made every day. New contacts are continually added to the sample while the older contacts are taken out. It’s more of a useful tool to look at the trajectory of attitudes than any single snapshot.
- Exit Polls are conducted on election day. Poll workers interview respondents as they leave the election site. This data is good because we are asking individuals about who they have actually voted for, instead of how they plan to vote. The shortcomings: these polls are conducted earlier in the day and use a tactic called systematic randomization (randomly choosing a single respondent and interviewing every third, fourth, or some other fixed number after).
- Push Polls are designed to provide information under the guise of measuring someone’s opinion. Campaigns frequently use these to try to build false enthusiasm. For example, imagine a series of questions like this: Question 1: Were you aware that candidate A once saved the life of a child from a burning building? Question 2: Were you aware that candidate B is under investigation for failing to pay child support? Question 3: If the election were tomorrow, would you vote for candidate A or B? As you can see, the question order is designed to push the respondent to answer a certain way.
- Straw Polls are often used at events or conventions to gauge the preferences of those who attended. Imagine you are taking a poll at a Mizzou basketball game. You ask the attendants who is their basketball player. The results would be different than if you asked the same question among basketball fans nationwide.
 Source: CourseHero
We often see non-scientific polls on partisan or news websites. These polls are not random, and those who complete the polls want to complete the poll. At the conclusion of the poll, the results are skewed. For example, let’s say a conservative news network conducts a poll asking their viewers who won a debate. The results show 90% of the respondents say the Republican candidate won. The problem is those who visit the website are much more likely to be Republican voters than not. So, of course, they’ll choose the Republican candidate.
Problems with Polls
No matter how much a researcher or pollster effectively achieves randomization of their sample, there will be pitfalls.
- Priming effects are having a respondent think about a certain subject matter they would not normally be thinking about or thinking about at that time. For example, we contact a respondent and ask them if they prefer hamburgers at McDonald's or at Wendy's. After they respond, you ask them what they plan to eat for dinner that evening. And shockingly, they answer, “hamburger”. Of course, they could be telling you the truth. But would they have planned to eat a burger for dinner, if you hadn't asked the question?
- Framing effects are those that influence a respondent by how a question is presented. For example, imagine reading a newspaper article on the struggles of undocumented immigrants. Then, imagine reading an identical article, but it uses the word “illegal” instead. The tone of the entire article completely changes.
- A social desirability effect (also referred to as the ‘Bradley Effect’) occurs when some voters give inaccurate polling responses for fear that, by stating their true preference, they will open themselves to criticism. For example, if you are contacted by a college student at a call center, could your opinion on a political topic like “student loan debt forgiveness” change because you are talking to someone who is in college?
- Band-wagon effects are similar. In this case, respondents are influenced by the enthusiasm of those around them.
Political science studies rally around the flag effects phenomenon (Baum 2002). Typically, a sense of one’s identity as a citizen of a nation is activated, and one's political priorities temporarily change in response to an external threat. Thus, the dramatic spikes in public approval ratings occur during wartime, or at least in the beginning of an armed conflict. The suddenness of the spikes could also mean the opinions are less stable. For example, U.S. President George H. Bush’s public approval was in the 90s (out of 100) after Operation Desert Storm, yet he lost a presidential election less than two years later.
Polling and consulting firms are used by many schools and companies for data collection and marketing purposes. Companies and news outlets would not pay for results if there was not a strong track record in polling success. But, as polling has become more frequently used, many more companies and firms have been getting into the industry. Some businesses do not apply the same traditional standards and safeguards in their polls as academics do. So, it is always a good idea to look at the accuracy of past polls the company has produced when looking for reputable places to get data.
