
1.5: The Human Setting
- Page ID
- 131865
\( \newcommand{\vecs}[1]{\overset { \scriptstyle \rightharpoonup} {\mathbf{#1}} } \)
\( \newcommand{\vecd}[1]{\overset{-\!-\!\rightharpoonup}{\vphantom{a}\smash {#1}}} \)
\( \newcommand{\dsum}{\displaystyle\sum\limits} \)
\( \newcommand{\dint}{\displaystyle\int\limits} \)
\( \newcommand{\dlim}{\displaystyle\lim\limits} \)
\( \newcommand{\id}{\mathrm{id}}\) \( \newcommand{\Span}{\mathrm{span}}\)
( \newcommand{\kernel}{\mathrm{null}\,}\) \( \newcommand{\range}{\mathrm{range}\,}\)
\( \newcommand{\RealPart}{\mathrm{Re}}\) \( \newcommand{\ImaginaryPart}{\mathrm{Im}}\)
\( \newcommand{\Argument}{\mathrm{Arg}}\) \( \newcommand{\norm}[1]{\| #1 \|}\)
\( \newcommand{\inner}[2]{\langle #1, #2 \rangle}\)
\( \newcommand{\Span}{\mathrm{span}}\)
\( \newcommand{\id}{\mathrm{id}}\)
\( \newcommand{\Span}{\mathrm{span}}\)
\( \newcommand{\kernel}{\mathrm{null}\,}\)
\( \newcommand{\range}{\mathrm{range}\,}\)
\( \newcommand{\RealPart}{\mathrm{Re}}\)
\( \newcommand{\ImaginaryPart}{\mathrm{Im}}\)
\( \newcommand{\Argument}{\mathrm{Arg}}\)
\( \newcommand{\norm}[1]{\| #1 \|}\)
\( \newcommand{\inner}[2]{\langle #1, #2 \rangle}\)
\( \newcommand{\Span}{\mathrm{span}}\) \( \newcommand{\AA}{\unicode[.8,0]{x212B}}\)
\( \newcommand{\vectorA}[1]{\vec{#1}} % arrow\)
\( \newcommand{\vectorAt}[1]{\vec{\text{#1}}} % arrow\)
\( \newcommand{\vectorB}[1]{\overset { \scriptstyle \rightharpoonup} {\mathbf{#1}} } \)
\( \newcommand{\vectorC}[1]{\textbf{#1}} \)
\( \newcommand{\vectorD}[1]{\overrightarrow{#1}} \)
\( \newcommand{\vectorDt}[1]{\overrightarrow{\text{#1}}} \)
\( \newcommand{\vectE}[1]{\overset{-\!-\!\rightharpoonup}{\vphantom{a}\smash{\mathbf {#1}}}} \)
\( \newcommand{\vecs}[1]{\overset { \scriptstyle \rightharpoonup} {\mathbf{#1}} } \)
\(\newcommand{\longvect}{\overrightarrow}\)
\( \newcommand{\vecd}[1]{\overset{-\!-\!\rightharpoonup}{\vphantom{a}\smash {#1}}} \)
\(\newcommand{\avec}{\mathbf a}\) \(\newcommand{\bvec}{\mathbf b}\) \(\newcommand{\cvec}{\mathbf c}\) \(\newcommand{\dvec}{\mathbf d}\) \(\newcommand{\dtil}{\widetilde{\mathbf d}}\) \(\newcommand{\evec}{\mathbf e}\) \(\newcommand{\fvec}{\mathbf f}\) \(\newcommand{\nvec}{\mathbf n}\) \(\newcommand{\pvec}{\mathbf p}\) \(\newcommand{\qvec}{\mathbf q}\) \(\newcommand{\svec}{\mathbf s}\) \(\newcommand{\tvec}{\mathbf t}\) \(\newcommand{\uvec}{\mathbf u}\) \(\newcommand{\vvec}{\mathbf v}\) \(\newcommand{\wvec}{\mathbf w}\) \(\newcommand{\xvec}{\mathbf x}\) \(\newcommand{\yvec}{\mathbf y}\) \(\newcommand{\zvec}{\mathbf z}\) \(\newcommand{\rvec}{\mathbf r}\) \(\newcommand{\mvec}{\mathbf m}\) \(\newcommand{\zerovec}{\mathbf 0}\) \(\newcommand{\onevec}{\mathbf 1}\) \(\newcommand{\real}{\mathbb R}\) \(\newcommand{\twovec}[2]{\left[\begin{array}{r}#1 \\ #2 \end{array}\right]}\) \(\newcommand{\ctwovec}[2]{\left[\begin{array}{c}#1 \\ #2 \end{array}\right]}\) \(\newcommand{\threevec}[3]{\left[\begin{array}{r}#1 \\ #2 \\ #3 \end{array}\right]}\) \(\newcommand{\cthreevec}[3]{\left[\begin{array}{c}#1 \\ #2 \\ #3 \end{array}\right]}\) \(\newcommand{\fourvec}[4]{\left[\begin{array}{r}#1 \\ #2 \\ #3 \\ #4 \end{array}\right]}\) \(\newcommand{\cfourvec}[4]{\left[\begin{array}{c}#1 \\ #2 \\ #3 \\ #4 \end{array}\right]}\) \(\newcommand{\fivevec}[5]{\left[\begin{array}{r}#1 \\ #2 \\ #3 \\ #4 \\ #5 \\ \end{array}\right]}\) \(\newcommand{\cfivevec}[5]{\left[\begin{array}{c}#1 \\ #2 \\ #3 \\ #4 \\ #5 \\ \end{array}\right]}\) \(\newcommand{\mattwo}[4]{\left[\begin{array}{rr}#1 \amp #2 \\ #3 \amp #4 \\ \end{array}\right]}\) \(\newcommand{\laspan}[1]{\text{Span}\{#1\}}\) \(\newcommand{\bcal}{\cal B}\) \(\newcommand{\ccal}{\cal C}\) \(\newcommand{\scal}{\cal S}\) \(\newcommand{\wcal}{\cal W}\) \(\newcommand{\ecal}{\cal E}\) \(\newcommand{\coords}[2]{\left\{#1\right\}_{#2}}\) \(\newcommand{\gray}[1]{\color{gray}{#1}}\) \(\newcommand{\lgray}[1]{\color{lightgray}{#1}}\) \(\newcommand{\rank}{\operatorname{rank}}\) \(\newcommand{\row}{\text{Row}}\) \(\newcommand{\col}{\text{Col}}\) \(\renewcommand{\row}{\text{Row}}\) \(\newcommand{\nul}{\text{Nul}}\) \(\newcommand{\var}{\text{Var}}\) \(\newcommand{\corr}{\text{corr}}\) \(\newcommand{\len}[1]{\left|#1\right|}\) \(\newcommand{\bbar}{\overline{\bvec}}\) \(\newcommand{\bhat}{\widehat{\bvec}}\) \(\newcommand{\bperp}{\bvec^\perp}\) \(\newcommand{\xhat}{\widehat{\xvec}}\) \(\newcommand{\vhat}{\widehat{\vvec}}\) \(\newcommand{\uhat}{\widehat{\uvec}}\) \(\newcommand{\what}{\widehat{\wvec}}\) \(\newcommand{\Sighat}{\widehat{\Sigma}}\) \(\newcommand{\lt}{<}\) \(\newcommand{\gt}{>}\) \(\newcommand{\amp}{&}\) \(\definecolor{fillinmathshade}{gray}{0.9}\)The physical setting of the world’s places has undoubtedly influenced the human setting, just as human activities have shaped the physical landscape. There are currently around 7.4 billion people in the world, but these billions of people are not uniformly distributed. When we consider where people live in the world, we tend to cluster in areas that are warm and are near water and avoid places that are cold and dry. As shown in Figure \(\PageIndex{1}\), there are three major population clusters in the world: East Asia, South Asia, and Europe.
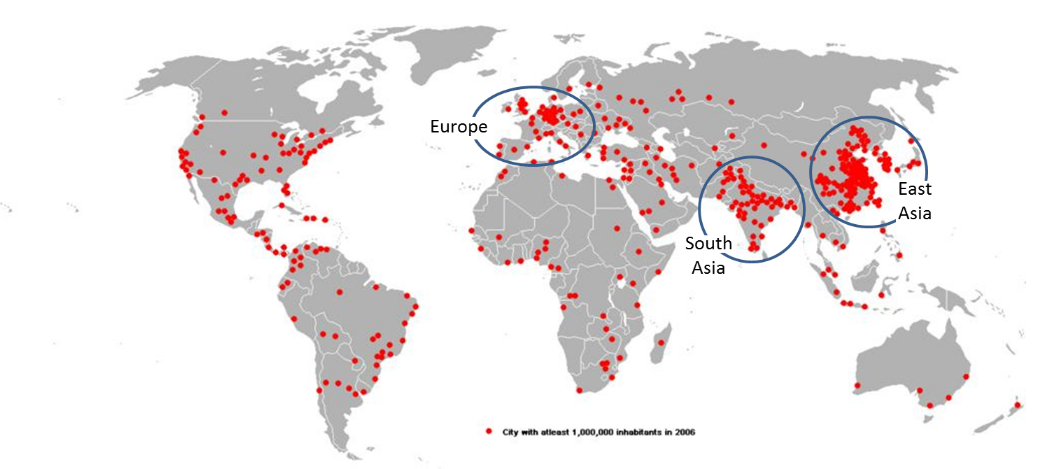
Just as geographers can discuss “where” people are located, we can explore “why” population growth is occurring in particular areas. All of the 10 most populous cities in the world are located in countries traditionally categorized as “developing.” These countries typically have high rates of population growth. A population grows, quite simply, when more people are born than die. The birth rate refers to the total number of live births per 1,000 people in a given year. In 2012, the average global birth rate was 19.15 births per 1,000 people.
Subtracting the death rate from the birth rate results in a country’s rate of national increase (RNI). For example, Madagascar has a birth rate of 32.9 per 1,000 (as of 2017) and a death rate of 6.19 per 1,000. 32.9 minus 6.19 is 26.71 per 1,000. If you divide the result by 10, you’d get 2.671 per 100, or 2.671 percent. In essence, this means that Madagascar’s population is increasing at a rate of 2.671 percent per year. The natural increase rate does not include immigration. Some countries in Europe, in fact, have a negative natural increase rate, but their population continues to increase due to immigration.
The birth rate is directly affected by the total fertility rate (TFR), which is the average number of children born to a woman during her childbearing years (Figure 1.12). In developing countries, the total fertility rate is often 4 or more children, contributing to high population growth. In developed countries, on the other hand, the total fertility rate may be only 1 or 2 children, which can ultimately lead to population decline.
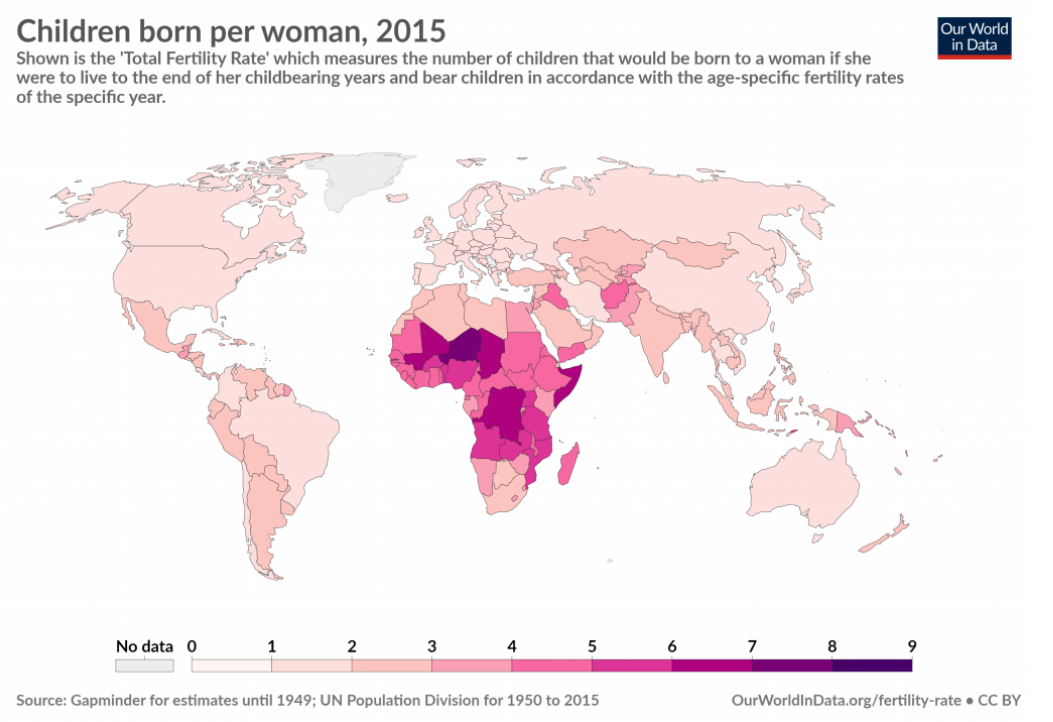
A number of factors influence the total fertility rate, but it is generally connected to a country’s overall level of development. As a country develops and industrializes, it generally becomes more urbanized. Children are no longer needed to assist with family farms, and urban areas might not have large enough homes for big families. Women increasingly enter the workforce, which can delay childbearing and further restrict the number of children a family desires. Culturally, a shift occurs as industrialized societies no longer value large family sizes. As women’s education increases, women are able to take control of their reproductive rights. Contraceptive use becomes more widespread and socially acceptable.
This shift in population characteristics as a country industrialized can be represented by the demographic transition model (DTM) (Figure \(\PageIndex{3}\)). This model demonstrates the changes in birth rates, death rates, and population growth over time as a country develops. In stage one, during feudal Europe, for example, birth rates and death rates were very high. Populations were vulnerable to drought and disease and thus population growth was minimal. No country remains in stage one today. In stage two, a decline in death rates leads to a rise in population. This decline in death rates occurred as a result of agricultural productivity and improvements in public health. Vaccines, for example, greatly reduced the mortality from childhood diseases.
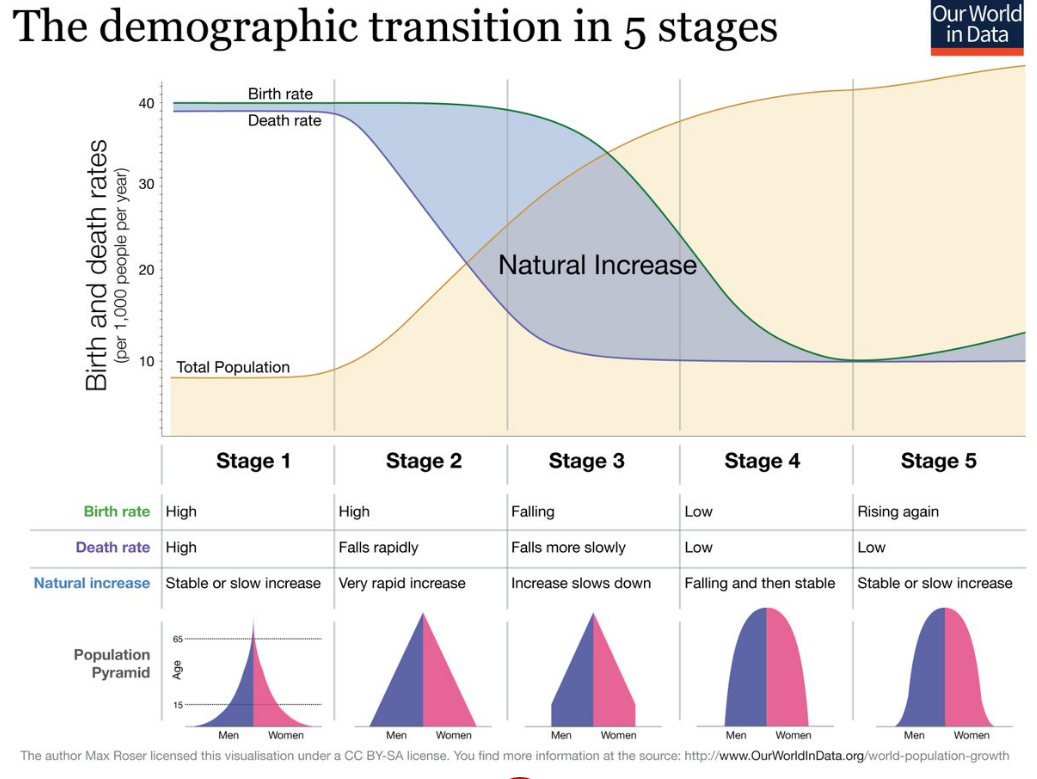
Stage two countries are primarily agricultural, and thus there is a cultural and historical preference for large families, so birth rates remain high. Most of Sub-Saharan Africa is in stage two. In stage three, urbanization and increasing access to contraceptives leads to a decline in the birth rate. As country industrializes, women enter the workforce and seek higher education. The population growth begins to slow. Much of Middle and South America as well as India are in stage three.
In stage four, birth rates approach the death rates. Women have increased independence as well as educational and work opportunities, and families may choose to have a small number of children or none at all. Most of Europe as well as China are in stage four. Some have proposed a stage five of the demographic transition model. In some countries, the birth rate has fallen below the death rate as families choose to only have 1 child. In these cases, a population will decline unless there is significant immigration. Japan, for example, is in stage five and has a total fertility rate of 1.41. Although this is only a model, and each country passes through the stages of demographic transition at different rates, the generalized model of demographic transition holds true for most countries of the world.
As countries industrialize and become more developed, they shift from primarily rural settlements to urban ones. Urbanization refers to the increased proportion of people living in urban areas. As people migrate out of rural, agricultural areas, the proportion of people living in cities increases. As people living in cities have children, this further increases urbanization. For most of human history, we have been predominantly rural. By the middle of 2009, however, the number of people living in urban areas surpassed the number of people living in rural areas for the first time. In 2014, 54 percent of the world’s population lived in urban areas. This figure is expected to increase to 66 percent by 2050.
The number of megacities, cities with 10 million people or more, has also increased. In 1990, there were 10 megacities in the world. In 2014, there were 28 megacities. Tokyo-Yokohama is the largest metropolitan area in the world with over 38 million inhabitants.
- Rate of Natural Increase:
-
the measure of a country’s population growth calculated by subtracting its death rate from its birth rate, also referred to as RNI
- Total Fertility Rate:
-
the average number of children born to a woman during her childbearing years, also referred to as TFR
- Demographic Transition Model:
-
a model that demonstrates the changes in birth rates, death rates, and population growth over time as a country develops, also referred to as the DTM
- Urbanization:
-
the increased proportion of people living in urban areas