According to the National Center for Higher Education Management Systems (NCHEMS) (2016a, 2016b, 2016c, 2016d), in the United States:
84% of 18- to 24-year-olds and 88% of those 25 and older have a high school diploma or its equivalent
36% of 18- to 24-year-olds and 7% of 25- to 49-year-olds attend college
59% of those 25 and older have completed some college
32.5% of those 25 and older have a bachelor's degree or higher, with slightly more women (33%) than men (32%) holding a college degree (Ryan & Bauman, 2016).
The rate of college attainment has grown more slowly in the United States than in a number of other nations in recent years (OCED, 2014). This may be due to fact that the cost of attaining a degree is higher in the U.S. than in many other nations.
In 2017, 65% of college seniors who graduated from private and public nonprofit colleges had student loan debt, and nationally owed an average of $28650, a 1% decline from 2016 (The Institute for College Access & Success (TICAS), 2018). See Figure \(\PageIndex{1}\) for yearly comparisons.
Figure \(\PageIndex{1}\). Average debt borrowed for graduating seniors. Adapted from TICAS, 2018.
According to the most recent TICAS annual report, the rate of debt varied widely across states, as well as between colleges. The after-graduation debt ranged from $18,850 in Utah to $38,500 in Connecticut. Low-debt states are mainly in the West, and high-debt states in the Northeast. In recent years there has been a concern about students carrying more debt and being more likely to default when attending for-profit institutions. In 2016, students at for-profit schools borrowed an average of $39,900, which was 41% higher than students at non-profit schools that year. In addition, 30% of students attending for-profit colleges default on their federal student loans. In contrast, the default level of those who attended public institutions is only 4% (TICAS, 2018).
Table \(\PageIndex{1}\). Select State Data on Student Debt (2017).
State
Average Debt
Rank
Proportion with Debt
Illinois
29,214
24
61%
Wisconsin
29,569
21
64%
Michigan
31,298
11
58%
Indiana
29,561
22
57%
Utah (lowest)
18,850
38%
Connecticut (highest)
38,500
57%
TICSA, 2017 Data
College student debt has become a key issue at both the state and federal political level, and some states have been taking steps to increase spending and grants to help students with the cost of college. However, 15% of the Class of 2017's college debt was owed to private lenders (TICAS, 2018). Such debt has less consumer protection, fewer options for repayment, and is typically negotiated at a higher interest rate. See Table \(\PageIndex{1}\) for a debt comparison of 6 U.S. States.
Graduate School:
Larger amounts of student debt actually occur at the graduate level (Kreighbaum, 2019). In 2019, the highest average debts were concentrated in the medical fields. Average median debt for graduate programs included:
$42,335 for a master's degree
$95,715 for a doctoral degree
$141,000 for a professional degree
Worldwide, over 80% of college educated adults are employed, compared with just over 70% of those with a high school or equivalent diploma, and only 60% of those with no high school diploma (OECD, 2015). Those with a college degree will earn more over the course of their lifetime. Moreover, the benefits of college education go beyond employment and finances. The OECD found that around the world, adults with higher educational attainment were more likely to volunteer, felt they had more control over their lives, and thus were more interested in the world around them. Studies of U.S. college students find that they gain a more distinct identity and become more socially competent, less dogmatic and ethnocentric compared to those not in college (Pascarella, 2006).
Is college worth the time and investment?
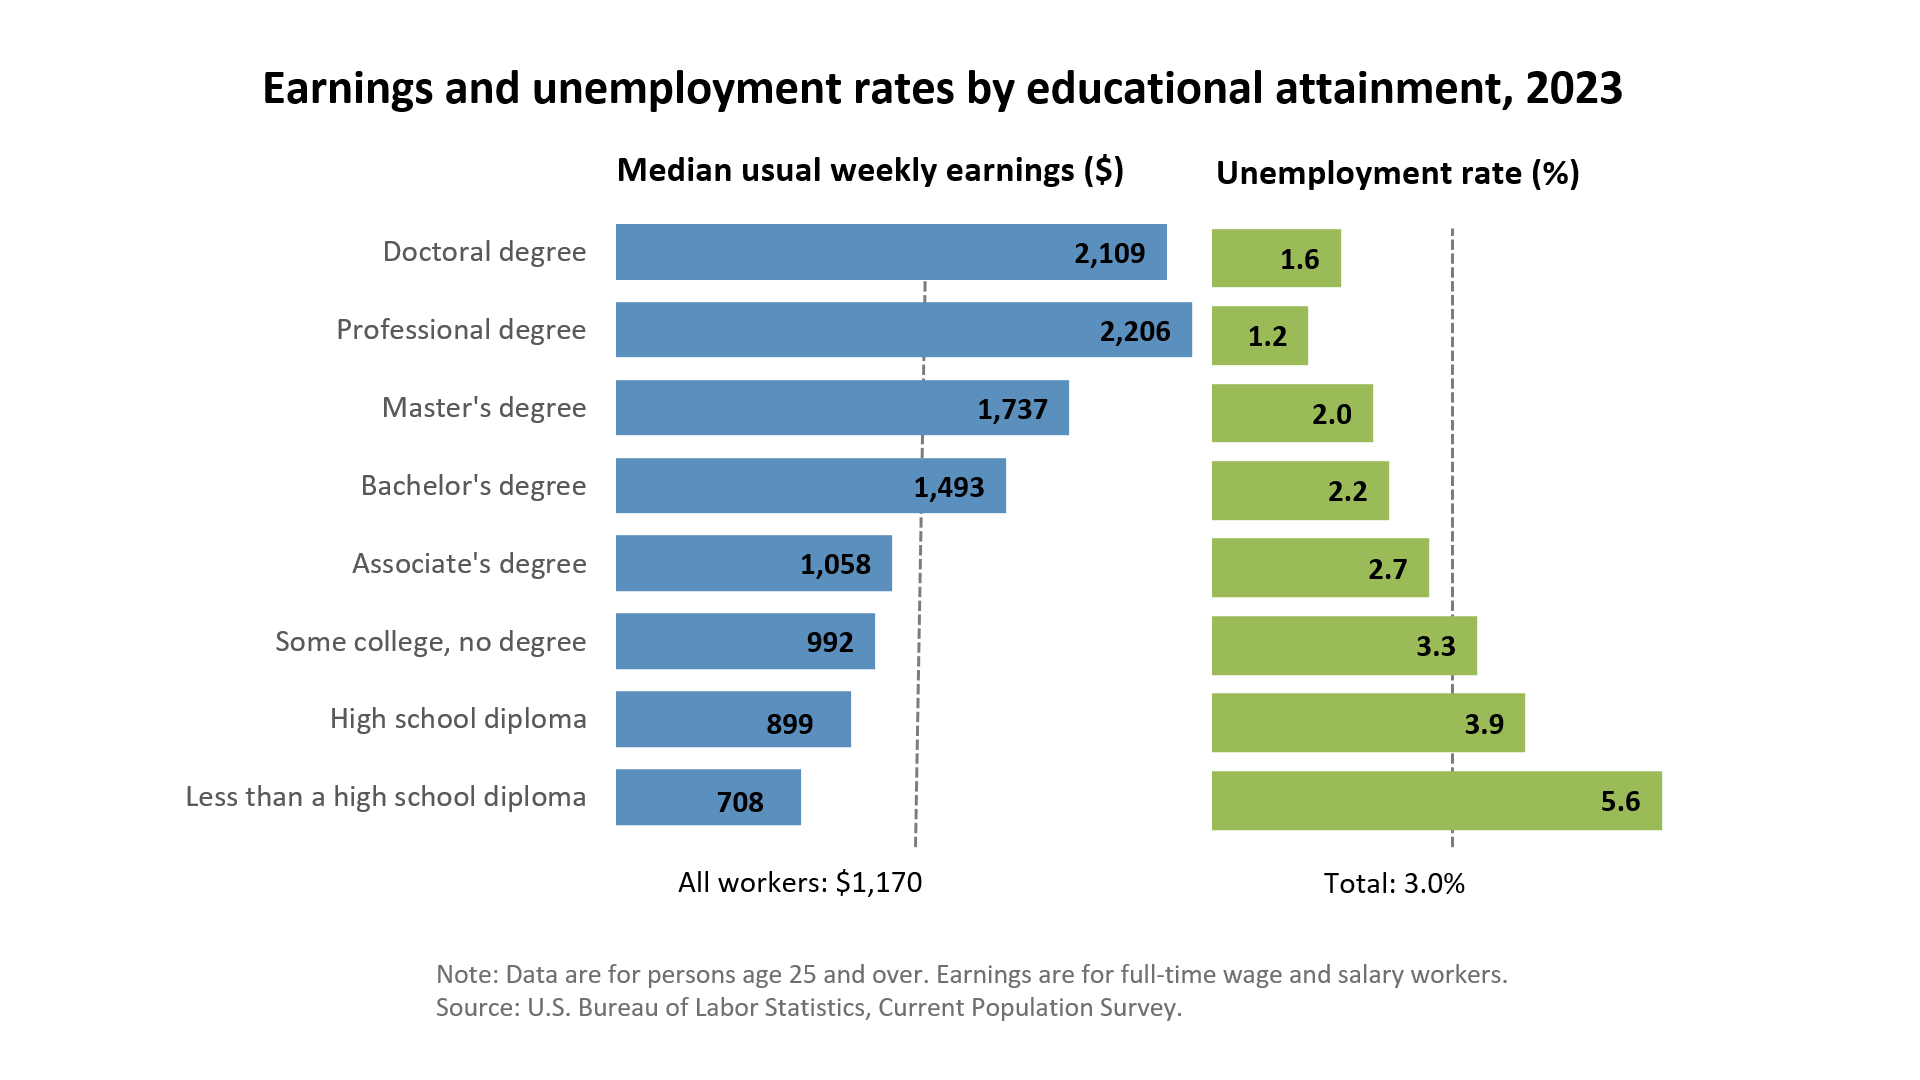
College is certainly a substantial investment each year, with the financial burden falling on students and their families in the U.S., and mainly by the government in many other nations. Nonetheless, the benefits both to the individual and the society outweighs the initial costs. As can be seen in Figure \(\PageIndex{2}\), those in America with the most advanced degrees earn the highest income and have the lowest unemployment.
Work plays a significant role in the lives of people, and emerging and early adulthood is the time when most of us make choices that will establish our careers. Career development has a number of stages:
Stage One: As children we may select careers based on what appears glamorous or exciting to us (Patton & McMahon, 1999). There is little regard in this stage for whether we are suited for our occupational choices.
Stage Two: In the second stage, teens include their abilities and limitations, in addition to the glamour of the occupation, when narrowing their choices.
Stage Three: Older teens and emerging adults narrow their choices further and begin to weigh more objectively the requirements, rewards, and downsides to careers, along with comparing possible careers with their own interests, values, and future goals (Patton & McMahon, 1999). However, some young people in this stage "fall into" careers simply because these were what were available at the time, because of family pressures to pursue particular paths, or because these were high-paying jobs, rather than from an intrinsic interest in that career path (Patton & McMahon, 1999).
Stage Four: Super (1980) suggests that by our mid to late thirties, many adults settle in their careers. Even though they might change companies or move up in their position, there is a sense of continuity and forward motion in their career. However, some people at this point in their working life may feel trapped, especially if there is little opportunity for advancement in a more dead-end job.
How have things changed for Millennials compared with previous generations of early adults?
In recent years, young adults are more likely to find themselves job-hopping, and periodically returning to school for further education and retraining than in prior generations. However, researchers find that occupational interests remain fairly stable. Thus, despite the more frequent change in jobs, most people are generally seeking jobs with similar interests rather than entirely new careers (Rottinghaus et al., 2007). As of 2016, millennials became the largest generation in the labor force (Fry, 2018) (See Figure \(\PageIndex{3}\)).
Recent research also suggests that Millennials are looking for something different in their place of employment. According to a recent Gallup poll report (2016), Millennials want more than a paycheck, they want a purpose. Unfortunately, only 29% of Millennials surveyed by Gallup reported that they were "engaged" at work. In fact, they report being less engaged than Gen Xers and Baby Boomers; with 55% of Millennials saying they are not engaged at all with their job. This indifference to their workplace may explain the greater tendency to switch jobs. With their current job giving them little reason to stay, they are more likely to take any new opportunity to move on. Only half of Millennials saw themselves working at the same company a year later. Gallup estimates that this employment turnover and lack of engagement costs businesses $30.5 billion a year.
NEETs:
Around the world, teens and young adults were some of the hardest hit by the economic downturn in recent years (Desilver, 2016). Consequently, a number of young people have become NEETs, neither employed nor in education or training. While the number of young people who are NEETs has declined more recently, there is concern that "without assistance, economically inactive young people won't gain critical job skills and will never fully integrate into the wider economy or achieve their full earning potential" (Desilver, 2016, para. 3). In parts of the world where the rates of NEETs are persistently high, there is also concern that having such large numbers of young adults with little opportunity may increase the chances of social unrest.
In the United States, in 2017 over 13% of 15 to 29 year-olds were neither employed nor in school, (Organisation for Economic Cooperation and Development, (OECD), 2019). This is down from 2013, when approximately 18.5% of this age group fit the category (Desilver, 2016). More young women than men in the United States find themselves unemployed and not in school or training for a job. Additionally, most NEETs have high school or less education, and Asians are less likely to be NEETs than any other ethnic group in the US (Desilver, 2016).
The rate of NEETs varies around the world, with higher rates found in nations that have been the hardest hit by economic recessions, and government austerity measures. The number of NEETs also varies widely between the genders, although females are more likely to be NEETs in all nations (see Table \(\PageIndex{2}\)).
Table \(\PageIndex{2}\). Percentage of Females and Males between the Ages of 15-29 who are NEETs in Select Nations.
Females
Males
Overall
Australia
12.80
9.14
10.9
Canada
11.83
12.46
12.2
Denmark
11.86
11.67
11.8
France
17.75
15.34
16.5
Germany
11.27
7.60
9.3
Italy
26.94
23.38
25.1
Mexico
34.21
7.90
21.2
Russia
16.28
8.66
12.4
Sweden
8.42
7.69
8
Turkey
39.90
15.08
27.2
United Kingdom
13.95
10.50
12.2
United States of America
15.69
10.89
13.3
Adapted from OCED 2019
What role does gender play on career and employment?
Gender also has an impact on career choices. Despite the rise in the number of women who work outside of the home, there are some career fields that are still pursued more by men than women. Jobs held by women still tend to cluster in the service sector, such as education, nursing, and child-care worker. While in more technical and scientific careers, women are greatly outnumbered by men. Jobs that have been traditionally held by women tend to have lower status, pay, benefits, and job security (Bosson et al., 2019). In recent years, women have made inroads into fields once dominated by males, and today women are almost as likely as men to become medical doctors or lawyers. Despite these changes, women are more likely to have lower-status, and thus less pay than men in these professions. For instance, women are more likely to be a family practice doctor than a surgeon or are less likely to make partner in a law firm (Ceci & Williams, 2007).
Sexism
Sexism or gender discriminationis prejudice or discrimination based on a person's sex or gender (Bosson, Vandello, & Buckner, 2019). Sexism can affect any sex that is marginalized or oppressed in a society; however, it is particularly documented as affecting females. It has been linked to stereotypes and gender roles and includes the belief that males are intrinsically superior to other sexes and genders. Extreme sexism may foster sexual harassment, rape, and other forms of sexual violence.
Sexism can exist on a societal level, such as in hiring, employment opportunities, and education. In the United States, women are less likely to be hired or promoted in male-dominated professions, such as engineering, aviation, and construction (Blau et al., 2010; Ceci & Williams, 2011). In many areas of the world, young girls are not given the same access to nutrition, healthcare, and education as boys. Sexism also includes people's expectations of how members of a gender group should behave. For example, women are expected to be friendly, passive, and nurturing; when a woman behaves in an unfriendly or assertive manner, she may be disliked or perceived as aggressive because she has violated a gender role (Rudman, 1998). In contrast, a man behaving in a similarly unfriendly or assertive way might be perceived as strong or even gain respect in some circumstances.
Occupational sexisminvolves discriminatory practices, statements, or actions, based on a person's sex, that occur in the workplace. One form of occupational sexism is wage discrimination. In 2008, the Organisation for Economic Co-operation and Development (OECD) found that while female employment rates have expanded, and gender employment and wage gaps have narrowed nearly everywhere, on average women still have a 20 percent less chance to have a job. The Council of Economic Advisors (2015) found that despite women holding 49.3% of the jobs, they are paid only 78 cents for every $1.00 a man earns. It also found that despite the fact that many countries, including the U.S., have established anti-discrimination laws, these laws are difficult to enforce. A recent example of significant wage inequality occurred among athletes.
The world witnessed the tremendous athleticism and soccer skills demonstrated by female players from 24 different countries during the 2019 Women's World Cup. Amid the cheering at the end of the final match between the United States and the Netherlands were chants of "equal pay" (Channick, 2019). Throughout the tournament, attention was focused on the discrepancy between what male soccer players earned compared to the female players. In winning the World Cup, the American women's team earned $4 million as part of a $30 million prize pool (Peterson, 2019). In contrast, the French men's team, who won the Men's World Cup in 2018, earned $38 million as part of the $400 million prize pool. The Federation of Association Football (FIFA) promised to double the prize money to $60 million for the 2023 Women's World Cup, but that still lags far behind the $440 million that will be given out for the Men's World Cup in 2022. In the United States, the women's soccer team generates more revenue and receives higher TV ratings than the men's team, yet the women get paid significantly less. By winning the 2019 Women's World Cup, each woman should receive $200,000, yet if the American men had won the 2018 Men's World Cup, each would have received $1.1 million (Hess, 2019). Because of this discrepancy, in March 2019, 28 members of the women's team filed a lawsuit against the United States Soccer Federation for gender discrimination and unequal pay (Channick, 2019). In February 2022, the U.S. women's soccer team won their case, and going forward they received back pay and were guaranteed equal pay commensurate with the men's team (Das, 2022).
Figure \(\PageIndex{5}\). Megan Rapinoe and Alex Morgan of the United States Women’s Soccer Team. Photo by Christopher Simon/Getty-AFP.
Factors Affecting Wage Inequality:
There are many possible explanations for the wage gap. It has been argued in the past that education may account for the wage gap. However, the wage gap exists at every of education level (Bosson et al., 2019). Men with less than high school to men with graduate degrees earn more than women with the same level of education. In addition, women now attain more associates, bachelor's, and master's degrees than men, and very similar levels of professional degrees and doctorates, according to a recent Census survey (U.S. Census Bureau, 2019). As the wage gap still exists in most occupations, education cannot be the explanation. Instead, occupational segregation is a likely contributor to the overall wage gap, as women tend to work in very different occupations than men, and those jobs tend to have lower wages. In addition, the entry of women into a field tends to reduce the wages and prestige of the job. Mandel (2013) found that jobs typically held by men who saw the biggest influx of women into those careers also saw the biggest drop in wages.
Table \(\PageIndex{3}\). The Gender Wage Gap.
Occupation
Wage Gap
Stock clerk, order filler
102
Maid, housekeeping cleaner
99
Social worker
94.1
Registered nurse
90.4
Customer service representative
86.8
Secretary/administrative assistant
84.5
Software developer
83.9
Office supervisor
83
Waitress/waiter
82.8
Accountant, auditor
80.8
Janitor, building cleaner
76.9
Driver/sales worker/truck driver
73.7
Police and sheriff's patrol officer
71.2
Adapted from Hegewisch & Ellis (2015).
Sticky floors, which keep low-wage workers—who are more likely to be women and minorities—from being promoted contribute to lower wages (Bosson, et al. 2019). Women are disproportionately in low-paid occupations, such as clerical, childcare, and service workers (Hegewisch & Ellis, 2015). They also get paid less than men in the same jobs, as can be seen in Table \(\PageIndex{3}\). This is a list of some of the top jobs held by women (e.g., maid, social worker, nurse) and top jobs held by men (e.g., software developer, janitor, police officer) in the United States. The second column shows women's earnings as a percentage of the earnings of men in those careers. In only one occupation are women paid more than men on average: stock clerk. Men are not only being paid more in more masculine jobs, but also in jobs typically held by women.
Other factors include that more than half of men report having negotiated their salary when being hired, compared with 12% of women (Babcock et al., 2006). However, people perceive women who negotiate more negatively then they do men, as assertive women, but not men, are more likely to be penalized. Women are also more likely to have interruptions in their careers either through the birth of children, or relocation due to a change in their partner's job. Women are also less likely to relocate for the sake of their families when a better job offer comes along, and employers know this. It has been suggested that one reason why males may be offered more money is to keep them from leaving (Baldridge et al., 2006). Additionally, men are more likely to work overtime.
Barriers to Positions of Power:
There are a few barriers to women achieving positions of power. The glass ceilingis the invisible barrier that keeps women and minorities from rising to higher positions regardless of their qualifications (Bosson et al., 2019). Women hold only 4.5% of CEO positions and 14% of top executive positions around the world (Noland et al., 2016). In addition, Noland and colleagues found that in a study of nearly 22,000 companies worldwide, in 77% of those firms only 30% of women held an executive position or board seat. There were only 11 companies, or 0.05% of all the firms studied, where women held all the executive positions and board seats. Some researchers see the root cause of this situation in the tacit discrimination based on gender conducted by current top executives and corporate directors, who are primarily male.
Often the barriers to achieving one's goals are not obvious. For instance, some argue that the gender role stereotypes cast managerial positions as "masculine". Unfortunately, when women do rise to positions of power it is often at a time when a company or country is faced with a major crisis. This is called the glass cliff, and it refers to women and minorities being placed in leadership positions when the risk of failure is high. For instance, female lawyers are more likely than their male counterparts to lead high-risk cases, and female politicians are more likely to be recommended to run in unwinnable seats (Bruckmuller et al., 2014).
Worldwide Gender Parity:
The World Economic Forum (2017) introduced The Global Gender Gap Report in 2006 as way of tracking gender based disparities between men and women in the world. The most recent report in 2017 analyzed 144 countries on gender equality in the areas of: economic participation and opportunity, educational attainment, health and survival, and political empowerment. Countries are then ranked to create global awareness of the challenges posed by gender gaps in different areas of the world. A parity rating of 100% would mean that females and males achieved equality on these measures. Results indicated:
68% gender parity was found worldwide across the four areas. Specifically, there was 96% parity in health outcomes, 95% parity in educational attainment, 58% parity in economic participation, and only 23% parity in political empowerment.
The top spots were held by smaller Western European countries, particularly the Nordic countries as Iceland (88% parity), Norway (83% parity) and Finland (82% parity) occupied the top three positions.
The United States ranked 49th with 72% gender parity.
Following the current trends, it will take 100 years for global gender parity.
Improving gender parity is expected to provide significant economic gains for a country and closing the occupational gender gaps would be one way to achieve this.