The civilian, non-institutionalized workforce, the population of those aged 16 and older who are employed, has steadily declined since it reached its peak in the late 1990s, when 67% of the civilian workforce population was employed. In 2021, the rate had dropped to 58.4% (U.S. Bureau of Labor Statistics, 2022b). The U.S. population is expected to grow more slowly based on census projections for the next few years. Table \(\PageIndex{1}\) shows the rates of employment by age. In 2002, baby boomers were between the ages of 38 to 56, the prime employment group. In 2012, the youngest baby boomers were 48 and the oldest had just retired (age 66). In 2022, baby boomers are between the ages of 58 and 76. These changes might explain some of the steady decline in workforce participation as this large population cohort ages out of the workforce.
Table \(\PageIndex{1}\). Percentage of the non-institutionalized civilian workforce employed by gender & age.
Males
Females
2002
2012
2021
2002
2012
2021
16–19
47.5
34.0
31.4
47.3
34.6
32.6
20–24
80.7
74.5
65.9
72.1
67.4
63.0
25–34
92.4
89.5
82.5
75.1
74.1
72.1
35–44
92.1
90.7
85.5
76.4
74.8
71.2
45–54
88.5
86.1
83.0
76.0
74.7
71.9
55–59
78.0
78.0
74.6
63.8
67.3
63.9
60–64
57.6
60.5
60.2
44.1
50.4
49.6
16+ totals
74.1
70.2
63.9
59.6
57.7
53.2
Rates of employment adapted from Monthly Labor Review (2013) and U.S. Bureau of Labor Statistics (2022b) For both genders and for most age groups the rate of participation in the labor force has declined from 2002 to 2021. Hispanic males have the highest rate of participation in the labor force. In May 2022, 77% of Hispanic males, compared with 68% of White, 71% of Asian, and 65% of Black men ages 20 or older were employed. Among women age 20 and older, 59% of Black women were participating in the workforce compared with 57% of Hispanic, 56% of Asian, and 55.5% of White females (U.S. Bureau of Labor Statistics, 2022a).
Climate in the Workplace for Middle-aged Adults:
A number of studies have found that job satisfaction tends to peak in middle adulthood (Besen et al., 2013; Easterlin, 2006). This satisfaction stems from not only higher wages, but often greater involvement in decisions that affect the workplace as they move from worker to supervisor or manager. Job satisfaction is also influenced by being able to do the job well, and after years of experience at a job many people are more effective and productive. Another reason for this peak in job satisfaction is that at midlife many adults lower their expectations and goals (Tangri et al., 2003). Middle-aged employees may realize they have reached the highest they are likely to in their career. This satisfaction at work translates into lower absenteeism, greater productivity, and less job-hopping in comparison to younger adults (Easterlin, 2006).
However, not all middle-aged adults are happy in the workplace. Women may find themselves up against the glass ceiling. This may explain why females employed at large corporations are twice as likely to quit their jobs as are men (Barreto et al., 2009). Another problem older workers may encounter is job burnout, defined as unsuccessfully managed work place stress (World Health Organization, 2019). Burnout consists of:
Feelings of energy depletion or exhaustion
Increased mental distance from one's job, or feelings of job negativism or cynicism
Reduced professional efficacy
American workers may experience more burnout than do workers in many other developed nations, because most developed nations guarantee by law a set number of paid vacation days (International Labour Organization, ILO, 2011), the United States does not (U.S. Department of Labor, 2016).
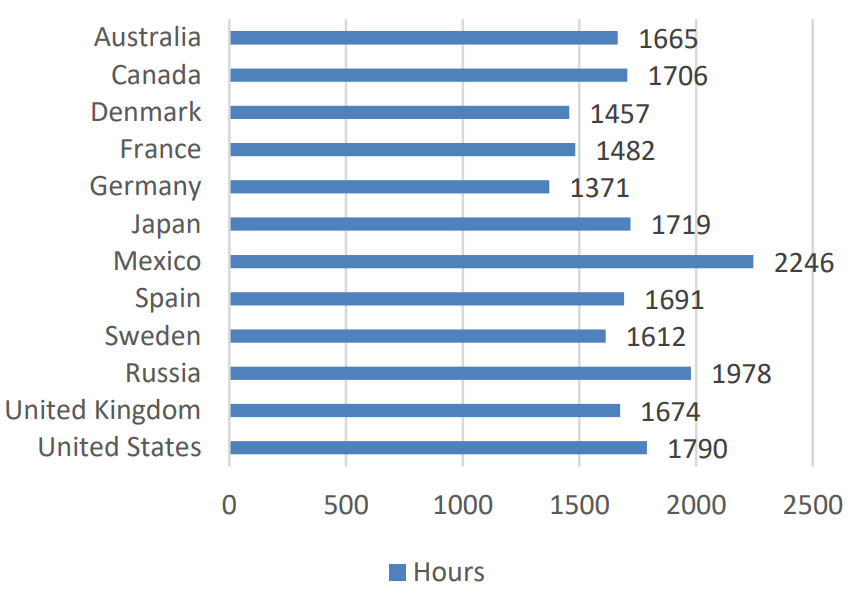
Figure \(\PageIndex{1}\). Average annual hours actually worked per worker. Unknown image source.
Not all employees are covered under overtime pay laws (U.S. Department of Labor, 2016). This is important when you considered that the 40-hour work week is a myth for most Americans. Only 4 in 10 U.S. workers work the typical 40-hour work week. The average work week for many is almost a full day longer (47 hours), with 39% working 50 or more hours per week (Saad, 2014). In comparison to workers in many other developed nations, American workers work more hours per year (Organisation for Economic Cooperation and Development, OECD, 2016). As can be seen in Figure \(\PageIndex{1}\), Americans work more hours than most European nations, especially western and northern Europe, although they work fewer hours than workers in other nations, especially Mexico.
Challenges in the Workplace for Middle-aged Adults:
In recent years middle aged adults have been challenged by economic downturns, starting in 2001, and again in 2008. Fifty-five percent of adults reported some problems in the workplace, such as fewer hours, pay-cuts, having to switch to part-time, etc., during the most recent economic recession (see Figure \(\PageIndex{2}\), Pew Research Center, 2010a). While young adults took the biggest hit in terms of levels of unemployment, middle-aged adults also saw their overall financial resources suffer as their retirement nest eggs disappeared and house values shrank, while foreclosures increased (Pew Research Center, 2010b). Not surprisingly, this age group reported that the recession hit them worse than did other age groups, especially those aged 50–64.
Figure \(\PageIndex{2}\). Effects of the 2008 recession, as published in 2010. Image source.
Middle-aged adults who find themselves unemployed are likely to remain unemployed longer than those in early adulthood (U.S. Government Accountability Office, 2012). In the eyes of employers, it may be more cost-effective to hire a young adult, despite their limited experience, as they would be starting out at lower levels of the pay scale. In addition, hiring someone who is 25 and has many years of work ahead of them versus someone who is 55 and will likely retire in 10 years may also be part of the decision to hire a younger worker (Lachman, 2004). American workers are also competing with global markets and changes in technology. Those who are able to keep up with all these changes or are willing to uproot and move around the country or even the world have a better chance of finding work. The decision to move may be easier for people who are younger and have fewer obligations to others.
COVID-19 and Early Retirement:
Baby Boomers are those adults born between 1946 and 1964, and in 2021 they are between 57 and 75 years of age. Because Boomers are of retirement age, their employment numbers have been closely watched during the pandemic. According to Fry (2020), about 28.6 million Baby Boomers reported that they were retired in the third quarter of 2020. This is 3.2 million more Boomers who were retired compared to the same quarter of 2019 (see Figure \(\PageIndex{3}\)). Additionally, Tanzi and Sasso (2021) reported that 2.7 million Americans age 55 or older are considering retirement years earlier than expected because of the pandemic. Further, the average expected likelihood of working beyond age 67 declined to 32.9 percent in March 2021 from 34.9 percent in November 2020 (Federal Reserve Bank of New York, 2021). Clearly, the pandemic has affected the retirement rate for Baby Boomers.
Figure \(\PageIndex{3}\). The number of retired Baby Boomers rose more from 2019 to 2020 than in prior years. Image source.
A variety of factors have been given to explain this increase in retirement. Workers most likely to voluntarily retire include those in professional positions who have accumulated a larger amount of wealth (Tanzi & Sasso, 2021). They identify their strong retirement accounts, investment assets, increased home values, and COVID-19 fatigue for their early retirement. This increased retirement rate of skilled workers, however, is a concern for companies that rely on the expertise of older workers due to their strong productivity, lower absenteeism, and ability to train and mentor new employees. In health care, approximately one-third of physicians are over 60. The burnout experienced during the pandemic is expected to increase early retirement for them contributing to a shortage of experienced physicians, especially among specialists.
In contrast, other Boomers lost their jobs during the pandemic, had health issues, or grew discouraged and retired earlier than planned (Tanzi, 2021). Many low-paid workers without much retirement savings were forced out of their jobs with little prospect of finding new employment. Workers age 55 to 64 without a college degree retired at a 5% faster rate than those with a college degree. This increase in unplanned, early retirements demonstrates the increasing inequality among Baby Boomers as older, Black workers without a college degree were especially more likely to retire earlier than planned. Their retirement rate increased from 16.4% to 17.9% between 2019 and 2021. Significant cuts in Social Security benefits result if one leaves the work force before the full retirement age, and unplanned retirements can lead to downward mobility for these workers.
Leisure
As most developed nations restrict the number of hours an employer can demand that employees work per week, and require employers to offer paid vacation time, what do middle-aged adults do with their time off from work and duties, referred to as leisure? Around the world, the most common leisure activity in both early and middle adulthood is watching television (Marketing Charts Staff, 2014). On average, middle aged adults spend 2–3 hours per day watching TV (Gripsrud, 2007) and watching TV accounts for more than half of all the leisure time (see Figure \(\PageIndex{4}\)).
In the United States, men spend about 5 hours more per week in leisure activities, especially on weekends, than do women (Drake, 2013; U.S. Bureau of Labor Statistics, 2016). The leisure gap between mothers and fathers is slightly smaller, about 3 hours a week, than among those without children under age 18 (Drake, 2013). Those age 35–44 spend less time on leisure activities than any other age group 15 or older (U.S. Bureau of Labor Statistics, 2016). This is not surprising as this age group are more likely to be parents and still working up the ladder of their career, so they may feel they have less time for leisure.
Americans have less leisure time than people in many other developed nations. As you read earlier, there are no laws in many job sectors guaranteeing paid vacation time in the United States (see Figure \(\PageIndex{5}\)). Ray et al. (2013) report that several other nations also provide additional time off for young and older workers and for shift workers. In the United States, those in higher paying jobs and jobs covered by a union contract are more likely to have paid vacation time and holidays (Ray & Schmitt, 2007).
Figure \(\PageIndex{5}\). Legally mandated time off in OCED nations. Image source.
But do U.S. workers take their time off?
According to Project Time-Off (2016), 55% of U.S. workers in 2015 did not take all of their paid vacation and holiday leave. A large percentage of this leave is lost. It cannot be rolled over into the next year or paid out. A total of 658 million vacation days, or an average of 2 vacation days per worker, was lost in 2015. The reasons most often given for not taking time off was worry that there would be a mountain of work to return to (40%), concern that no one else could do the job (35%), not being able to afford a vacation (33%), feeling it was harder to take time away when you have or are moving up in the company (33%), and not wanting to seem replaceable (22%). Since 2000, more American workers are willing to work for free rather than take the time that is allowed to them. A lack of support from their boss and even their colleagues to take a vacation is often a driving force in deciding to forgo time off. In fact, 80% of the respondents to the survey above said they would take time away if they felt they had support from their boss. Two-thirds reported that they hear nothing, mixed messages, or discouraging remarks about taking their time off. Almost a third (31%) feel they should contact their workplace, even while on vacation.
The benefits of taking time away from work:
Several studies have noted the benefits of taking time away from work. It reduces job stress burnout (Nimrod et al., 2012), improves both mental health (Qian et al., 2013) and physical health (Stern & Konno, 2009), especially if that leisure time also includes moderate physical activity (Lee et al., 2015). Leisure activities can also improve productivity and job satisfaction (Kühnel & Sonnentag, 2011) and help adults deal with balancing family and work obligations (Lee, et al., 2015).