
2.4: Non-Invasive Techniques- Indirect Functional Imaging Techniques
- Page ID
- 173113
\( \newcommand{\vecs}[1]{\overset { \scriptstyle \rightharpoonup} {\mathbf{#1}} } \)
\( \newcommand{\vecd}[1]{\overset{-\!-\!\rightharpoonup}{\vphantom{a}\smash {#1}}} \)
\( \newcommand{\id}{\mathrm{id}}\) \( \newcommand{\Span}{\mathrm{span}}\)
( \newcommand{\kernel}{\mathrm{null}\,}\) \( \newcommand{\range}{\mathrm{range}\,}\)
\( \newcommand{\RealPart}{\mathrm{Re}}\) \( \newcommand{\ImaginaryPart}{\mathrm{Im}}\)
\( \newcommand{\Argument}{\mathrm{Arg}}\) \( \newcommand{\norm}[1]{\| #1 \|}\)
\( \newcommand{\inner}[2]{\langle #1, #2 \rangle}\)
\( \newcommand{\Span}{\mathrm{span}}\)
\( \newcommand{\id}{\mathrm{id}}\)
\( \newcommand{\Span}{\mathrm{span}}\)
\( \newcommand{\kernel}{\mathrm{null}\,}\)
\( \newcommand{\range}{\mathrm{range}\,}\)
\( \newcommand{\RealPart}{\mathrm{Re}}\)
\( \newcommand{\ImaginaryPart}{\mathrm{Im}}\)
\( \newcommand{\Argument}{\mathrm{Arg}}\)
\( \newcommand{\norm}[1]{\| #1 \|}\)
\( \newcommand{\inner}[2]{\langle #1, #2 \rangle}\)
\( \newcommand{\Span}{\mathrm{span}}\) \( \newcommand{\AA}{\unicode[.8,0]{x212B}}\)
\( \newcommand{\vectorA}[1]{\vec{#1}} % arrow\)
\( \newcommand{\vectorAt}[1]{\vec{\text{#1}}} % arrow\)
\( \newcommand{\vectorB}[1]{\overset { \scriptstyle \rightharpoonup} {\mathbf{#1}} } \)
\( \newcommand{\vectorC}[1]{\textbf{#1}} \)
\( \newcommand{\vectorD}[1]{\overrightarrow{#1}} \)
\( \newcommand{\vectorDt}[1]{\overrightarrow{\text{#1}}} \)
\( \newcommand{\vectE}[1]{\overset{-\!-\!\rightharpoonup}{\vphantom{a}\smash{\mathbf {#1}}}} \)
\( \newcommand{\vecs}[1]{\overset { \scriptstyle \rightharpoonup} {\mathbf{#1}} } \)
\( \newcommand{\vecd}[1]{\overset{-\!-\!\rightharpoonup}{\vphantom{a}\smash {#1}}} \)
\(\newcommand{\avec}{\mathbf a}\) \(\newcommand{\bvec}{\mathbf b}\) \(\newcommand{\cvec}{\mathbf c}\) \(\newcommand{\dvec}{\mathbf d}\) \(\newcommand{\dtil}{\widetilde{\mathbf d}}\) \(\newcommand{\evec}{\mathbf e}\) \(\newcommand{\fvec}{\mathbf f}\) \(\newcommand{\nvec}{\mathbf n}\) \(\newcommand{\pvec}{\mathbf p}\) \(\newcommand{\qvec}{\mathbf q}\) \(\newcommand{\svec}{\mathbf s}\) \(\newcommand{\tvec}{\mathbf t}\) \(\newcommand{\uvec}{\mathbf u}\) \(\newcommand{\vvec}{\mathbf v}\) \(\newcommand{\wvec}{\mathbf w}\) \(\newcommand{\xvec}{\mathbf x}\) \(\newcommand{\yvec}{\mathbf y}\) \(\newcommand{\zvec}{\mathbf z}\) \(\newcommand{\rvec}{\mathbf r}\) \(\newcommand{\mvec}{\mathbf m}\) \(\newcommand{\zerovec}{\mathbf 0}\) \(\newcommand{\onevec}{\mathbf 1}\) \(\newcommand{\real}{\mathbb R}\) \(\newcommand{\twovec}[2]{\left[\begin{array}{r}#1 \\ #2 \end{array}\right]}\) \(\newcommand{\ctwovec}[2]{\left[\begin{array}{c}#1 \\ #2 \end{array}\right]}\) \(\newcommand{\threevec}[3]{\left[\begin{array}{r}#1 \\ #2 \\ #3 \end{array}\right]}\) \(\newcommand{\cthreevec}[3]{\left[\begin{array}{c}#1 \\ #2 \\ #3 \end{array}\right]}\) \(\newcommand{\fourvec}[4]{\left[\begin{array}{r}#1 \\ #2 \\ #3 \\ #4 \end{array}\right]}\) \(\newcommand{\cfourvec}[4]{\left[\begin{array}{c}#1 \\ #2 \\ #3 \\ #4 \end{array}\right]}\) \(\newcommand{\fivevec}[5]{\left[\begin{array}{r}#1 \\ #2 \\ #3 \\ #4 \\ #5 \\ \end{array}\right]}\) \(\newcommand{\cfivevec}[5]{\left[\begin{array}{c}#1 \\ #2 \\ #3 \\ #4 \\ #5 \\ \end{array}\right]}\) \(\newcommand{\mattwo}[4]{\left[\begin{array}{rr}#1 \amp #2 \\ #3 \amp #4 \\ \end{array}\right]}\) \(\newcommand{\laspan}[1]{\text{Span}\{#1\}}\) \(\newcommand{\bcal}{\cal B}\) \(\newcommand{\ccal}{\cal C}\) \(\newcommand{\scal}{\cal S}\) \(\newcommand{\wcal}{\cal W}\) \(\newcommand{\ecal}{\cal E}\) \(\newcommand{\coords}[2]{\left\{#1\right\}_{#2}}\) \(\newcommand{\gray}[1]{\color{gray}{#1}}\) \(\newcommand{\lgray}[1]{\color{lightgray}{#1}}\) \(\newcommand{\rank}{\operatorname{rank}}\) \(\newcommand{\row}{\text{Row}}\) \(\newcommand{\col}{\text{Col}}\) \(\renewcommand{\row}{\text{Row}}\) \(\newcommand{\nul}{\text{Nul}}\) \(\newcommand{\var}{\text{Var}}\) \(\newcommand{\corr}{\text{corr}}\) \(\newcommand{\len}[1]{\left|#1\right|}\) \(\newcommand{\bbar}{\overline{\bvec}}\) \(\newcommand{\bhat}{\widehat{\bvec}}\) \(\newcommand{\bperp}{\bvec^\perp}\) \(\newcommand{\xhat}{\widehat{\xvec}}\) \(\newcommand{\vhat}{\widehat{\vvec}}\) \(\newcommand{\uhat}{\widehat{\uvec}}\) \(\newcommand{\what}{\widehat{\wvec}}\) \(\newcommand{\Sighat}{\widehat{\Sigma}}\) \(\newcommand{\lt}{<}\) \(\newcommand{\gt}{>}\) \(\newcommand{\amp}{&}\) \(\definecolor{fillinmathshade}{gray}{0.9}\)- Describe the key characteristics of indirect functional brain imaging techniques.
- In basic terms, describe functional MRI (fMRI) and positron emission tomography (PET).
- Discuss the pros and cons of FMRI and PET.
Overview
In this section, we will discuss what makes a technique an indirect brain imaging technique and the two main indirect imaging techniques used to assess brain function: functional MRI (fMRI) and positron emission tomography (PET).
FMRI and PET
Indirect brain imaging techniques rely on an assumption that activity in the brain correlates to something else that we are able to measure. In these cases, these techniques measure blood flow in the brain. The assumption is that blood flow in the brain is related to the activity level in that area of the brain. Of course, with any assumption, there is always the risk that it could be wrong. Thankfully there is extensive research examining this assumption and the scientific consensus currently is that blood flow is an appropriate indication of brain activity. The two main indirect brain imaging techniques that we will cover are functional MRI (fMRI) and positron emission tomography (PET).
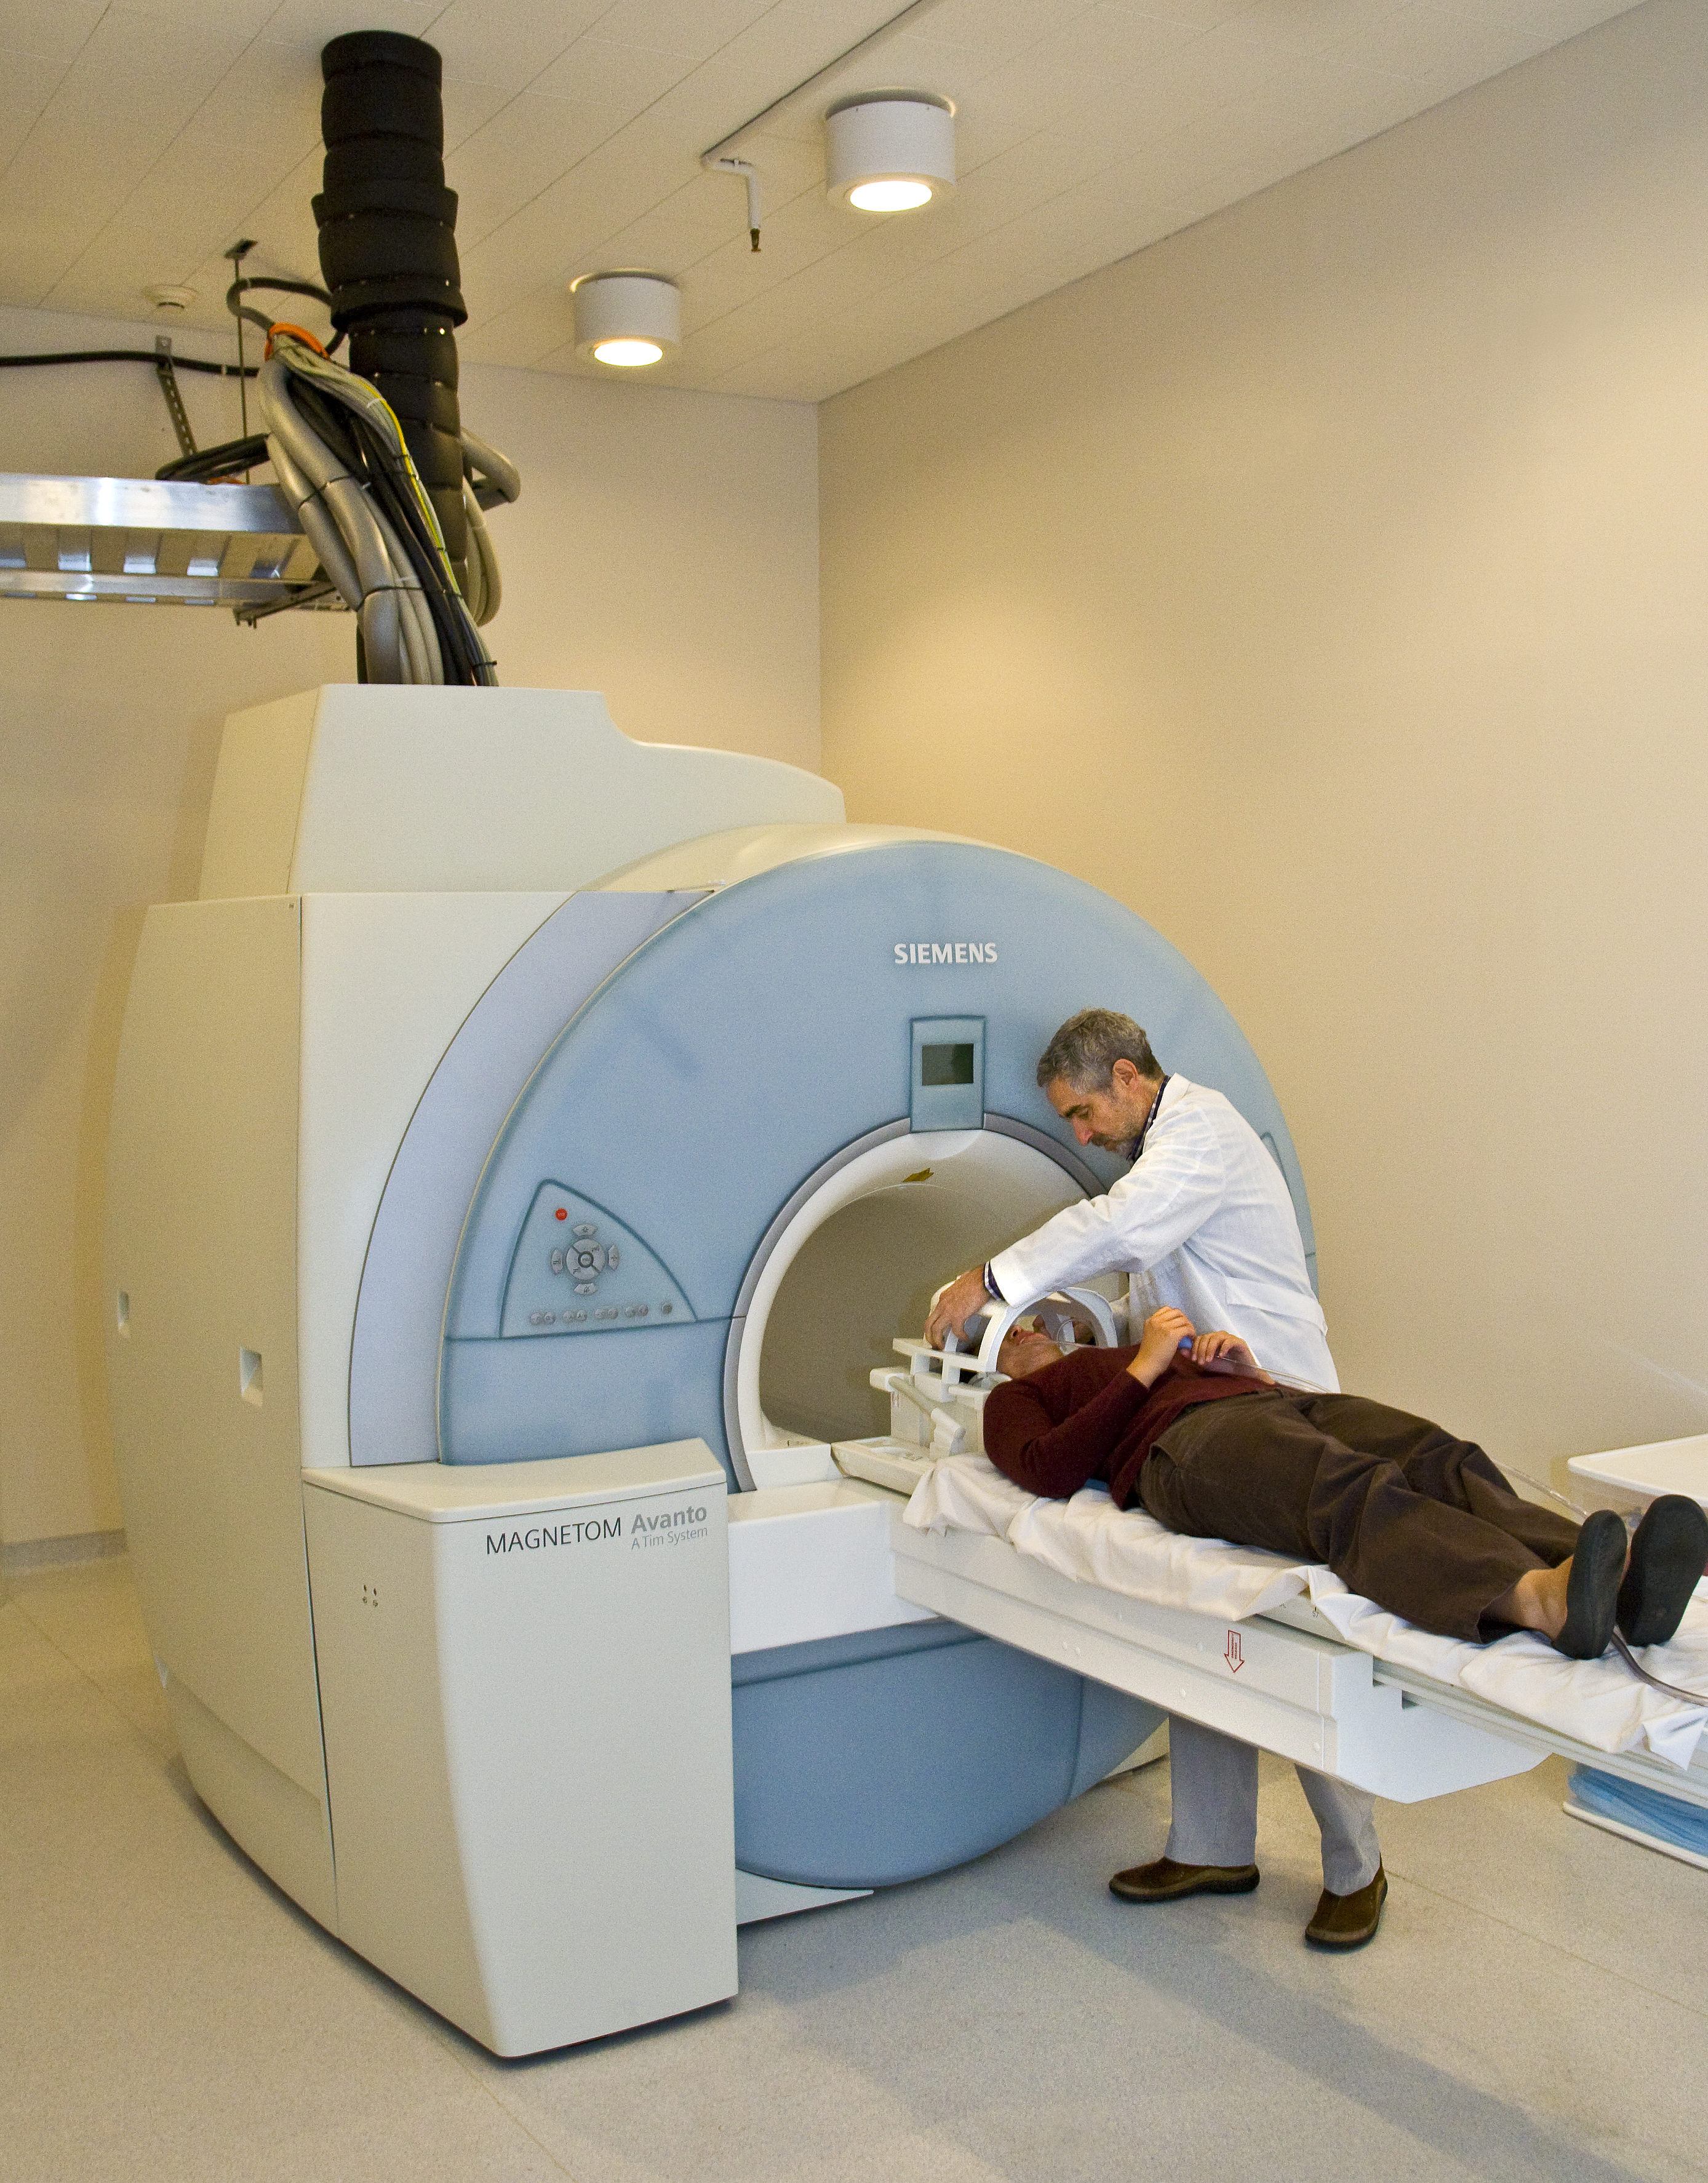
Functional magnetic resonance imaging (fMRI) is a method that is used to assess changes in the activity of tissue, such as measuring changes in neural activity in different areas of the brain during thoughts or experiences. This technique builds on the principles of structural MRI techniques and also uses the property that, when neurons fire, they use energy, which must be replenished. Glucose and oxygen, two key components for energy production, are supplied to the brain from the blood stream as needed. Oxygen is transported through the blood using hemoglobin, which contains binding sites for oxygen. When these sites are saturated with oxygen, it is referred to as oxygenated hemoglobin. When the oxygen molecules have all been released from a hemoglobin molecule, it is known as deoxygenated hemoglobin. As a set of neurons begin firing, oxygen in the blood surrounding those neurons is consumed, leading to a reduction in oxygenated hemoglobin. The body then compensates and provides an abundance of oxygenated hemoglobin in the blood surrounding that activated neural tissue. When activity in that neural tissue declines, the level of oxygenated hemoglobin slowly returns to its original level, which typically takes several seconds.
Figure \(\PageIndex{1}\) shows a subject about to go into a functional MRI machine.
fMRI measures the change in the concentration of oxygenated hemoglobin, which is known as the blood-oxygen-level-dependent (BOLD) signal. This leads to two important facts about fMRI. First, fMRI measures blood volume and blood flow, and from this we infer neural activity; as stated previously, fMRI does not measure neural activity directly. Second, fMRI data typically have poor temporal resolution; however, when combined with structural MRI, fMRI provides excellent spatial resolution. Temporal resolution for fMRI is typically on the order of seconds, whereas its spatial resolution is on the order of millimeters. Generally speaking, under most conditions there is an inverse relationship between temporal and spatial resolution—one can increase temporal resolution at the expense of spatial resolution and vice versa. In other words, as one increases the other decreases.
This method is valuable for identifying specific areas of the brain that are associated with different physical or psychological tasks. Clinically, fMRI may be used prior to neurosurgery in order to identify the brain areas that are associated with language so that the surgeon can avoid those areas during the operation. fMRI allows researchers to identify differential or convergent patterns of activation associated with tasks. For example, if participants are shown words on a screen and are expected to indicate the color of the letters, are the same brain areas recruited for this task if the words have emotional content or not? Does this relationship change in psychological disorders such as anxiety or depression? Is there a different pattern of activation even in the absence of obvious performance differences? fMRI is an excellent tool for comparing brain activation in different tasks and/or populations.
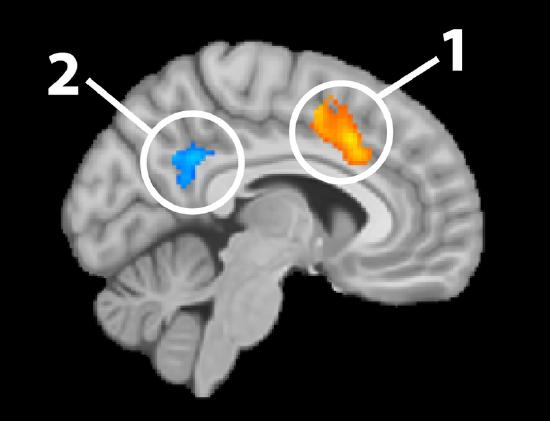
Figure \(\PageIndex{2}\) provides an example of results from fMRI analyses overlaid on a structural MRI image. The blue and orange shapes represent areas with significant changes in the BOLD signal, thus changes in neural activation.
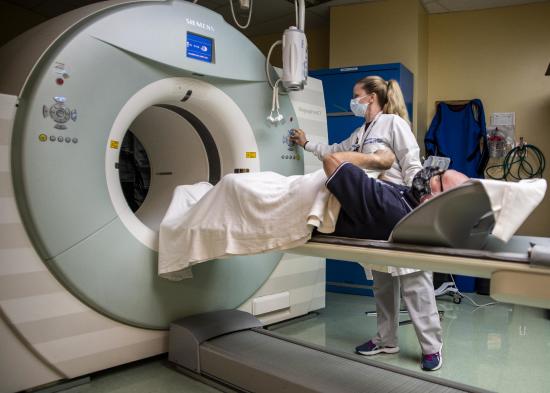
Positron emission tomography (PET) is a medical imaging technique that is used to measure processes in the body, including the brain (see Figure \(\PageIndex{3}\) for a PET scanner). This method relies on a positron-emitting tracer atom that is introduced into the blood stream in a biologically active molecule, such as glucose, water, or ammonia. A positron is a particle much like an electron but with a positive charge. One example of a biologically active molecule is fludeoxyglucose, which acts similarly to glucose in the body. Fludeoxyglucose will concentrate in areas where glucose is needed—commonly areas with higher metabolic (energy) needs. Over time, this tracer molecule emits positrons, which are detected by a sensor. The spatial location of the tracer molecule in the brain can be determined based on the emitted positrons. This allows researchers to construct a three-dimensional image of the areas of the brain that have the highest metabolic needs, typically those that are most active. Images resulting from PET usually represent neural activity that has occurred over tens of minutes, which is very poor temporal resolution for some purposes. PET images are often combined with computed tomography (CT) images to improve spatial resolution, as fine as several millimeters. Tracers can also be incorporated into molecules that bind to neurotransmitter receptors, which allow researchers to answer some unique questions about the action of neurotransmitters. Unfortunately, very few research centers have the equipment required to obtain the images or the special equipment needed to create the positron-emitting tracer molecules, which typically need to be produced on site.
Using Indirect Functional Imaging Techniques to Study a Disorder: Autism Spectrum Disorder
PET and fMRI studies of ASD have found different levels of neuronal activity in the amygdala and the hippocampus compared to subjects without ASD. These areas are notable because they are a part of the “social brain.” These studies have largely focused on patients with ASD when they are viewing faces. As the viewing of faces is a large part of socializing (for example, reading expressions and making eye contact) and socializing is one area where many autistic patients have issues, these studies help provide further information for doctors and researchers to use. (See Philip et al. (2012) for a review of the fMRI studies of ASD.)
Transcranial Magnetic Stimulation
Another technique that is worth mentioning is transcranial magnetic stimulation (TMS). TMS is a noninvasive method that causes depolarization or hyperpolarization in neurons near the scalp. Depolarizations are increases in the electrical state of the neuron, while hyperpolarizations are decreases. In TMS, a coil of wire is placed just above the participant’s scalp (as shown in Figure \(\PageIndex{4}\)). When electricity flows through the coil, it produces a magnetic field. This magnetic field travels through the skull and scalp and affects neurons near the surface of the brain. When the magnetic field is rapidly turned on and off, a current is induced in the neurons, leading to depolarization or hyperpolarization, depending on the number of magnetic field pulses. Single- or paired-pulse TMS depolarizes site-specific neurons in the cortex, causing them to fire. If this method is used over certain brain areas involved with motor control, it can produce or block muscle activity, such as inducing a finger twitch or preventing someone from pressing a button. If used over brain areas involved with visual perception, it can produce sensations of flashes of light or impair visual processes. This has proved to be a valuable tool in studying the function and timing of specific processes such as the recognition of visual stimuli.
Repetitive TMS produces effects that last longer than the initial stimulation. Depending on the intensity, coil orientation, and frequency, neural activity in the stimulated area may be either attenuated or amplified. Used in this manner, TMS is able to explore neural plasticity, which is the ability of connections between neurons to change. This has implications for treating psychological disorders, such as depression, as well as understanding long-term changes in neuronal excitability.
Note that TMS is different from the previous techniques in that we are not taking images of what the brain is doing. TMS disrupts or stimulates the brain and actively changes what the brain is doing.
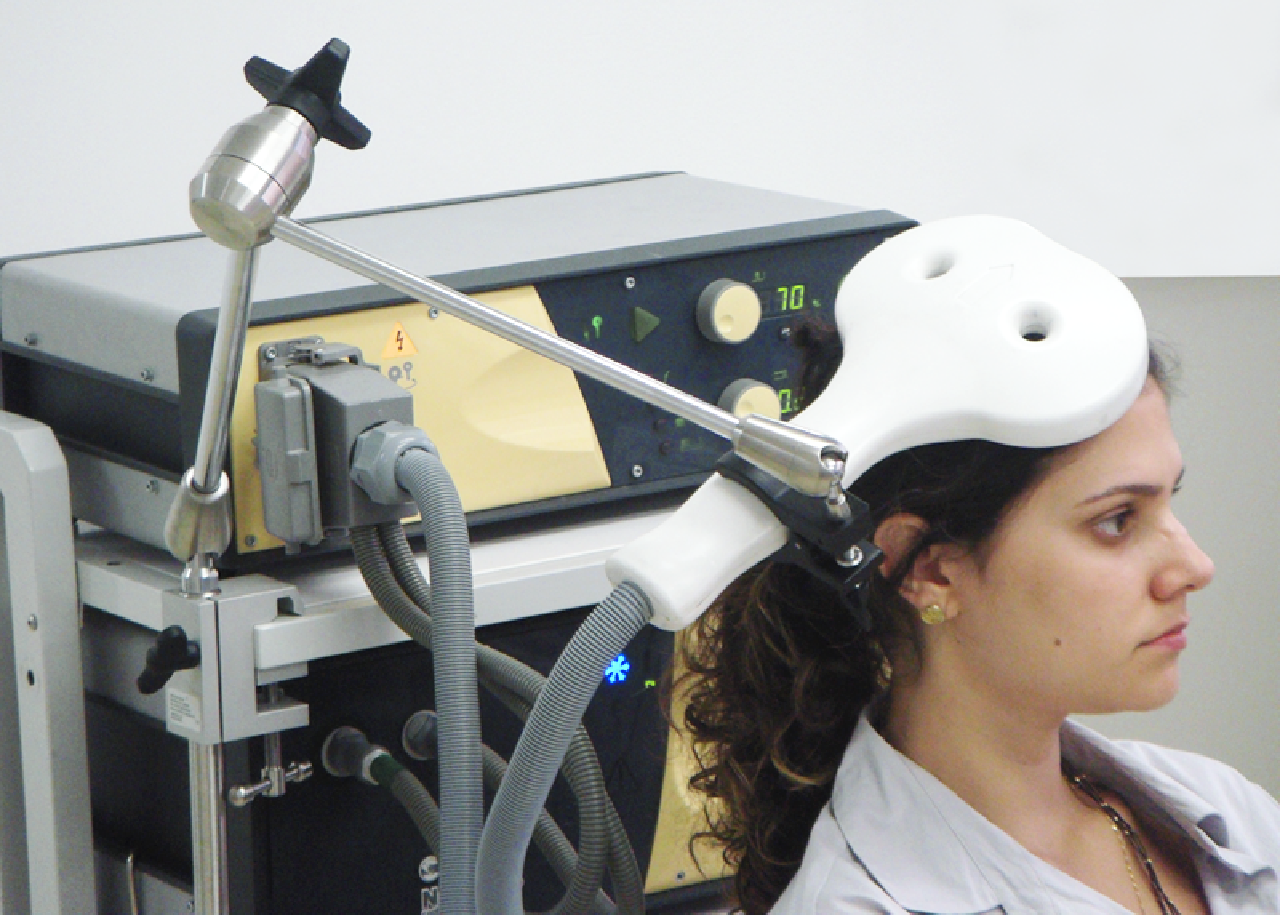
Figure \(\PageIndex{4}\): Woman with TMS wand pressed against the back right side of her head. Credit: "TMS"(opens in new window) by Baburov(opens in new window) is licensed under CC BY-SA 4.0(opens in new window)
Using Transcranial Magnetic Imaging to Study a Disorder: Autism Spectrum Disorder
TMS studies, as with most research techniques, can come in the form of basic research (research intended to inform our understanding) and applied research (research intended to solve a problem). Basic research in neuroscience is typically driven by research questions aimed at a general understanding of how the brain and nervous system work. Some TMS studies have used TMS to reduce brain activity in the right amygdala during the processing of faces with negative emotions (Baeken et al., 2010). Although this research wasn’t specific to autism, it is not hard to see the connection between understanding how the amygdala works and ASD. Furthermore, studies have tried to use TMS to treat ASD. Studies thus far have focused on using TMS to change activity levels and possibly stimulate neural plasticity. There was even a transcranial magnetic stimulation therapy for autism conference held in 2014 to discuss the use of the tool in the treatment of ASD. Indeed, there are myriad of possibilities for how this tool can be used in the future. (See Oberman et al. (2015) for a review of TMS treatments for ASD.)
References
Baeken, C., De Raedt, R., Van Schuerbeek, P., Vanderhasselt, M. A., De Mey, J., Bossuyt, A., & Luypaert, R. (2010). Right prefrontal HF-rtms attenuates right amygdala processing of negatively valenced emotional stimuli in healthy females. Behavioural Brain Research, 214(2), 450–455.
Oberman, L. M., Enticott, P. G., Casanova, M. F., Rotenberg, A., Pascual-Leone, A., & McCracken, J. T. (2015). Transcranial magnetic stimulation in autism spectrum disorder: Challenges, promise, and roadmap for future research. Autism Research, 9(2), 184–203.
Philip, R. C. M., Dauvermann, M. R., Whalley, H. C., Baynham, K., Lawrie, S. M., & Stanfield, A. C. (2012). A systematic review and meta-analysis of the fmri investigation of Autism Spectrum Disorders. Neuroscience & Biobehavioral Reviews, 36(2), 901–942.
Attributions
- Psychophysiological Methods in Neuroscience(opens in new window) by Zachary Infantolino and Gregory A. Miller(opens in new window) is licensed under a CC BY-NC-SA 4.0 International License.
- Figure \(\PageIndex{1}\): "Neurodegenerative Diseases and Cognition"(opens in new window) by Berkeley Lab(opens in new window) is licensed under CC BY-NC-ND 2.0(opens in new window)
- Figure \(\PageIndex{3}\): "NMCSD Nuclear Medicine Department Conducts PET Scan"(opens in new window) is in the Public Domain(opens in new window)
- Figure \(\PageIndex{4}\): "TMS"(opens in new window) by Baburov(opens in new window) is licensed under CC BY-SA 4.0(opens in new window)