
10.2: Sampling approaches for quantitative research
- Page ID
- 135139

\( \newcommand{\vecs}[1]{\overset { \scriptstyle \rightharpoonup} {\mathbf{#1}} } \)
\( \newcommand{\vecd}[1]{\overset{-\!-\!\rightharpoonup}{\vphantom{a}\smash {#1}}} \)
\( \newcommand{\dsum}{\displaystyle\sum\limits} \)
\( \newcommand{\dint}{\displaystyle\int\limits} \)
\( \newcommand{\dlim}{\displaystyle\lim\limits} \)
\( \newcommand{\id}{\mathrm{id}}\) \( \newcommand{\Span}{\mathrm{span}}\)
( \newcommand{\kernel}{\mathrm{null}\,}\) \( \newcommand{\range}{\mathrm{range}\,}\)
\( \newcommand{\RealPart}{\mathrm{Re}}\) \( \newcommand{\ImaginaryPart}{\mathrm{Im}}\)
\( \newcommand{\Argument}{\mathrm{Arg}}\) \( \newcommand{\norm}[1]{\| #1 \|}\)
\( \newcommand{\inner}[2]{\langle #1, #2 \rangle}\)
\( \newcommand{\Span}{\mathrm{span}}\)
\( \newcommand{\id}{\mathrm{id}}\)
\( \newcommand{\Span}{\mathrm{span}}\)
\( \newcommand{\kernel}{\mathrm{null}\,}\)
\( \newcommand{\range}{\mathrm{range}\,}\)
\( \newcommand{\RealPart}{\mathrm{Re}}\)
\( \newcommand{\ImaginaryPart}{\mathrm{Im}}\)
\( \newcommand{\Argument}{\mathrm{Arg}}\)
\( \newcommand{\norm}[1]{\| #1 \|}\)
\( \newcommand{\inner}[2]{\langle #1, #2 \rangle}\)
\( \newcommand{\Span}{\mathrm{span}}\) \( \newcommand{\AA}{\unicode[.8,0]{x212B}}\)
\( \newcommand{\vectorA}[1]{\vec{#1}} % arrow\)
\( \newcommand{\vectorAt}[1]{\vec{\text{#1}}} % arrow\)
\( \newcommand{\vectorB}[1]{\overset { \scriptstyle \rightharpoonup} {\mathbf{#1}} } \)
\( \newcommand{\vectorC}[1]{\textbf{#1}} \)
\( \newcommand{\vectorD}[1]{\overrightarrow{#1}} \)
\( \newcommand{\vectorDt}[1]{\overrightarrow{\text{#1}}} \)
\( \newcommand{\vectE}[1]{\overset{-\!-\!\rightharpoonup}{\vphantom{a}\smash{\mathbf {#1}}}} \)
\( \newcommand{\vecs}[1]{\overset { \scriptstyle \rightharpoonup} {\mathbf{#1}} } \)
\(\newcommand{\longvect}{\overrightarrow}\)
\( \newcommand{\vecd}[1]{\overset{-\!-\!\rightharpoonup}{\vphantom{a}\smash {#1}}} \)
\(\newcommand{\avec}{\mathbf a}\) \(\newcommand{\bvec}{\mathbf b}\) \(\newcommand{\cvec}{\mathbf c}\) \(\newcommand{\dvec}{\mathbf d}\) \(\newcommand{\dtil}{\widetilde{\mathbf d}}\) \(\newcommand{\evec}{\mathbf e}\) \(\newcommand{\fvec}{\mathbf f}\) \(\newcommand{\nvec}{\mathbf n}\) \(\newcommand{\pvec}{\mathbf p}\) \(\newcommand{\qvec}{\mathbf q}\) \(\newcommand{\svec}{\mathbf s}\) \(\newcommand{\tvec}{\mathbf t}\) \(\newcommand{\uvec}{\mathbf u}\) \(\newcommand{\vvec}{\mathbf v}\) \(\newcommand{\wvec}{\mathbf w}\) \(\newcommand{\xvec}{\mathbf x}\) \(\newcommand{\yvec}{\mathbf y}\) \(\newcommand{\zvec}{\mathbf z}\) \(\newcommand{\rvec}{\mathbf r}\) \(\newcommand{\mvec}{\mathbf m}\) \(\newcommand{\zerovec}{\mathbf 0}\) \(\newcommand{\onevec}{\mathbf 1}\) \(\newcommand{\real}{\mathbb R}\) \(\newcommand{\twovec}[2]{\left[\begin{array}{r}#1 \\ #2 \end{array}\right]}\) \(\newcommand{\ctwovec}[2]{\left[\begin{array}{c}#1 \\ #2 \end{array}\right]}\) \(\newcommand{\threevec}[3]{\left[\begin{array}{r}#1 \\ #2 \\ #3 \end{array}\right]}\) \(\newcommand{\cthreevec}[3]{\left[\begin{array}{c}#1 \\ #2 \\ #3 \end{array}\right]}\) \(\newcommand{\fourvec}[4]{\left[\begin{array}{r}#1 \\ #2 \\ #3 \\ #4 \end{array}\right]}\) \(\newcommand{\cfourvec}[4]{\left[\begin{array}{c}#1 \\ #2 \\ #3 \\ #4 \end{array}\right]}\) \(\newcommand{\fivevec}[5]{\left[\begin{array}{r}#1 \\ #2 \\ #3 \\ #4 \\ #5 \\ \end{array}\right]}\) \(\newcommand{\cfivevec}[5]{\left[\begin{array}{c}#1 \\ #2 \\ #3 \\ #4 \\ #5 \\ \end{array}\right]}\) \(\newcommand{\mattwo}[4]{\left[\begin{array}{rr}#1 \amp #2 \\ #3 \amp #4 \\ \end{array}\right]}\) \(\newcommand{\laspan}[1]{\text{Span}\{#1\}}\) \(\newcommand{\bcal}{\cal B}\) \(\newcommand{\ccal}{\cal C}\) \(\newcommand{\scal}{\cal S}\) \(\newcommand{\wcal}{\cal W}\) \(\newcommand{\ecal}{\cal E}\) \(\newcommand{\coords}[2]{\left\{#1\right\}_{#2}}\) \(\newcommand{\gray}[1]{\color{gray}{#1}}\) \(\newcommand{\lgray}[1]{\color{lightgray}{#1}}\) \(\newcommand{\rank}{\operatorname{rank}}\) \(\newcommand{\row}{\text{Row}}\) \(\newcommand{\col}{\text{Col}}\) \(\renewcommand{\row}{\text{Row}}\) \(\newcommand{\nul}{\text{Nul}}\) \(\newcommand{\var}{\text{Var}}\) \(\newcommand{\corr}{\text{corr}}\) \(\newcommand{\len}[1]{\left|#1\right|}\) \(\newcommand{\bbar}{\overline{\bvec}}\) \(\newcommand{\bhat}{\widehat{\bvec}}\) \(\newcommand{\bperp}{\bvec^\perp}\) \(\newcommand{\xhat}{\widehat{\xvec}}\) \(\newcommand{\vhat}{\widehat{\vvec}}\) \(\newcommand{\uhat}{\widehat{\uvec}}\) \(\newcommand{\what}{\widehat{\wvec}}\) \(\newcommand{\Sighat}{\widehat{\Sigma}}\) \(\newcommand{\lt}{<}\) \(\newcommand{\gt}{>}\) \(\newcommand{\amp}{&}\) \(\definecolor{fillinmathshade}{gray}{0.9}\)Learning Objectives
Learners will be able to…
- Determine whether you will use probability or non-probability sampling, given the strengths and limitations of each specific sampling approach
- Distinguish between approaches to probability sampling and detail the reasons to use each approach
Sampling in quantitative research projects is done because it is not feasible to study the whole population, and researchers hope to take what we learn about a small group of people (your sample) and apply it to a larger population. There are many ways to approach this process, and they can be grouped into two categories—probability sampling and non-probability sampling. Sampling approaches are inextricably linked with recruitment, and researchers should ensure that their proposal’s recruitment strategy matches the sampling approach.
Probability sampling approaches use a random process, usually a computer program, to select participants from the sampling frame so that everyone has an equal chance of being included. It’s important to note that random means the researcher used a process that is truly random. In a project sampling college students, standing outside of the building in which your social work department is housed and surveying everyone who walks past is not random. Because of the location, you are likely to recruit a disproportionately large number of social work students and fewer from other disciplines. Depending on the time of day, you may recruit more traditional undergraduate students, who take classes during the day, or more graduate students, who take classes in the evenings.
In this example, you are actually using non-probability sampling. Another way to say this is that you are using the most common sampling approach for student projects, availability sampling. Also called convenience sampling, this approach simply recruits people who are convenient or easily available to the researcher. If you have ever been asked by a friend to participate in their research study for their class or seen an advertisement for a study on a bulletin board or social media, you were being recruited using an availability sampling approach.
There are a number of benefits to the availability sampling approach. First and foremost, it is less costly and time-consuming for the researcher. As long as the person you are attempting to recruit has knowledge of the topic you are studying, the information you get from the sample you recruit will be relevant to your topic (although your sample may not necessarily be representative of a larger population). Availability samples can also be helpful when random sampling isn’t practical. If you are planning to survey students in an LGBTQ+ support group on campus but attendance varies from meeting to meeting, you may show up at a meeting and ask anyone present to participate in your study. A support group with varied membership makes it impossible to have a real list—or sampling frame—from which to randomly select individuals. Availability sampling would help you reach that population.
Availability sampling is appropriate for student and smaller-scale projects, but it comes with significant limitations. The purpose of sampling in quantitative research is to generalize from a small sample to a larger population. Because availability sampling does not use a random process to select participants, the researcher cannot be sure their sample is representative of the population they hope to generalize to. Instead, the recruitment processes may have been structured by other factors that may bias the sample to be different in some way than the overall population.
So, for instance, if we asked social work students about their level of satisfaction with the services at the student health center, and we sampled in the evenings, we would get most likely get a biased perspective of the issue. Students taking only night classes are much more likely to commute to school, spend less time on campus, and use fewer campus services. Our results would not represent what all social work students feel about the topic. We might get the impression that no social work student had ever visited the health center, when that is not actually true at all. Sampling bias will be discussed in detail in Section 10.3.

Approaches to probability sampling
What might be a better strategy is getting a list of all email addresses of social work students and randomly selecting email addresses of students to whom you can send your survey. This would be an example of simple random sampling. It’s important to note that you need a real list of people in your sampling frame from which to select your email addresses. For projects where the people who could potentially participate is not known by the researcher, probability sampling is not possible. It is likely that administrators at your school’s registrar would be reluctant to share the list of students’ names and email addresses. Always remember to consider the feasibility and ethical implications of the sampling approach you choose.
Usually, simple random sampling is accomplished by assigning each person, or element, in your sampling frame a number and selecting your participants using a random number generator. You would follow an identical process if you were sampling records or documents as your elements, rather than people. True randomness is difficult to achieve, and it takes complex computational calculations to do so. Although you think you can select things at random, human-generated randomness is actually quite predictable, as it falls into patterns called heuristics. To truly randomly select elements, researchers must rely on computer-generated help. Many free websites have good pseudo-random number generators. A good example is the website Random.org, which contains a random number generator that can also randomize lists of participants. Sometimes, researchers use a table of numbers that have been generated randomly. There are several possible sources for obtaining a random number table. Some statistics and research methods textbooks provide such tables in an appendix.
Though simple, this approach to sampling can be tedious since the researcher must assign a number to each person in a sampling frame. Systematic sampling techniques are somewhat less tedious but offer the benefits of a random sample. As with simple random samples, you must possess a list of everyone in your sampling frame. Once you’ve done that, to draw a systematic sample you’d simply select every kth element on your list. But what is k, and where on the list of population elements does one begin the selection process?
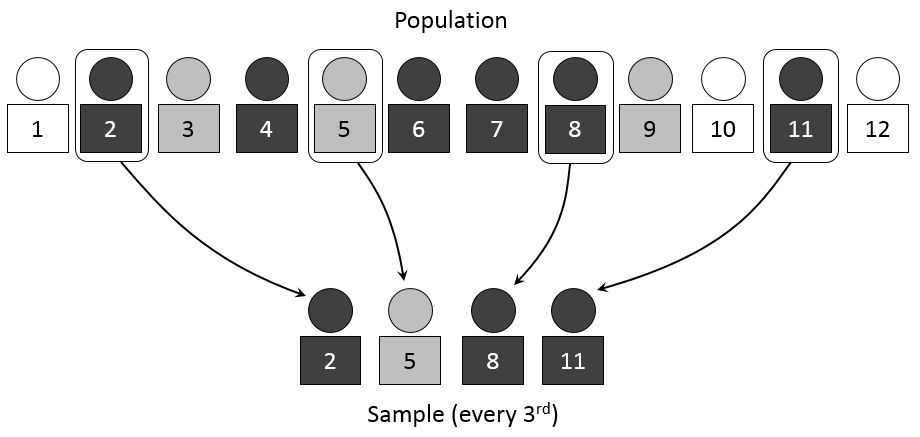
Figure 10.2 Systematic sampling
k is your selection interval or the distance between the elements you select for inclusion in your study. To begin the selection process, you’ll need to figure out how many elements you wish to include in your sample. Let’s say you want to survey 25 social work students and there are 100 social work students on your campus. In this case, your selection interval, or k, is 4. To get your selection interval, simply divide the total number of population elements by your desired sample size. Systematic sampling starts by randomly selecting a number between 1 and k to start from, and then recruiting every kth person. In our example, we may start at number 3 and then select the 7th, 11th, 15th (and so forth) person on our list of email addresses. In Figure 10.2, you can see the researcher starts at number 2 and then selects every third person for inclusion in the sample.
There is one clear instance in which systematic sampling should not be employed. If your sampling frame has any pattern to it, you could inadvertently introduce bias into your sample by using a systemic sampling strategy. (Bias will be discussed in more depth in section 10.3.) This is sometimes referred to as the problem of periodicity. Periodicity refers to the tendency for a pattern to occur at regular intervals.
To stray a bit from our example, imagine we were sampling client charts based on the date they entered a health center and recording the reason for their visit. We may expect more admissions for issues related to alcohol consumption on the weekend than we would during the week. The periodicity of alcohol intoxication may bias our sample towards either overrepresenting or underrepresenting this issue, depending on our sampling interval and whether we collected data on a weekday or weekend.
Advanced probability sampling techniques
Returning again to our idea of sampling student email addresses, one of the challenges in our study will be the different types of students. If we are interested in all social work students, it may be helpful to divide our sampling frame, or list of students, into three lists—one for traditional, full-time undergraduate students, another for part-time undergraduate students, and one more for full-time graduate students—and then randomly select from these lists. This is particularly important if we wanted to make sure our sample had the same proportion of each type of student compared with the general population.
This approach is called stratified random sampling. In stratified random sampling, a researcher will divide the study population into relevant subgroups or strata and then draw a sample from each subgroup, or stratum. Strata is the plural of stratum, so it refers to all of the groups while stratum refers to each group. This can be used to make sure your sample has the same proportion of people from each stratum. If, for example, our sample had many more graduate students than undergraduate students, we may draw incorrect conclusions that do not represent what all social work students experience.
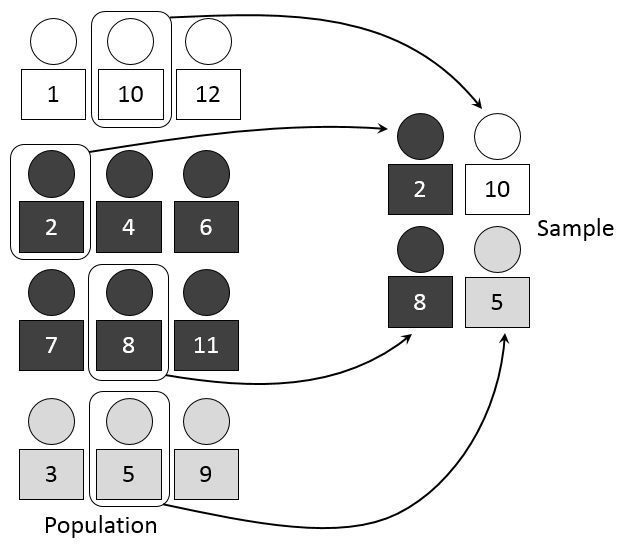
Figure 10.3 Stratified sampling
Generally, the goal of stratified random sampling is to recruit a sample that makes sure all elements of the population are included sufficiently that conclusions can be drawn about them. Usually, the purpose is to create a sample that is identical to the overall population along whatever strata you’ve identified. In our sample, it would be graduate and undergraduate students. Stratified random sampling is also useful when a subgroup of interest makes up a relatively small proportion of the overall sample. For example, if your social work program contained relatively few Asian students but you wanted to make sure you recruited enough Asian students to conduct statistical analysis, you could use race to divide people into subgroups or strata and then disproportionately sample from the Asian students to make sure enough of them were in your sample to draw meaningful conclusions. Statistical tests may have a minimum number
Up to this point in our discussion of probability samples, we’ve assumed that researchers will be able to access a list of population elements in order to create a sampling frame. This, as you might imagine, is not always the case. Let’s say, for example, that you wish to conduct a study of health center usage across students at each social work program in your state. Just imagine trying to create a list of every single social work student in the state. Even if you could find a way to generate such a list, attempting to do so might not be the most practical use of your time or resources. When this is the case, researchers turn to cluster sampling. Cluster sampling occurs when a researcher begins by sampling groups (or clusters) of population elements and then selects elements from within those groups.
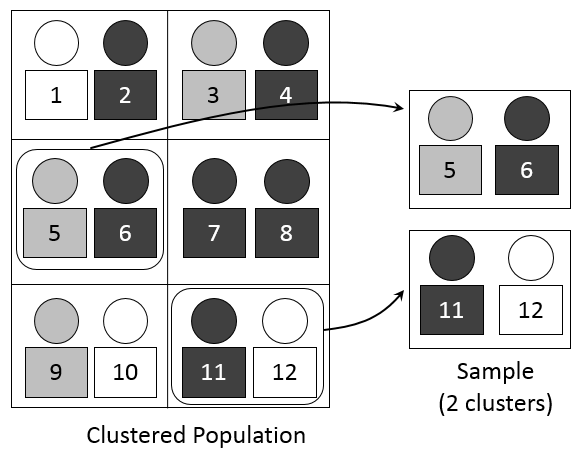
Figure 10.4 Cluster sampling
Let’s work through how we might use cluster sampling. While creating a list of all social work students in your state would be next to impossible, you could easily create a list of all social work programs in your state. Then, you could draw a random sample of social work programs (your cluster) and then draw another random sample of elements (in this case, social work students) from each of the programs you randomly selected from the list of all programs.
Cluster sampling often works in stages. In this example, we sampled in two stages—(1) social work programs and (2) social work students at each program we selected. However, we could add another stage if it made sense to do so. We could randomly select (1) states in the United States (2) social work programs in that state and (3) individual social work students. As you might have guessed, sampling in multiple stages does introduce a greater possibility of error. Each stage is subject to its own sampling problems. But, cluster sampling is nevertheless a highly efficient method.
Jessica Holt and Wayne Gillespie (2008)\(^3\) used cluster sampling in their study of students’ experiences with violence in intimate relationships. Specifically, the researchers randomly selected 14 classes on their campus and then drew a random sub-sample of students from those classes. But you probably know from your experience with college classes that not all classes are the same size. So, if Holt and Gillespie had simply randomly selected 14 classes and then selected the same number of students from each class to complete their survey, then students in the smaller of those classes would have had a greater chance of being selected for the study than students in the larger classes. Keep in mind, with random sampling the goal is to make sure that each element has the same chance of being selected. When clusters are of different sizes, as in the example of sampling college classes, researchers often use a method called probability proportionate to size (PPS). This means that they take into account that their clusters are of different sizes. They do this by giving clusters different chances of being selected based on their size so that each element within those clusters winds up having an equal chance of being selected.
To summarize, probability samples allow a researcher to make conclusions about larger groups. Probability samples require a sampling frame from which elements, usually human beings, can be selected at random from a list. The use of random selection reduces the error and bias present in non-probability samples, which we will discuss in greater detail in section 10.3, though some error will always remain. In relying on a random number table or generator, researchers can more accurately state that their sample represents the population from which it was drawn. This strength is common to all probability sampling approaches summarized in Table 10.2.
Table 10.2 Types of probability samples
| Sample type | Description |
| Simple random | Researcher randomly selects elements from sampling frame. |
| Systematic | Researcher selects every kth element from sampling frame. |
| Stratified | Researcher creates subgroups then randomly selects elements from each subgroup. |
| Cluster | Researcher randomly selects clusters then randomly selects elements from selected clusters. |
In determining which probability sampling approach makes the most sense for your project, it helps to know more about your population. A simple random sample and systematic sample are relatively similar to carry out. They both require a list all elements in your sampling frame. Systematic sampling is slightly easier in that it does not require you to use a random number generator, instead using a sampling interval that is easy to calculate by hand.
However, the relative simplicity of both approaches is counterweighted by their lack of sensitivity to characteristics of your population. Stratified samples can better account for periodicity by creating strata that reduce or eliminate its effects. Stratified sampling also ensure that smaller subgroups are included in your sample, thereby making your sample more representative of the overall population. While these benefits are important, creating strata for this purpose requires having information about your population before beginning the sampling process. In our social work student example, we would need to know which students are full-time or part-time, graduate or undergraduate, in order to make sure our sample contained the same proportions. Would you know if someone was a graduate student or part-time student, just based on their email address? If the true population parameters are unknown, stratified sampling becomes significantly more challenging.
Common to each of the previous probability sampling approaches is the necessity of using a real list of all elements in your sampling frame. Cluster sampling is different. It allows a researcher to perform probability sampling in cases for which a list of elements is not available or feasible to create. Cluster sampling is also useful for making claims about a larger population (in our previous example, all social work students within a state). However, because sampling occurs at multiple stages in the process, (in our previous example, at the university and student level), sampling error increases. For many researchers, the benefits of cluster sampling outweigh this weaknesses.
Matching recruitment and sampling approach
Recruitment must match the sampling approach you choose in section 10.2. For many students, that will mean using recruitment techniques most relevant to availability sampling. These may include public postings such as flyers, mass emails, or social media posts. However, these methods would not make sense for a study using probability sampling. Probability sampling requires a list of names or other identifying information so you can use a random process to generate a list of people to recruit into your sample. Posting a flyer or social media message means you don’t know who is looking at the flyer, and thus, your sample could not be randomly drawn. Probability sampling often requires knowing how to contact specific participants. For example, you may do as I did, and contact potential participants via phone and email. Even then, it’s important to note that not everyone you contact will enter your study. We will discuss more about evaluating the quality of your sample in section 10.3.
Key Takeaways
- Probability sampling approaches are more accurate when the researcher wants to generalize from a smaller sample to a larger population. However, non-probability sampling approaches are often more feasible. You will have to weigh advantages and disadvantages of each when designing your project.
- There are many kinds of probability sampling approaches, though each require you know some information about people who potentially would participate in your study.
- Probability sampling also requires that you assign people within the sampling frame a number and select using a truly random process.
Exercises
Building on the step-by-step sampling plan from the exercises in section 10.1:
- Identify one of the sampling approaches listed in this chapter that might be appropriate to answering your question and list the strengths and limitations of it.
- Describe how you will recruit your participants and how your plan makes sense with the sampling approach you identified.
Examine one of the empirical articles from your literature review.
- Identify what sampling approach they used and how they carried it out from start to finish.