A surface survey is a key method by which archaeologists decide how to investigate an archaeological site. The survey influences what they find and what stories are ultimately told about the history and prehistory of the region. Archaeologists have to make decisions about what survey methods to employ, and those decisions affect the kinds of materials they can detect and, thus, the occupations and cultures they can identify.
Your instructor will divide the class into groups and assign each group a survey area that has been divided into grid squares. You have enough funds to conduct a 15-day survey and can survey one square per day, assuming no unexpected circumstances interfere ;). Features in the landscape present no obstacles to you and you can survey at the same rate regardless of the topographical features present in each square.
Our class will employ the four sampling strategies summarized in the following table: simple random, stratified random, systematic, and stratified unaligned systematic.
Sampling strategy
Brief description
Simple random sample
The number of units, or grid squares on a coordinate grid map, to be sampled is chosen using a random number generator from a number table, app, or website such as www.calculatorsoup.com/calculators/statistics/number-generator.php.
Stratified random sample
The area to be sampled is divided into natural zones and the number of units (grid squares) to sample is chosen using a random number generator to represent equally each type of natural zone. Thus, if 50% of the area is forested, 50% of the sampled units will be in forested areas.
Systematic sample
Sampling is conducted in equally and regularly spaced units, such as every third grid square.
Stratified unaligned systematic sample
The site is divided into an arbitrary number of equally sized zones, as determined by the researcher. A predetermined number of units in each zone are randomly selected for sampling.
Your instructor will tell you how many and which of these sampling strategies to use.
Using the following instructions, adopt a survey method and mark 15 squares within the grid to survey on the map provided. On each map, you will find 15 letters, A through O, labeling the columns and 15 numbers, 1 through 15, labeling the rows. You will use these letters and numbers as coordinates to identify the squares you will sample later in the activity.
Simple Random Sample
Use the random number and letter generator found at www.calculatorsoup.com/calculators/statistics/number-generator.php to generate a list of 15 random letters and 15 random numbers. Set your generator in the following way:
For letters: sample size = 15, sample range = A–O, and be sure to allow for duplicates and to print the commas.
For numbers: sample size = 15, sample range = 1–15, and be sure to allow for duplicates and to print the commas.
Run each request separately and write your results below.
Letters
Numbers
Next, check your combinations to see if there are duplicate letter/number combinations (e.g., L3 is listed more than once). If you find any duplicates, run the number and letter set generators once to obtain a new letter and number combination to replace each duplicate.
Each line in your table identifies a sampling unit (grid square) by letter and number. Mark each of the sampling units on your map.
Stratified Random Sample
Identify the types of natural zones in the sampling area using your map. Natural zones include mountains, forests, rivers, and marshes. List the zones in the sampling area here:
Calculate the proportion of tree cover.
Count the squares on your map that have any amount of tree cover. Include every square that has even the tiniest amount of forest. How many squares are there?
The total number of squares in the map is 225 (15 x 15). Calculate the proportion of squares on the map that have some tree cover by dividing the number you counted in 2a by the total of 225 and moving the decimal point two spaces to the right to convert the number to a percentage. For example, if 18 squares include some forest cover, you divide 18 by 225 and move the decimal, finding that 8% of the sampling area has some forest cover.
What proportion of your sampling area has tree cover?
Calculate the proportion of hills.
Count the squares on the map that touch any part of a hill and record the number.
Determine the percentage of the sampling area that is hilly using the same formula as for tree cover and the number of squares identified as hilly in 3a.
What proportion of your sampling area is hilly?
Determine the proportion of open space.
Add your percentages of forested and hilly land from 2b and 3b together (e.g., 8% and 25% = 33%).
Subtract your results in 4a from 100(%) to determine the total percentage of open space and record it here (e.g., 100% – 33% = 67%).
You can devote 15 days to surveying and can sample one unit per day. Under stratified random sampling, the number of days you spend surveying forested and hilly areas should be proportional to the percentage of the total area covered by these zones. If tree cover represents 35% of your survey area, you need to devote 35% of your surveying to squares with tree cover. Therefore, you need to know how many days amount to 35% of your time, which you determine by multiplying 15 days by 0.35. Follow traditional rounding rules by rounding decimals of 5–9 up and decimals of 1–4 down.
Given the percentage of forest cover you identified in 2b, how many full days do you devote to units that have tree cover?
Given the percentage of hilly units identified in 3b, how many full days do you devote to units that have hills?
How many days do you devote to the rest of the area, which is open space, based on the percentage you calculated in 4b?
Select an appropriate number of units to sample in tree covered areas, hilly areas, and open space. You would normally use a random number generator to select the units, but we don’t have all day! Make sure you have chosen the correct number of units for each zone and mark them on your map.
Systematic Sample
Hooray! Your instructions are the easiest to follow. However, inclement conditions have struck and you will only be able to conduct 12 days of sampling.
You will be spreading the sampled units evenly across the map and have 12 days to conduct your sample survey in an area with 225 potential units. Calculate the spacing between each sampled unit and record it here. (Hint: Divide the total number of units on the map by the number of days available.)
Select a square to start on and mark it. Then count the number of spaces you need between each sampling unit as determined in question 1, moving to the right and down at the end of each row. Mark the next squares with your determined number of spaces in between until all 12 units have been accounted for.
Stratified Unaligned Systematic Sample
Divide your sampling area of 225 units horizontally into three equal units of five rows.
Use the random number and letter generator found at www.calculatorsoup.com/calculators/statistics/number-generator.php to obtain random letters and number combinations for each zones. Set your generator as follows and run it once for each column of the charts provided below.
For letters: sample size = 5 per zone, sample range = A–O. Be sure to allow duplicates and print the commas.
For numbers: sample size = 5 per zone, sample range = the row numbers indicated in the table below. Be sure to allow duplicates and print the commas.
Run each request separately and fill in your results below.
Zone 1 (rows 1–5)
Zone 2 (rows 6–10)
Zone 3 (rows 11–15)
Letters
Numbers
Letters
Numbers
Letters
Numbers
Next, check your combinations for any duplicate letter/number combinations and, if you find any, run the number and letter set generator again for each duplicate and replace the letter and number until there are no duplicates.
The completed table determines the 15 units (grid squares) that will be sampled with 5 randomly selected in each zone. Mark those squares as units to sample on your map.
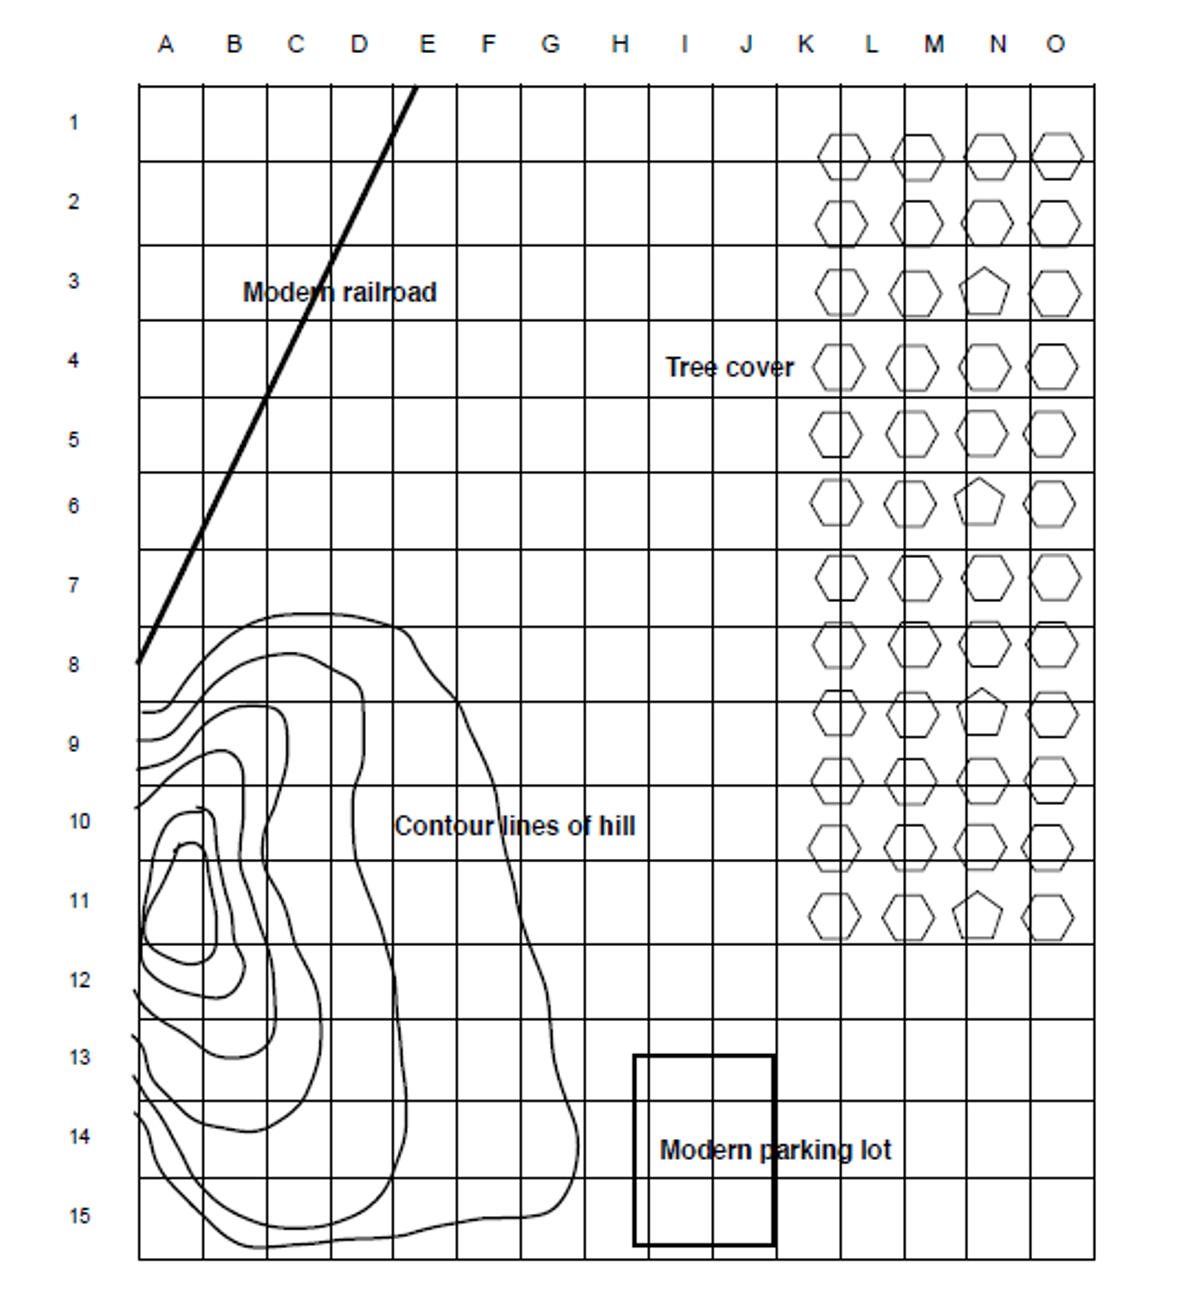
Site Map: Simple Random Sample
Figure \(\PageIndex{1}\)
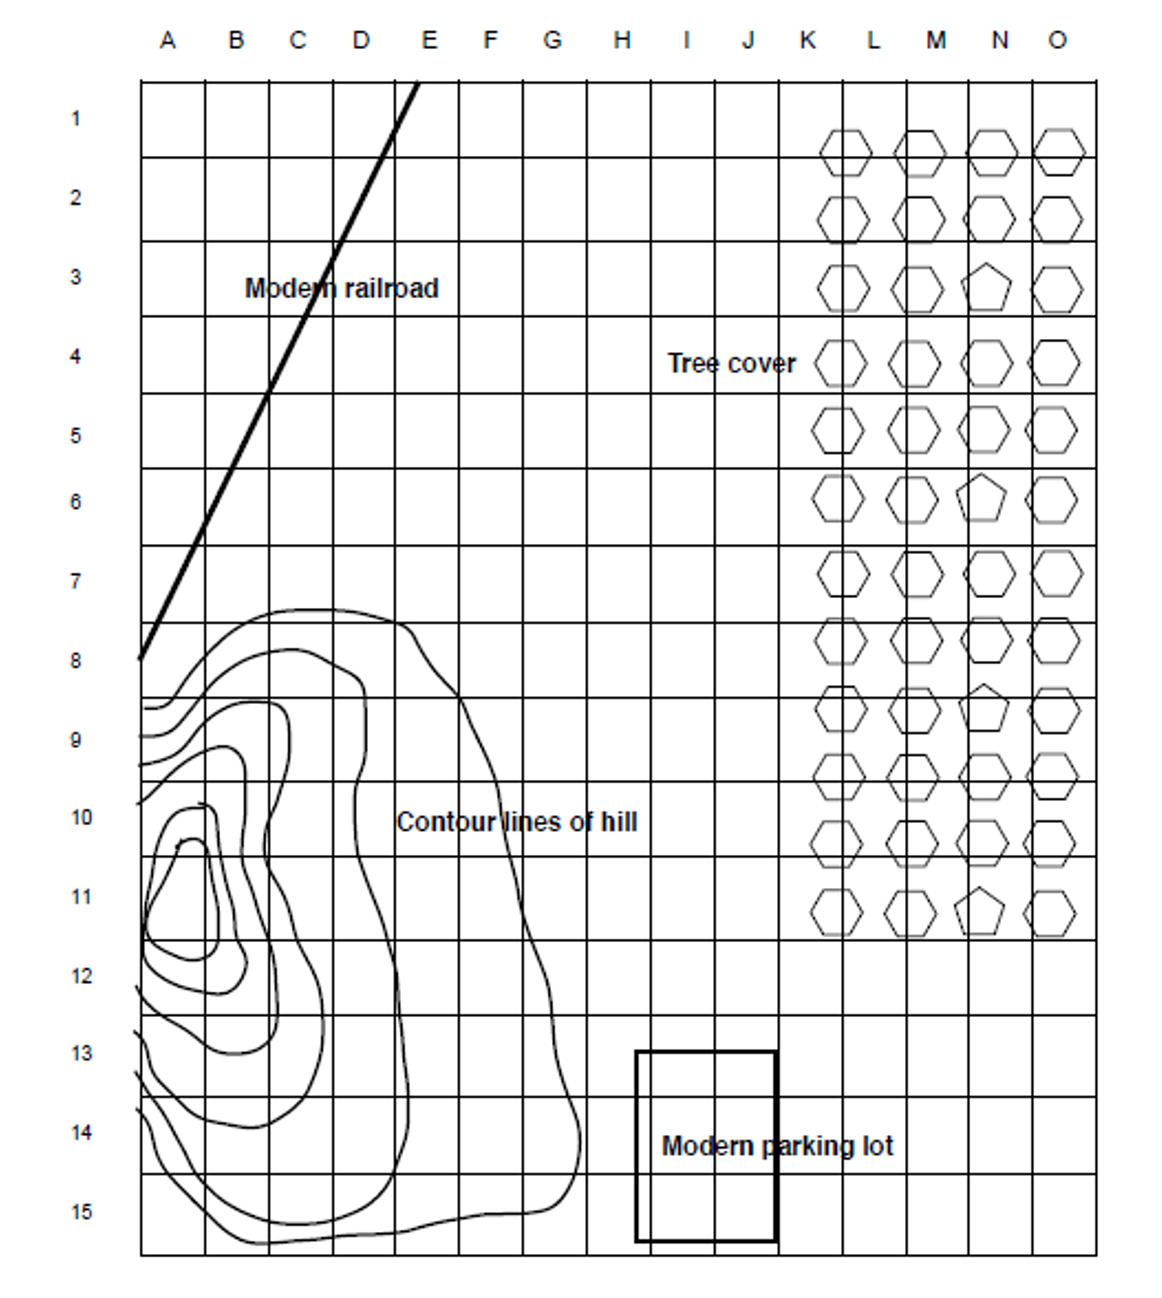
Site Map: Stratified Random Sample
Figure \(\PageIndex{2}\)
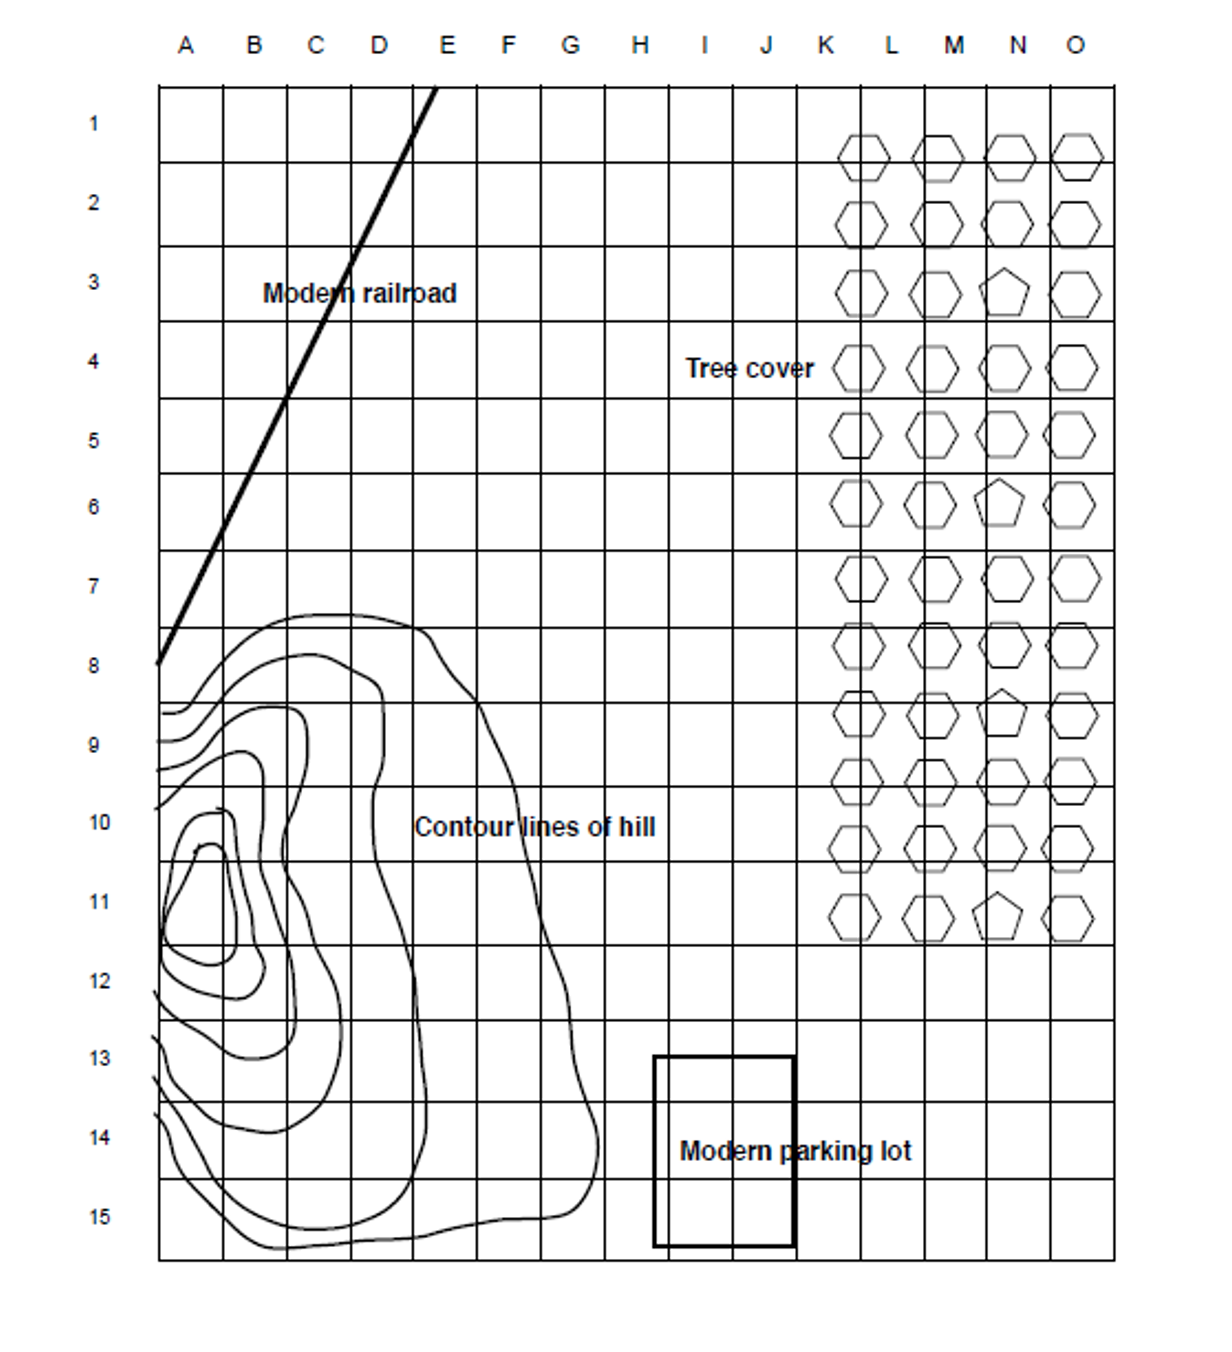
Site Map: Systematic Sample
Figure \(\PageIndex{3}\)
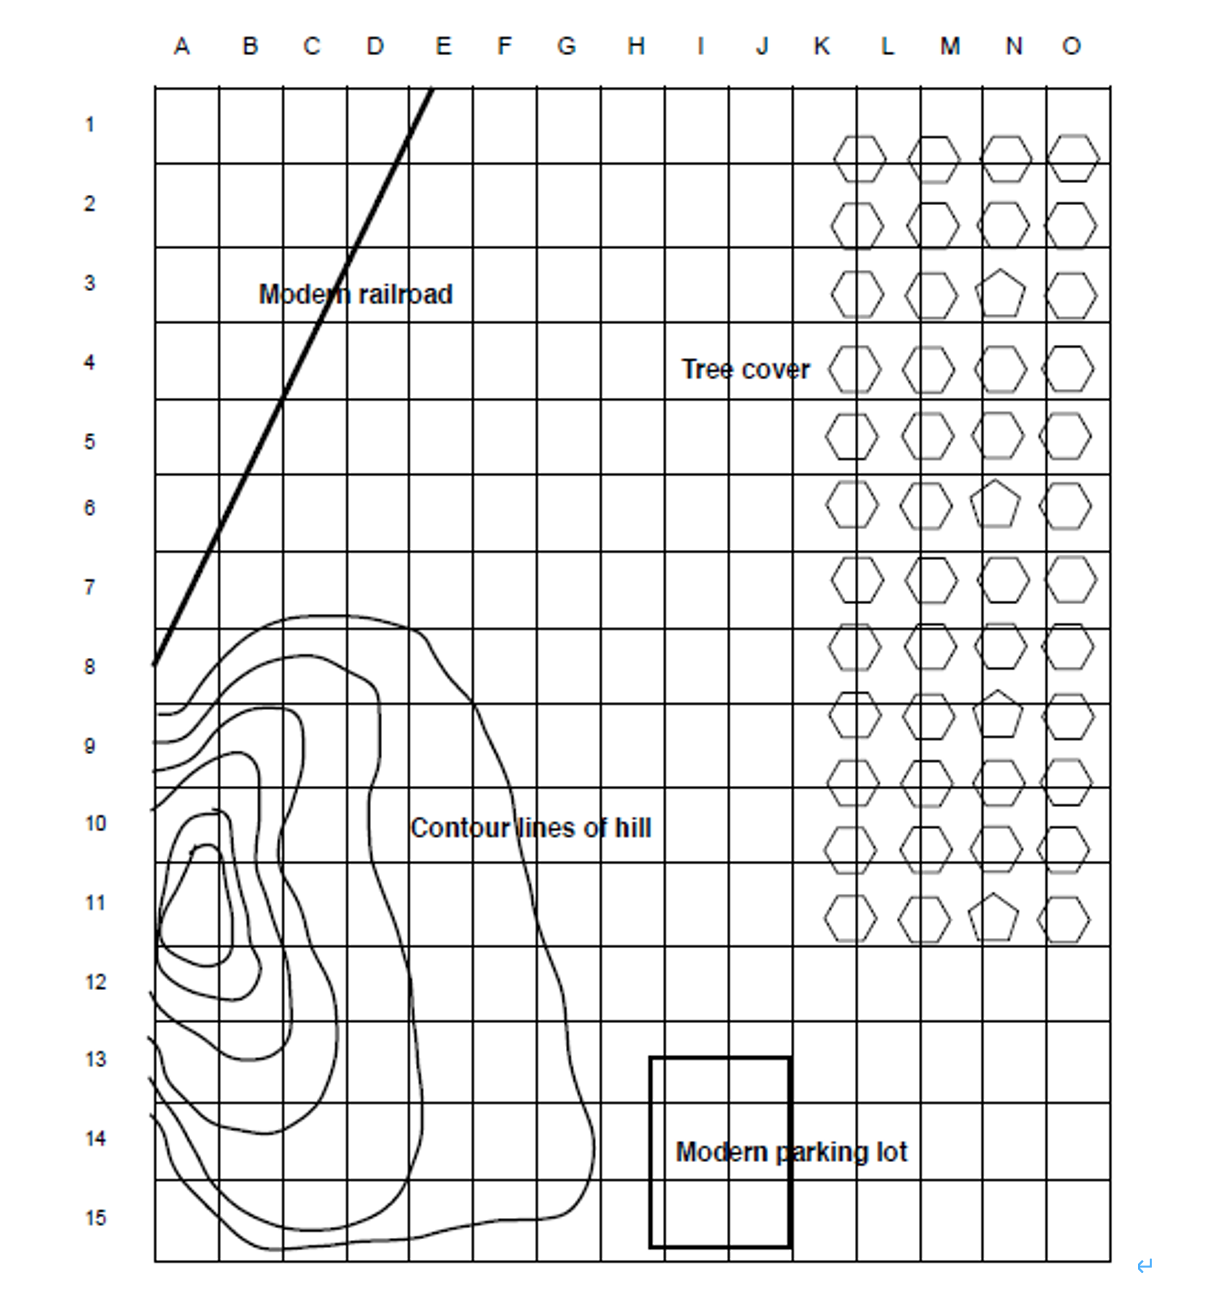
Site Map: Stratified Unaligned Systematic Sample
Figure \(\PageIndex{1}\): Position of Actors
Post-activity Questions
Appendix 2, which is provided at the end of this book, presents a map showing the archaeological data/objects present across the area covered by your map. Compare that key to the areas you surveyed and answer the following questions.
What types of archaeological data/objects did your survey discover? If you conducted more than one survey, describe your findings for each separately.
What time period(s) did your survey team detect at your site—was there evidence of an unbroken, continuous occupation by different groups or were there gaps in the archaeological record? If you conducted more than one survey, describe your findings for each separately.
What historic populations were underrepresented or were not represented in your survey? If you conducted more than one survey, describe your findings for each separately.
In reality, you would not have a “key” telling you all of the material that could be detected. In that situation, how would what you detected in your survey affect your understanding of the past at this site? If you conducted more than one survey, describe your findings for each separately.
Describe the benefits and drawbacks of the survey method(s) you used. Be prepared to share your answers with the class.