This chapter applies the consumer choice model to a real-world example. We will see that the model can be used to explain why someone would illegally sell food stamps. We also tackle an important policy question: If cash dominates food stamps, why not just help low-income people by giving them cash?
A Short History of Food Assistance in the United States
The primary responsibility for ensuring poor people (including children) in the United States have enough to eat lies with the Department of Agriculture (USDA). They run a program that enables low-income people to spend government-provided benefits on eligible food in stores.
The USDA’s web page, (www.fns.usda.gov/snap/short-history-snap), is the source of the information below. The Data and Research tab on the USDA’s website has usage and cost datathere are around 40 million participants and the program spends roughly $70 billion per year. This is one of the largest transfer programs in the fight against poverty. It offers critical support for low-income households.
The first Food Stamp Program, in 1939, was very different from today’s version. Originally, "the program operated by permitting people on relief to buy orange stamps equal to their normal food expenditures. For every $1 worth of orange stamps purchased, 50 cents worth of blue stamps were received. Orange stamps could be used to buy any food. Blue stamps could only be used to buy food determined by the Department to be surplus."
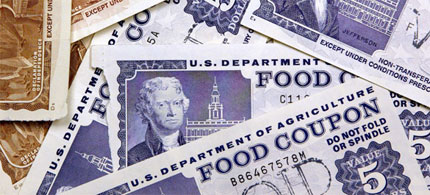
Important changes were made in the 1960s and, in 1977, the purchase requirement was eliminated. Households below the poverty line who met other criteria (such as work or study requirements) were eligible to receive food stamps. Figure 3.12 shows that these stamps were like paper currency; they were rectangular, but only about half the size of a dollar bill. There were different dollar denominations in a booklet. When buying food at the supermarket, the consumer tore out the stamp and paid for the food. They would pay for any non-food items with cash or a check.
Figure 3.12: Old US food stamps.
Source: Public domain file photo.
In 2008, it was renamed the Supplemental Nutrition Assistance Program (SNAP) to avoid stigma. It could be embarrassing to pay with food stamps since everyone in line immediately knew that you were receiving government assistance. Today, both names, food stamps and SNAP, are used.
SNAP has always been battered by politics, with benefits expanding and contracting depending on the rhetoric of the day. There are the usual arguments over administrative costs, but cheating on the part of recipients has been an especially contentious issue. In 2002, all states were required to use Electronic Benefits Transfer (EBT) cards. This was supposed to stop the illegal sale of food stamps (and reduce stigma), but fraud remains a focus of critics.
We can model and analyze food stamps with the Theory of Consumer Behavior. We will focus on how food stamps can be incorporated into the consumer’s optimization problem and why selling food stamps is so difficult to stop.
Food Stamp Theory
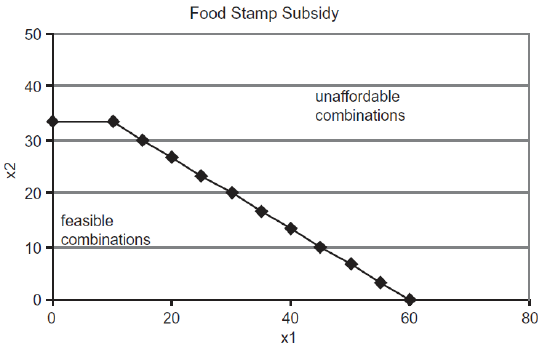
Recall from the Budget Constraint chapter that food stamps are a subsidy that produces a budget constraint with a horizontal segment, as shown in Figure 3.13. We use the \(x_1\) variable on the x axis to represent units of food. The \(x_2\) variable on the y axis captures all other goods lumped together. We get the flat part of the constraint because food stamps can be used to buy only food.
Figure 3.13: The budget constraint with food stamps.
Source: FoodStamps.xls!BudgetConstraint
STEPOpen the Excel workbook FoodStamp.xls and read the Intro sheet. Proceed to the BudgetConstraint sheet. Change cell E13 from 10 to 20.
Notice that the horizontal segment, which is the monetary value of the food stamps divided by the price of food, gets longer. Also notice that the chart on the right, showing the budget constraint if the food stamp amount was treated as cash, has no horizontal segment. In the chart on the right, the value of the food stamp subsidy is computed (xbar times price of food) and then added to income as if it were cash; hence the name, cash-equivalent subsidy.
It should be quite clear that the cash-equivalent subsidy provides consumption possibilities that are unattainable above the horizontal segment of the food stamp budget constraint. The most other goods the food stamp recipient can buy is \(33 \frac{1}{3}\) units, while the cash-equivalent consumer can buy 40 units of \(x_2\).
STEP Proceed to the Inframarginal sheet. It combines a food stamp budget constraint with a Cobb-Douglas utility function.
The word inframarginal (or submarginal) means below the edge or margin. The edge in this case is the kink in the budget constraint.
This consumer is inframarginal because his optimal solution is on the downward sloping part of the budget line, below the kink. He will use up his food stamp allotment on food and then spend some of his cash income to get additional food. The sheet reveals that he buys 35 units of food (valued at $70, as shown in cell B15), 20 of which he obtains with food stamps and the remaining 15 he buys with cash.
We can easily see that he is optimizing because the “MRS equals the price ratio” condition is met. This is reflected in the graph where the highest attainable indifference curve is just touching the budget constraint.
STEP Click on cell B25 to see the formula for the budget constraint.
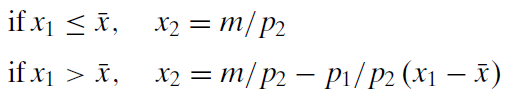
This formula is using an IF statement to implement the constraint in Excel. Expressed as an equation, the budget line looks like this:
The first equation says that if the consumer buys an amount of food that is less than or equal to xbar, that frees up his whole cash income to spend on good 2. This is the horizontal line component.
Things are more complicated if the consumer wants more than xbar of food. The second equation says that the consumer will have to use cash to buy amounts of \(x_1\) greater than xbar and it computes the amount of \(x_2\) that can be purchased as a function of \(x_1\).
This constraint (rewritten to equal zero) has been entered in a single cell with an IF statement:
The underscore (_) character is used in the variable names to distinguish them from cell addressese.g., p2_ is not cell P2.
From Excel’s Help on the IF function:
Returns one value if a condition you specify evaluates to TRUE and another value if it evaluates to FALSE.
Use IF to conduct conditional tests on values and formulas.
Syntax: IF(logical test,value if true,value if false)
Applying this information to the formula in cell B25, we can see that it has three parts, separated by commas. The first part says that if \(x_1 < x1bar\) (that is the condition being evaluated), then the consumer can buy \(m/p_2\) amount of \(x_2\) (this second part produces the horizontal line in the budget constraint), else (the third part is what happens if \(x_1\) is not less than x1bar) the consumer can buy \(x_2\) along the downward sloping part of the budget line.
This problem shows that Excel can be used to handle complicated examples in the Theory of Consumer Behavior. This food stamp problem has a kinked budget constraint, but using Excel’s IF statement allows us to implement the constraint in the workbook and use Solver to find the optimal solution.
This problem also can be solved via analytical methods, but it is cumbersome and difficult to deal with the kinked budget constraint. We will use the easier numerical approach to conduct our analysis.
STEP Proceed to the Distorted sheet.
This sheet is exactly the same as the Inframarginal sheet with one crucial exception: the preferences, in cells B21 and B22, are different. The consumer in the Distorted sheet prefers other goods more and food less than the consumer in the Inframarginal sheet.
The change in exponents in the Cobb-Douglas utility function has affected the indifference map. The curves are much flatter in the Distorted sheet compared with the Inframarginal sheet.
The Distorted sheet opens with the optimal values for food and other goods from the Inframarginal sheet. It is obvious that the MRS does not equal the price ratio and the indifference curve is cutting the budget constraint at the current bundle of \(x_1\) and \(x_2\). This consumer is not optimizing at this point.
Corner Solution
STEP Run Solver on the Distorted sheet.
Solver announces it has found the optimal solution, yet the MRS still does not equal the price ratio. Is this really the optimal solution? Yes, it is the optimal solution. We have encountered what is called a corner solution (or boundary optimum). In this case, the equimarginal condition, MRS \(= \frac{p_1}{p_2}\), does not hold because the optimal solution is found at one of the end points (or corners) of the constraint.
STEP To see what is happening here, copy the optimal solution from the Inframarginal sheet (copy cells B13 and B14) and paste in the Distorted sheet (select cells B13 and B14 and then paste).
The graph and MRS is immediately updated and you can see that the distorted consumer would not select the inframarginal consumer’s bundle. Which way should this consumer moveup or down the budget line? The graph makes clear that up is the right way to go, but you should notice that the marginal condition, MRS \(< \frac{p_1}{p_2}\), tells you the same thing.
STEP Click the button. Click a few more times and pay attention to the chart and the MRS in cell H26. Also keep an eye on utility in cell B9. Each click lowers the amount of \(x_1\) by one unit and increases the amount of \(x_2\) by \(\frac{2}{3}\).
By moving up the budget line, this consumer is improving her satisfaction and closing the gap between the MRS and the price ratio.
Do not be misled by the display – the indifference curves are not shifting. Remember that the indifference map is dense, meaning that every point has an indifference curve through it. We cannot draw in all of the indifference curves because the graph would then be solid black. The consumer is simply moving from one indifference curve to another one that was not previously displayed.
STEP Keep clicking the button. Eventually, you will hit the kink in the budget line and you will not be able to move northwest any longer. Instead, you will be on the horizontal segment and as you move strictly west, utility falls. Notice that the price ratio is now showing zero.
On the flat part of the budget line, when the amount of food purchased is less than or equal to how much food can be bought with food stamps alone, it makes sense that additional food is free, in terms of spending cash on food. The consumer simply has to use the available food stamps to acquire food and this does not reduce cash income.
Once you are on the flat part of the budget line, you should see that the graph and marginal condition point you to choosing more food.
STEP Click on the button repeatedly to move east and, eventually, down the budget line. Use the two buttons to crawl up and down until you find the bundle that maximizes utility.
You should end your travels at the kink – and MRS does not equal the price ratio there! This happens because the complicated constraint is producing a corner solution.
The distorted consumer wishes she could continue crawling up the downward sloping line, consuming less than the food stamp allotment of food and more of other goods, but she cannot do this. She cannot use food stamps to buy other goods. Thus, her best, or optimal, solution is at the kink.
In a corner solution, we accept that the "MRS equals the price ratio" condition is not met. We really are maximizing even though the MRS does not equal the price ratio. We have found the best we can do given the constraints on our choices.
Another way to explain what is happening is that we always want to minimize \(|MRS - \frac{p_1}{p_2}|\). With an interior solution, we can make this difference zero, but with a corner solution, we cannot because a constraint is preventing us from reaching MRS \(= \frac{p_1}{p_2}\). However, a corner solution does give us the lowest \(|MRS - \frac{p_1}{p_2}|\) value and we are doing the best we can at this solution.
Corner solutions are an important concept and we will see them again in future work. They arise whenever we are prevented from continuing to improve by going in a particular direction.
Cash Instead of Food Stamps
STEP Proceed to the Cash sheet. Notice that cell B24 computes the cash value of the food stamps and that the chart has a linear budget constraint with no kink. Click cell B25 to see that the constraint is the familiar income minus expenditures, with income equal to the sum of income plus the cash value of the food stamps.
The idea here is that instead of giving food stamps, we provide low-income people the cash-equivalent value. They are no longer constrained to buy food alone, but can purchase any goods with the cash received. The cash subsidy shifts the budget line out, with no kink or horizontal segment like we saw with the food stamp program.
The sheet opens with the inframarginal consumer’s optimal solution. It is the same as before, when she was given food stamps. Cash or food stamps are the same to this consumer.
STEP Click on the button to quickly apply the preferences for the distorted consumer. Run Solver.
With cash, the distorted consumer chooses an optimal bundle that is different from the one chosen under the Food Stamp Program. She finds an interior (as opposed to a corner) solution in the far northwest corner, which means she has opted for little food and more of other goods.
Figure 3.14 summarizes our work to this point. If you compare the inframarginal consumer, by looking top left and then bottom left, in Figure 3.14, you can easily see that there is no change in his behavior: $40 in food stamps versus $40 in cash are the same to this consumer.
On the other hand, comparing the top right and bottom right panels in Figure 3,14 reveals that the distorted consumer chooses less food and more other goods when given cash. This is why we say her choices are distorted by the food stamp program. If she had cash, she would make different choices. The distortion results in a decrease in satisfaction for this consumer.
Figure 3.14: Comparing food stamps versus cash-equivalent.
The Carte Blanche Principle and Deadweight Loss
Carte blanche, a term of obvious French origin (literally, “blank document”), means unconditional authority or freedom to act in any way you wish.
In economics, the Carte Blanche Principle means that cash is always as good as or better than in-kind. Cash allows the consumer to buy anything, while in-kind transfers, such as food stamps, restrict the set of choices.
Figure 3.14 shows the Carte Blanche Principle in action. Cash dominates food stamps. If you are an inframarginal consumer, the cash and food stamps are the same. This consumer is going to buy more food than can be purchased with the allotment of food stamps anyway so if you gave him the cash equivalent value, he would spend the cash on food.
If you are a distorted consumer, however, you are better off if you are given cash because cash can be used to buy the other goods that you prefer over food. With food stamps, when you maximize utility and do the best you can, you end up at a lower level of utility than if you had the cash-equivalent.
In economics, deadweight loss is a measure of inefficiency. It is a number that tells you how much a given solution differs from the best solution. In this application, deadweight loss is the difference in utility due to using food stamps instead of cash.
We could try to compute, for each consumer, the maximum utility with cash minus the maximum utility with food stamps. For the inframarginals, this number would be zero, but it would be positive for the distorted consumers.
Unfortunately, this approach would be exceedingly difficult to actually carry out. Even if we managed to do it, remember, we cannot simply add the utility values for different people. Utility is ordinal, ranking only by higher or lower, with no meaningful information about distance or magnitude. Thus, we can never add the utilities of different people.
Theory tells us deadweight loss exists, but the inability to make interpersonal utility comparisons means we are severely limited in how we can measure the sum of deadweight losses of two or more people. As a first pass, we can try to figure out how many distorteds and inframarginals there are. After all, if there are only a few distorted consumers, then we would know that food stamps were not affecting the decisions of too many people.
Whitmore describes two controlled experiments carried out by the USDA in the early 1990s. In the San Diego experiment, around 1,000 people who were receiving food stamps were randomly selected to participate in the experiment. Half were randomly assigned to the control group and given food stamps as usual, while the other half, the treatment group, were given cash-equivalent aid (checks).
Of the roughly 500 people given checks, about 100 were distortedthey bought less food compared to what they bought when they were given food stamps.
But what were these distorted consumers buying instead of food? This is a crucial question. Most economists are willing to let individuals choose what to buy because the Theory of Consumer Behavior is built on rational, optimizing decision making. The fundamental world view of economic theory is that individuals know best how to spend their money.
Others, however, argue that low-income consumers make poor decisions if left free to choose what to buy. They think distortion is a good thing because they want aid recipients to buy food. Whitmore (p. 3) says this:
To some, this distortion is the best part of the food stamp program: the government can ensure that needy families get enough to eat and that they don’t spend the money on other things. To others, this distortion represents a waste of resourcesit is inefficient to give in-kind transfers instead of cash.
At its most extreme, the issue can be stated this way: Taxpayers will support buying food for the poor, but not drugs, alcohol, and other wasteful consumption. But exactly how distorted consumers would spend cash is an empirical question and Whitmore has the data to answer it.
Researchers in the San Diego experiment kept careful food diaries. When Whitmore compared the purchases of the distorted treatment group to the food stamp control group, she found a marked decrease in a few specific items, like juice and soda, for distorteds. So, surprisingly,
Even though spending on food declines for the treatment group, the food diary data from San Diego provide no firm evidence that cashing-out food stamps leads to declines in nutritional intake, and suggest that it may actually reduce extreme over-consumption of calories, an important contributing factor to obesity. (Whitmore, p. 35)
The picture that many have of the indigent as drug addicts or exceptionally poor decision makers is unsupported by Whitmore’s data. It is true that if forced to spend a subsidy on food, low-income households will spend more on food, but that does not imply that this is better. By definition, low-income people are struggling with paying for, not just food, but a whole host of necessities, including shelter, clothing, transportation, and utility bills. A cash-equivalent subsidy means they can buy food if that is the greatest need or make other important purchases.
The Illegal Sale of Food Stamps
The Theory of Consumer Behavior can be used to explain what most people find puzzling when they first hear about itthere is an active, illegal market in food stamps. Whitmore (p. 4) estimated that food stamps sold for 61 cents on the dollar. The theory can also explain why it has proven incredibly difficult to stop the illegal sale of food stamps.
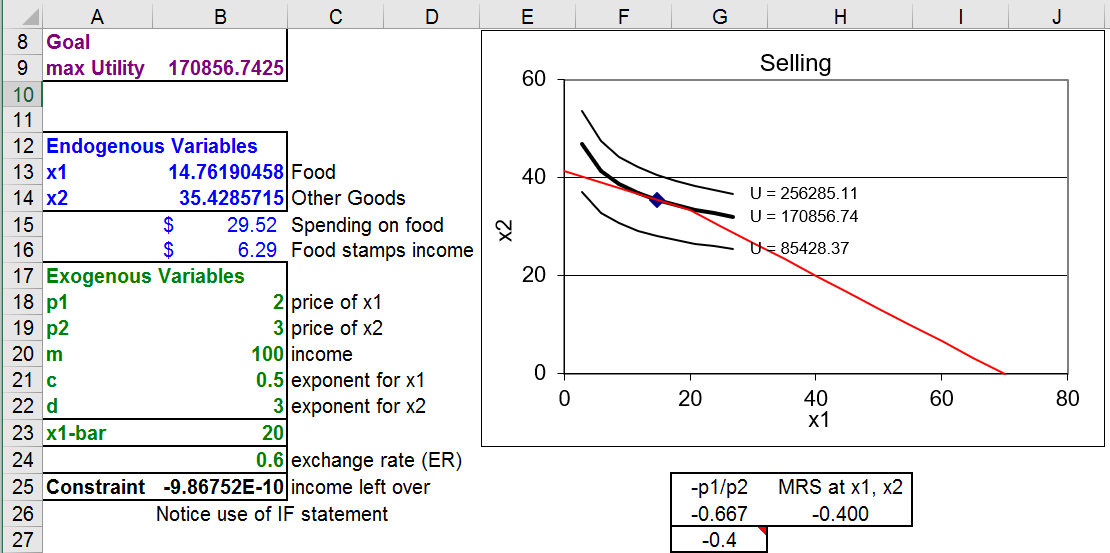
STEP Proceed to the Selling sheet.
Observe that the budget constraint has been modified yet again. The segment below the food stamp allotment (x1bar) is no longer horizontal. We have enabled the consumer to sell food stamps and move up the budget constraint.
The slope of this portion of the budget constraint is \(ER*p_1/ p_2\),where ER is the exchange rate of food stamps for cash. With ER initially set at 0.6 (in cell B24), a seller of food stamps would get 60 cents for every dollar of food stamps sold. The slope of the budget line is 60% of the \(p_1/p_2\) ratio or 1.2.
Notice that cell B16 has been added and it reports the income generated by the sale of food stamps. It shows zero because the opening position is at the kink (20, 33.33) so this distorted consumer isn’t selling any food stamps.
STEP Change cell B13 to 10 and watch how the cells and the chart change.
B16 now reports that the consumer is making $12 from the sale of food stamps. They "sold" ten units of food, valued at $20 in cash, but only 60% of that in food stamps. With \(p_2 = 3\), she can buy four more units of \(x_2\).
STEP Set cell B14 to 37.33 to move the consumer to the budget line.
But is this is the optimal solution? In fact, comparing cell G27 to H26 tells you that it is not. The consumer is selling too many food stamps at this point.
STEP Run Solver. You should get a result like Figure 3.15, which shows the consumer choosing just under 15 units of food and adding $6.29 of food stamp income (explaining how they managed to buy more than \(33 \frac{1}{3}\) units of \(x_2\)). Notice also that, once again, the MRS (-0.4) equals the slope of the budget constraint (-0.4) on the relevant part of the budget line.
Figure 3.15: Maximizing utility by selling food stamps.
Source: FoodStamps.xls!Selling
The consumer maximizes utility and reaches a higher level of satisfaction than what is attainable by staying on the kink and not selling the food stamps. The ability to get higher satisfaction explains the unintended consequence of an active illegal trade in food stamps.
This analysis does not incorporate the costs of selling food stamps, including the risk of getting caught. There is no doubt that EBT cards make it more difficult to sell food stamps, but the inability to stop the illegal trade testifies to the forces at playthe search for higher satisfaction is powerful indeed.
One Last Question
If the Carte Blanche Principle is true, then why does the government use food stamps instead of cash to help the poor?
Whitmore devotes the conclusion of her paper (p. 38) to answering this question:
A crucial aspect of the success of the Food Stamp Program is its political popularity. The Food Stamp Program is not an entitlement program, so its budget must be approved annually in the Farm Bill. The program’s budget has always been fully funded, due largely to two factors: its popularity as a targeted welfare program among voters, and its popularity among farmers because they think it increases demand for food. (footnote omitted)
As a practical matter, it is not true that, in general, the poor will squander cash subsidies or make terrible buying decisions. Giving aid in the form of food stamps generates a deadweight loss for those distorted consumers who would have been better off with cash. As Whitmore points out, however, it is politically impossible to imagine what is today a $70 billion program being funded annually as a pure cash giveaway. Economics meets politics and the result is a flawed, but functioning anti-poverty program.
Exercises
Which parameter in the Selling sheet, with the exchange rate set to 0.9, would have to be changed to represent the case of a distorted consumer who decides not to sell food stamps for cash? What would the value of this parameter be?
Explain under what condition the MRS equals the price ratio rule (as a condition that the optimal solution has been found) can be violated.
A seller of food stamps would obviously prefer a higher price, but what would be the advantage of a higher price in terms of the Theory of Consumer Behavior?
References
The epigraph comes from the first paragraph of Stigler and Becker’s “De Gustibus Non Est Disputandum,” The American Economic Review, Vol. 67, No. 2 (March, 1977), pp. 76 - 90 (www.jstor.org/stable/1807222). The title is a Latin admonition to not quarrel over tastesdo not continue arguing once you pass the point of rational persuasion (similar to "Let’s agree to disagree.").
Stigler and Becker offer, however, a second interpretation, which they prefer: "tastes neither change capriciously nor differ importantly between people." Their key point is this:
The difference between these two viewpoints of tastes is fundamental. On the traditional view, an explanation of economic phenomena that reaches a difference in tastes between people or times is the terminus of the argument: the problem is abandoned at this point to whoever studies and explains tastes (psychologists? anthropologists? phrenologists? sociobiologists?). On our preferred interpretation, one never reaches this impasse: the economist continues to search for differences in prices or incomes to explain any differences or changes in behavior. (p. 76)
The idea that tastes are stable and differences in behavior are to be found in price or income shocks is a hallmark of Chicago School economics.
Diane Whitmore’s working paper, “What Are Food Stamps Worth?,” is available at arks.princeton.edu/ark:/88435/dsp01z603qx42c. Whitmore goes beyond simply counting the number of distorted consumers and offers estimates of deadweight loss.
For more recent work, see Hillary Hoynes and Diane Whitmore Schazenbach, "Consumption Responses to In-Kind Transfers: Evidence from the Introduction of the Food Stamp Program," American Economic Journal: Applied Economics, Vol. 1, No. 4 (October 2009), pp. 109 - 139, available at www.jstor.org/stable/25760184.


 button. Click a few more times and pay attention to the chart and the MRS in cell H26. Also keep an eye on utility in cell B9. Each click lowers the amount of \(x_1\) by one unit and increases the amount of \(x_2\) by \(\frac{2}{3}\).
 button. Eventually, you will hit the kink in the budget line and you will not be able to move northwest any longer. Instead, you will be on the horizontal segment and as you move strictly west, utility falls. Notice that the price ratio is now showing zero.
 button repeatedly to move east and, eventually, down the budget line. Use the two buttons to crawl up and down until you find the bundle that maximizes utility.
 button to quickly apply the preferences for the distorted consumer. Run Solver.
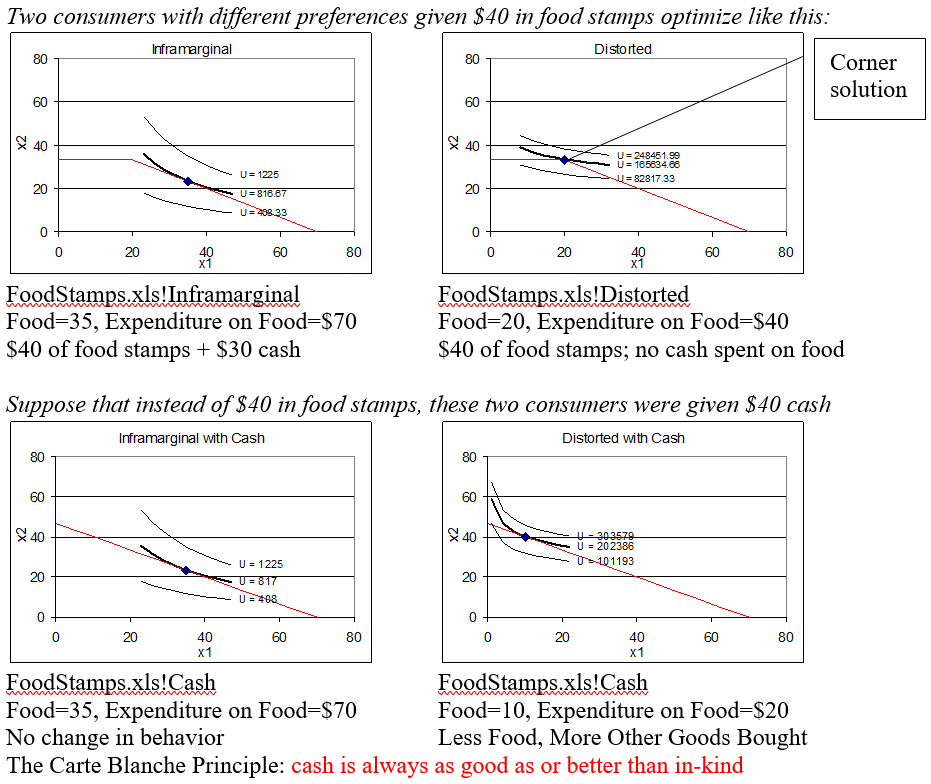 Figure 3.14: Comparing food stamps versus cash-equivalent.