Using a numerical example similar to one used by David Ricardo, learn how specialization in one’s comparative advantage good can raise world productive efficiency.
Learn how both countries can consume more of both goods after trade.
The simplest way to demonstrate that countries can gain from trade in the Ricardian model is by use of a numerical example. This is how Ricardo presented his argument originally. The example demonstrates that both countries will gain from trade if they specialize in their comparative advantage good and trade some of it for the other good. We set up the example so that one country (the United States) has an absolute advantage in the production of both goods. Ricardo’s surprising result was that a country can gain from trade even if it is technologically inferior in producing every good. Adam Smith explained in The Wealth of Nations that trade is advantageous to both countries, but in his example each country had an absolute advantage in one of the goods. That trade could be advantageous if each country specializes in the good in which it has the technological edge is not surprising at all.
Suppose the exogenous variables in the two countries take the values in Table \(\PageIndex{1}\).
\(L\) = the labor endowment in the United States (the total number of hours the workforce is willing to provide)
\(a_{LC}\) = unit labor requirement in cheese production in the United States (hours of labor necessary to produce one unit of cheese)
\(a_{LW}\) = unit labor requirement in wine production in the United States (hours of labor necessary to produce one unit of wine)
* All starred variables are defined in the same way but refer to the process in France.
By assumption, the United States has the absolute advantage in cheese production and wine production because \(a_{LC}(1) < a_{LC}^*(6)\) and \(a_{LW} (2) < a_{LW}^*(3)\).
The United States also has the comparative advantage in cheese production because \( \frac{a_{LC}}{a_{LW}} \left(\frac{1}{2} \right) < \frac{a_{LC}^*}{a_{LW}^*} \left( \frac{6}{3} \right) \). The cost of producing cheese in the United States is one half gallon of wine per pound of cheese. In France, it is two gallons per pound.
France, however, has the comparative advantage in wine production because \( \frac{a_{LW}^*}{a_{LC}^*} \left( \frac{3}{6} \right) < \frac{a_{LW}}{a_{LC}} \left( \frac{2}{1} \right) \). The cost of producing wine in France is one half pound of cheese per gallon of wine, while in the United States, it is two pounds per gallon.
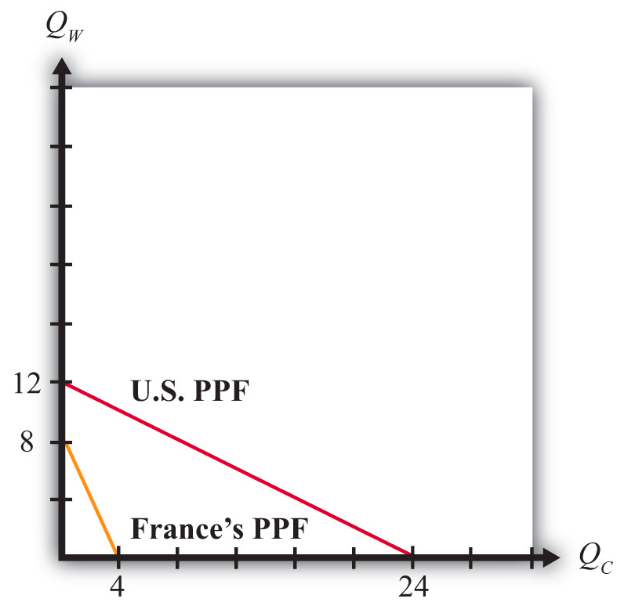
The production possibility frontiers for both countries are plotted on Figure \(\PageIndex{1}\). Notice that the U.S. PPF lies outside France’s PPF. Since both countries are assumed to be the same size in the example, this indicates the U.S. absolute advantage in the production of both goods.
The absolute value of the slope of each PPF represents the opportunity cost of cheese production. Since the U.S. PPF is flatter than France’s, this means that the opportunity cost of cheese production is lower in the United States and thus indicates that the United States has the comparative advantage in cheese production.
Figure \(\PageIndex{1}\): Production Possibility Frontiers
With full employment of labor, production will occur at some point along the PPF.
To see the effects of specialization and free trade, we must compare it to a situation of no trade, or autarky. Thus we must construct an autarky equilibrium first. To determine the autarky production point requires some information about the consumer demand for the goods. Producers will produce whatever consumers demand at the prevailing prices such that supply of each good equals demand. In autarky, this means that the production and consumption point for a country are the same.
For the purpose of this example, we will simply make up a plausible production and consumption point under autarky. Essentially, we assume that consumer demands are such as to generate the chosen production point. Table \(\PageIndex{2}\) shows the autarky production and consumption levels for the two countries. It also shows total world production for each of the goods.
Table \(\PageIndex{2}\): Autarky Production and Consumption
Cheese (lbs.)
Wine (gals.)
United States
16
4
France
3
2
World Total
19
6
Autarky Production and Consumption Points
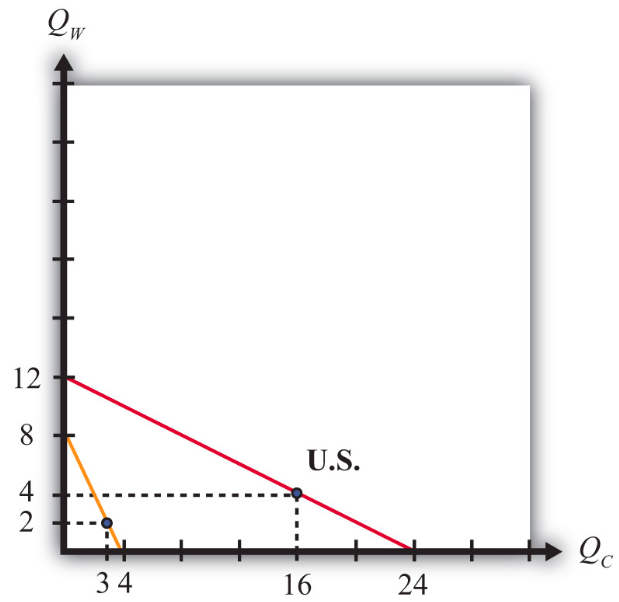
In Figure \(\PageIndex{2}\) we depict the autarky production and consumption points for the United States and France. Each point lies on the interior section of the country’s production possibility frontier.
Question: How do you know that the chosen production points are on the country’s PPF?
Answer: To verify that a point is on the PPF, we can simply plug the quantities into the PPF equation to see if it is satisfied. The PPF formula is \(a_{LC}Q_C + a_{LW}Q_W = L \). If we plug the exogenous variables for the United States into the formula, we get \(Q_C + 2Q_W = 24\). Plugging in the production point from Table \(\PageIndex{2}\) yields \(16 + 2(4) = 24\), and since \(16 + 8 = 24\), the production point must lie on the PPF.
Ricardo argued that trade gains could arise if countries first specialized in their comparative advantage good and then traded with the other country. Specialization in the example means that the United States produces only cheese and no wine, while France produces only wine and no cheese. These quantities are shown in Table \(\PageIndex{3}\). Also shown are the world totals for each of the goods.
Figure \(\PageIndex{2}\): Autarky Equilibriums
Table \(\PageIndex{3}\): Production with Specialization in the Comparative Advantage Good
Cheese (lbs.)
Wine (gals.)
United States
24
0
France
0
8
World Total
24
8
At this point, we can already see a remarkable result. When countries specialize in their comparative advantage good, world output of both wine and cheese rises. Cheese output rises from nineteen to twenty-four pounds. Wine output rises from six to eight gallons. What’s more, the output increases occur without an increase in the quantity of labor used to produce them. In autarky, it took forty-eight worker hours to produce nineteen pounds of cheese and six gallons of wine. With specialization, the same forty-eight worker hours produce twenty-four pounds of cheese and eight gallons of wine. This means that there is an increase in world productivity—more output per unit of labor. Often this productivity improvement is referred to as an increase or improvement in world production efficiency.
The increase in world production efficiency does not benefit the countries unless they can trade with each other after specialization. Both production points were feasible under autarky, but the countries demanded some of each good. Thus the countries will want some of each good after specialization, and the only way to accomplish this is through trade. Now if the world can produce more of both goods through specialization, clearly there must be a way to divide the surplus between the two countries so that each country ends up with more of both goods after trade than it had in autarky.
The surplus in world production amounts to five extra pounds of cheese and two extra gallons of wine. To assure that trade is advantageous for the two countries, each must have at least as much to consume of one good and more to consume of the other. Suppose we split the wine surplus equally and give three extra pounds of cheese to France and two extra pounds to the United States. Since the United States consumed sixteen pounds of cheese and four gallons of wine in autarky, it would now have eighteen pounds of cheese and five gallons of wine after specialization and trade. France, which began with three pounds of cheese and two gallons of wine in autarky, would now have six pounds of cheese and three gallons of wine. Consumption and production after trade for the two countries is shown in Table \(\PageIndex{4}\).
Table \(\PageIndex{4}\): Consumption and Production after Trade
Country
Cheese (lbs.)
Wine (gals.)
Consumption
Production
Consumption
Production
United States
18
24
5
0
France
6
0
3
8
World Total
24
24
8
8
In order for consumption of both goods to be higher in both countries, trade must occur. In the example, the United States is consuming five gallons of wine and producing none, so it must import the five gallons from France. France is consuming six pounds of cheese with no cheese production, so it must import the six pounds from the United States. The terms of trade is TOT = 5 gals./6 lbs., or 5/6 gals./lb.
Exercise Conclusion
The Ricardian model numerical example assumes that countries differ in their production technologies such that one of the countries is absolutely more productive than the other in the production of each of the two goods. If these two countries specialize in their comparative advantage good, then world production rises for both goods. Increased output occurs even though there is no increase in the amount of labor input in the world; thus the example demonstrates that specialization can raise world production efficiency. Because of the increase in output, it is possible to construct a terms of trade between the countries such that each country consumes more of each good with specialization and trade than was possible under autarky. Thus both countries can gain from trade. The surprising result of this example is that a country that is technologically inferior to another in the production of all goods can nevertheless benefit from trade with that country.
Limitations of the Numerical Example
A numerical example can display only one possible outcome for the model. As such, all conclusions should be viewed as possibilities rather than general results of the model. With further thought, there are some problems with the example. First, it is conceivable that with a different choice for the country’s autarky production and consumption points, world output might not rise for both goods upon specialization. In this case, we could not be sure that both countries would gain from trade. Second, since we merely made up a terms of trade that generated the interesting conclusion, we could ask whether a favorable terms of trade is likely to arise. Is it possible to make up a different terms of trade such that one country enjoys all the benefits of increased production while the other is made worse off? How can we be sure that this outcome would not arise? Finally, even if the country has more of both goods after trade, can we be sure that all consumers would have more of both goods? Perhaps some consumers would have more and others less.
The answer to some of these questions can be found by describing more carefully some of the features of the model. In particular, we must describe the relationship between prices and wages. Using these relationships, we can explain the impact of free trade on the price ratio and the effect of trade on the distribution of income.
KEY TAKEAWAYS
In a two-country, two-good, one-factor Ricardian model, specialization in each country’s comparative advantage good can raise world output of both goods.
An increase in world output given the same level of inputs is called an increase in world productive efficiency.
By choosing an appropriate terms of trade, both countries can consume more of both goods relative to autarky.
Exercise \(\PageIndex{1}\)
Consider a Ricardian model with two countries, the United States and the EU, producing two goods, soap bars and toothbrushes. Suppose the productivities are \(a_{LS}^{US} = 2\) soap bars per worker, \(a_{LS}^E = 4\) soap bars per worker, \(a_{LT}^{US} = 8\) toothbrushes per worker, and \(a_{LT}^E = 4\) toothbrushes per worker. Assume the United States has 3,200 workers and the EU has 4,000 workers.
Plot the PPFs for both countries.
Determine how much each country would produce if it specialized in its comparative advantage good.
Now choose a plausible autarky production point on each country’s PPF such that the world output of each good is exceeded by the outputs determined in part b.
Determine a terms of trade between the two countries that will assure that both countries can consume more of both goods after trade.