The Law of Supply
The law of supply states that there is a positive relationship between the quantity that suppliers are willing to sell and the price level.
Learning objectives
Explain the Law of Supply
The law of supply is a fundamental principle of economic theory. It states that an increase in price will result in an increase in the quantity supplied, all else held constant.
An upward sloping supply curve, which is also the standard depiction of the supply curve, is the graphical representation of the law of supply. As the price of a good or service increases, the quantity that suppliers are willing to produce increases and this relationship is captured as a movement along the supply curve to a higher price and quantity combination.
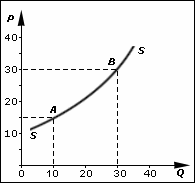
The Law of Supply: Supply has a positive correlation with price. As the market price of a good increases, suppliers of the good will typically seek to increase the quantity supplied to the market.
The rationale for the positive correlation between price and quantity supplied is based on the potential increase in profitability that occurs with an increase in price.
All else held constant, including the costs of production inputs, the supplier will be able to increase his return per unit of a good or service as the price for the item increases. Therefore, the net return to the supplier increases as the spread or difference between the price and the cost of the good or service being sold increases.
The law of supply in conjunction with the law of demand forms the basis for market conditions resulting in a price and quantity relationship at which both the price to quantity relationship of suppliers and demanders (consumers) are equal. This is also referred to as the equilibrium price and quantity and is depicted graphically at the point at which the demand and supply curve intersect or cross one another. It is the point where there is no surplus or shortage in the market.
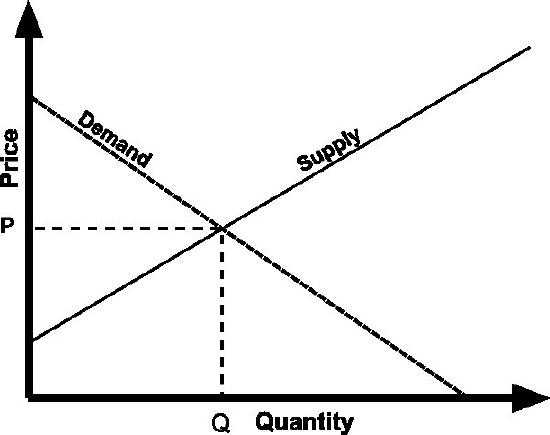
Law of Supply and Law of Demand: Equilibrium: The law of supply and the law of demand form the foundation for the establishment of an equilibrium–where the price to quantity combination for both suppliers and demanders are the same.
Supply Schedules and Supply Curves
A supply schedule is a tabular depiction of the relationship between price and quantity supplied, represented graphically as a supply curve.
Learning objectives
Explain the price to quantity relationship exhibited in the supply curve
Supply is the amount of some product that producers are willing and able to sell at a given price, all other factors being held constant. In general, supply depicts a positive relationship between the price of a good or service and the quantity that the producer is willing to supply: if a supplier believes it can sell the product for more, it will want to make more of the product. As a result, as the price of a good or service increases, suppliers increase the quantity available for purchase.
A supply schedule is a table that shows the relationship between the price of a good and the quantity supplied. The supply curve is a graphical depiction of the supply schedule that illustrates that relationship between the price of a good and the quantity supplied.

The Supply Schedule and Supply Curve: The supply curve is a graphical depiction of the price to quantity pairings presented in a supply schedule. The supply schedule is a table view of the relationship between the price suppliers are willing to sell a specific quantity of a good or service.
The supply curves of individual suppliers can be summed to determine aggregate supply. One can use the supply schedule to do this: for a given price, find the corresponding quantity supplied for each individual supply schedule and then sum these quantities to provide a group or aggregate supply. Plotting the summation of individual quantities per each price will produce an aggregate supply curve.
In theory, in the long run the aggregate supply curve will not be upward sloping but will instead be vertical, consistent with a fixed supply level. This is due to the underlying assumption that in the long run, supply of a good only depends on the fixed level of capital, technology, and natural resources available.
The supply curve provides one side of the price-to-quantity relationship that ensures a functional market. The other component is demand. When the supply and demand curves are graphed together they will intersect at a point that represents the market equilibrium – the point where supply equals demand and the market clears.
Market Supply
Market supply is the summation of the individual supply curves within a specific market where the market is characterized as being perfectly competitive.
Learning objectives
Identify the market conditions that yield a market supply curve.
A supply curve is the graphical representation of the supplier’s positive correlation between the price and quantity of a good or service. As a result, the supply curve is upward sloping. Market supply is the summation of the individual supply curves within a specific market.
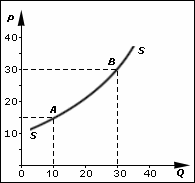
Market Supply: The market supply curve is an upward sloping curve depicting the positive relationship between price and quantity supplied.
The market supply curve is derived by summing the quantity suppliers are willing to produce when the product can be sold for a given price. As a result, it depicts the price to quantity combinations available to consumers of the good or service. In combination with market demand, the market supply curve is requisite for determining the market equilibrium price and quantity.
By its very nature, conceptualizing a supply curve requires the firm to be a perfect competitor, namely requires the firm to have no influence over the market price. This is true because each point on the supply curve is the answer to the question “If this firm is faced with this potential price, how much output will it be able to and willing to sell? ” If a firm has market power, its decision of how much output to provide to the market influences the market price, then the firm is not “faced with” any price, and the question is meaningless.
The attributes of a competitive market signal that the price is set external to any firm. Therefore, production in the market is a sliding scale dependent on price. As price increases, quantity increases due to low barriers to entry, and as the price falls, quantity decreases as some firms may even opt out of the market.
The supply curve can be derived by compiling the price-to-quantity relationship of a seller. A seller could set the price of a good or service equal to zero and then incrementally increase the price; at each price he could calculate the hypothetical quantity he would be willing to supply. Following this process the seller would be able to trace out its complete individual supply function. The market supply curve is simply the sum of every seller’s individual supply curve.
Determinants of Supply
Supply levels are determined by price, which increases or decreases supply along the price curve, and non-price factors, which shifts the entire curve.
Learning objectives
Identify the factors that affect the supply of a good
Supply is the quantity of a good or service that a supplier provides to the market. Innumerable factors and circumstances could affect a seller’s willingness or ability to produce and sell a good. Some of the more common factors are:
- Good’s own price: An increase in price will induce an increase in the quantity supplied.
- Prices of related goods: For purposes of supply analysis, related goods refer to goods from which inputs are derived to be used in the production of the primary good.
- Conditions of production: The most significant factor here is the state of technology. If there is a technological advancement related to the production of the good, the supply increases.
- Expectations: Sellers’ expectations concerning future market conditions can directly affect supply.
- Price of inputs: If the price of inputs increases the supply curve will shift left as sellers are less willing or able to sell goods at any given price. Inputs include land, labor, energy and raw materials.
- Number of suppliers: As more firms enter the industry the market supply curve will shift out driving down prices. The market supply curve is the horizontal summation of the individual supply curves.
- Government policies and regulations: Government intervention can take many forms including environmental and health regulations, hour and wage laws, taxes, electrical and natural gas rates and zoning and land use regulations. These regulations can affect a good’s supply.
Suppliers will change their production levels along the supply curve in response to a price change, so that their production level is equal to demand. However, some factors unrelated to price can shift the production level. For example, a technological improvement that reduces the input cost of a product will shift the supply curve outward, allowing suppliers to provide a greater supply at the same price level.
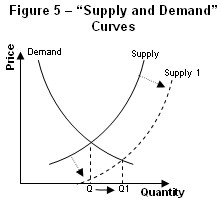
Determinants of Supply: If the price of a good changes, there will be movement along the supply curve. However, the supply curve itself may shift outward or inward in response to non-price related factors that affect the supply of a good, such as technological advances or increased cost of materials.
Changes in Supply and Shifts in the Supply Curve
The supply curve depicts the supplier’s positive relationship between price and quantity.
Learning objectives
Distinguish between shifts in the supply curve and movement along the supply curve
Price changes and movement along supply curve
If the price of the good or service changes, all else held constant such as price of substitutes, the supplier will adjust the quantity supplied to the level that is consistent with its willingness to accept the prevailing price. The change in price will result in a movement along the supply curve, called a change in quantity supplied, but not a shift in the supply curve. Changes in supply are due to non-price changes.
Non-price changes and shifts of the supply curve
If production costs increase, the supplier will face increasing costs for each quantity level. Holding all else the same, the supply curve would shift inward (to the left), reflecting the increased cost of production. The supplier will supply less at each quantity level.
If production costs declined, the opposite would be true. Lower costs would result in an increase in output, shifting the supply curve outward (to the right) and the supplier will be willing sell a larger quantity at each price level. The supply curve will shift in relation to technological improvements and expectations of market behavior in very much the same way described for production costs.
Technological improvements that result in an increase in production for a set amount of inputs would result in an outward shift in supply.
Supply will shift outward in response to indications of heightened consumer enthusiasm or preference and will respond by shifting inward if there is an assessment of a negative impact to production costs or demand.
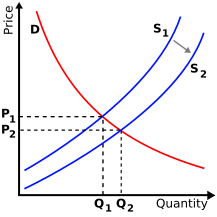
Supply Shifts: A shift in supply from S1 to S2 affects the equilibrium point, and could be caused by shocks such as changes in consumer preferences or technological improvements.
Key Points
- Quantity supplied moves in the same direction as price.
- The supply curve is an upward sloping curve.
- Producers are willing to increase production at higher prices to increase profit.
- The supply curve plots the quantity that is willingly supplied at any given price.
- The individual supply curves can be summed by quantity provided at a specific price to achieve an aggregate supply curve.
- The supply curve is upward sloping in the short run.
- A supply curve is the graphical representation of the supplier’s positive correlation between the price and quantity of a good or service.
- The supply curve can only be attributed to a depiction of a perfectly competitive market due to the unique attributes of perfect competition: firms are price takers, no single firm’s actions can influence the market price, and ease of exit and entry.
- The market supply curve is derived by summing the quantity for a given price across all market participants (suppliers). It depicts the price-to-quantity combinations available to consumers of the good or service.
- Supply is the quantity of a good or service that a supplier provides to the market.
- Suppliers will shift production for non- price changes related to the determinants of supply and will slide production levels across the supply curve for price related movements.
- Innumerable factors and circumstances could affect a seller’s willingness or ability to produce and sell a good.
- A change in the price of a good or service, holding all else constant, will result in a movement along the supply curve.
- A change in the cost of an input will impact the cost of producing a good and will result in a shift in supply; supply will shift outward if costs decrease and will shift inward if they increase.
- A change in the expected demand for a good or service will result in a shift in supply; supply will shift outward if enthusiasm is expected to increase and will shift inward if there is an expectation for consumers preferences to change in favor of an alternate good or service.
Key Terms
- surplus: That which remains when use or need is satisfied, or when a limit is reached; excess; overplus.
- shortage: a lack or deficiency
- equilibrium: The condition of a system in which competing influences are balanced, resulting in no net change.
- aggregate: A mass, assemblage, or sum of particulars; something consisting of elements but considered as a whole.
- equilibrium: The condition of a system in which competing influences are balanced, resulting in no net change.
- Supply curve: A graphical representation of the quantity producers are willing to make when the product can be sold at a given price.
- intervention: The action of interfering in some course of events.
- incentive: Something that motivates, rouses, or encourages.
- Non-price changes: Shocks, either exogenous or endogenous, that affect the positioning of the supply curve.
LICENSES AND ATTRIBUTIONS
CC LICENSED CONTENT, SPECIFIC ATTRIBUTION
- Law of supply. Provided by: Wikipedia. Located at: en.Wikipedia.org/wiki/Law_of_supply. License: CC BY-SA: Attribution-ShareAlike
- shortage. Provided by: Wiktionary. Located at: en.wiktionary.org/wiki/shortage. License: CC BY-SA: Attribution-ShareAlike
- surplus. Provided by: Wiktionary. Located at: en.wiktionary.org/wiki/surplus. License: CC BY-SA: Attribution-ShareAlike
- equilibrium. Provided by: Wiktionary. Located at: en.wiktionary.org/wiki/equilibrium. License: CC BY-SA: Attribution-ShareAlike
- Provided by: Wikimedia. Located at: upload.wikimedia.org/wikipedi...demand.svg.png. License: CC BY-SA: Attribution-ShareAlike
- Supply. Provided by: Wikipedia. Located at: en.Wikipedia.org/wiki/File:Supply.gif. License: CC BY-SA: Attribution-ShareAlike
- Supply (economics). Provided by: Wikipedia. Located at: en.Wikipedia.org/wiki/Supply_(economics). License: CC BY-SA: Attribution-ShareAlike
- Supply and demand. Provided by: Wikipedia. Located at: en.Wikipedia.org/wiki/Supply_...upply_schedule. License: CC BY-SA: Attribution-ShareAlike
- aggregate. Provided by: Wiktionary. Located at: en.wiktionary.org/wiki/aggregate. License: CC BY-SA: Attribution-ShareAlike
- equilibrium. Provided by: Wiktionary. Located at: en.wiktionary.org/wiki/equilibrium. License: CC BY-SA: Attribution-ShareAlike
- Provided by: Wikimedia. Located at: upload.wikimedia.org/wikipedi...demand.svg.png. License: CC BY-SA: Attribution-ShareAlike
- Supply. Provided by: Wikipedia. Located at: en.Wikipedia.org/wiki/File:Supply.gif. License: CC BY-SA: Attribution-ShareAlike
- Supply. Provided by: Wikipedia. Located at: en.Wikipedia.org/wiki/File:Supply.gif. License: CC BY-SA: Attribution-ShareAlike
- Supply (economics). Provided by: Wikipedia. Located at: en.Wikipedia.org/wiki/Supply_...e_supply_curve. License: CC BY-SA: Attribution-ShareAlike
- Supply curve. Provided by: Wikipedia. Located at: en.Wikipedia.org/wiki/Supply_curve. License: CC BY-SA: Attribution-ShareAlike
- Boundless. Provided by: Boundless Learning. Located at: www.boundless.com//economics/...7-5ff14099db3b. License: CC BY-SA: Attribution-ShareAlike
- Provided by: Wikimedia. Located at: upload.wikimedia.org/wikipedi...demand.svg.png. License: CC BY-SA: Attribution-ShareAlike
- Supply. Provided by: Wikipedia. Located at: en.Wikipedia.org/wiki/File:Supply.gif. License: CC BY-SA: Attribution-ShareAlike
- Supply. Provided by: Wikipedia. Located at: en.Wikipedia.org/wiki/File:Supply.gif. License: CC BY-SA: Attribution-ShareAlike
- Provided by: Wikimedia. Located at: upload.wikimedia.org/wikipedi.../40/Supply.gif. License: CC BY-SA: Attribution-ShareAlike
- Supply (economics). Provided by: Wikipedia. Located at: en.Wikipedia.org/wiki/Supply_(economics). License: CC BY-SA: Attribution-ShareAlike
- Supply (economics). Provided by: Wikipedia. Located at: en.Wikipedia.org/wiki/Supply_(economics). License: CC BY-SA: Attribution-ShareAlike
- intervention. Provided by: Wiktionary. Located at: en.wiktionary.org/wiki/intervention. License: CC BY-SA: Attribution-ShareAlike
- incentive. Provided by: Wiktionary. Located at: en.wiktionary.org/wiki/incentive. License: CC BY-SA: Attribution-ShareAlike
- Provided by: Wikimedia. Located at: upload.wikimedia.org/wikipedi...demand.svg.png. License: CC BY-SA: Attribution-ShareAlike
- Supply. Provided by: Wikipedia. Located at: en.Wikipedia.org/wiki/File:Supply.gif. License: CC BY-SA: Attribution-ShareAlike
- Supply. Provided by: Wikipedia. Located at: en.Wikipedia.org/wiki/File:Supply.gif. License: CC BY-SA: Attribution-ShareAlike
- Provided by: Wikimedia. Located at: upload.wikimedia.org/wikipedi.../40/Supply.gif. License: CC BY-SA: Attribution-ShareAlike
- Provided by: Wikimedia. Located at: upload.wikimedia.org/wikipedi...and_curves.jpg. License: CC BY-SA: Attribution-ShareAlike
- Supply (economics). Provided by: Wikipedia. Located at: en.Wikipedia.org/wiki/Supply_(economics). License: CC BY-SA: Attribution-ShareAlike
- Supply (economics). Provided by: Wikipedia. Located at: en.Wikipedia.org/wiki/Supply_(economics). License: CC BY-SA: Attribution-ShareAlike
- Supply (economics). Provided by: Wikipedia. Located at: en.Wikipedia.org/wiki/Supply_(economics). License: CC BY-SA: Attribution-ShareAlike
- Boundless. Provided by: Boundless Learning. Located at: www.boundless.com//economics/...-price-changes. License: CC BY-SA: Attribution-ShareAlike
- Provided by: Wikimedia. Located at: upload.wikimedia.org/wikipedi...demand.svg.png. License: CC BY-SA: Attribution-ShareAlike
- Supply. Provided by: Wikipedia. Located at: en.Wikipedia.org/wiki/File:Supply.gif. License: CC BY-SA: Attribution-ShareAlike
- Supply. Provided by: Wikipedia. Located at: en.Wikipedia.org/wiki/File:Supply.gif. License: CC BY-SA: Attribution-ShareAlike
- Provided by: Wikimedia. Located at: upload.wikimedia.org/wikipedi.../40/Supply.gif. License: CC BY-SA: Attribution-ShareAlike
- Provided by: Wikimedia. Located at: upload.wikimedia.org/wikipedi...and_curves.jpg. License: CC BY-SA: Attribution-ShareAlike
- Supply-demand-right-shift-supply. Provided by: Wikimedia. Located at: commons.wikimedia.org/wiki/Fi...ift-supply.png. License: CC BY-SA: Attribution-ShareAlike


