1.1 What's it all about?
The big issues
Economics is the study of human behaviour. Since it uses scientific methods
it is called a social science. We study human behaviour to better understand
and improve our world. During his acceptance speech, a recent Nobel Laureate
in Economics suggested:
Economics, at its best, is a set of ideas and methods for the
improvement of society. It is not, as so often seems the case today, a set
of ideological rules for asserting why we cannot face the challenges of
stagnation, job loss and widening inequality.
Christopher Sims, Nobel Laureate in Economics 2011
This is an elegant definition of economics and serves as a timely caution
about the perils of ideology. Economics evolves continuously as current
observations and experience provide new evidence about economic behaviour
and relationships. Inference and policy recommendations based on earlier
theories, observations and institutional structures require constant
analysis and updating if they are to furnish valuable responses to changing
conditions and problems.
Much of today's developed world still faces severe challenges as a result of the
financial crisis that began in 2008. Unemployment rates among young people
are at historically high levels in several economies, many government balance
sheets are in disarray, and inequality is on the rise. In addition to the
challenges posed by this severe economic cycle, the world simultaneously
faces structural upheaval: Overpopulation, climate change, political
instability and globalization challenge us to understand and modify our
behaviour.
These challenges do not imply that our world is deteriorating. Literacy
rates have been rising dramatically in the developing world for decades;
child mortality has plummeted; family size is a fraction of what it was 50
years ago; prosperity is on the rise in much of Asia; life expectancy is
increasing universally and deaths through wars are in a state of long-term
decline.
These developments, good and bad, have a universal character and affect
billions of individuals. They involve an understanding of economies as large
organisms with interactive components.
Aggregate output in a national economy
A national economy is a complete multi-sector system, made up of household, business, financial, government and international sectors. Each of these sectors is an aggregate or sum of a many smaller economic units with very similar characteristics. The government sector, for example aggregates the taxing and spending activities of local, provincial and national governments. Similarly, the household sector is an aggregate of the income, spending and saving of all households but not the specifics of each individual household. Economic activity within any one of these sectors reflects, in part, the conditions and choices made in that sector. But it is also affects and is affected by conditions and actions in the other sectors. These interactions and feedbacks within the system mean that the workings of the macro-economy are more complex than the operation of the sum of its parts.
Macroeconomics: the study of the economy as a system in which interactions and feedbacks among sectors determine national output, employment and prices.
For example, consider a simple economy with just household, business and financial sectors. The household sector earns income by providing labour to the other sectors. Households make choices about spending or saving this income. Businesses make decisions about the sizes of their establishments, their labour forces, and their outputs of goods and services. The financial sector provides banking services: bank deposits, loans, and the payments system used by all three sectors.
Suppose households decide to spend more on goods and services and save less. That decision by itself does not change household sector income, but it does increase business sector sales and revenues. It also reduces the flow of household savings into bank deposits in the financial sector. As a result the business sector has an incentive to increase employment and output and perhaps to borrow from the financial sector to finance that expansion. Increased employment in the business sector increases incomes in the household sector and further increases household expenditure and savings. These inter-sector linkages and feedbacks produce a response in aggregate economy greater than the initial change.
Expanding this simple example to include more sectors increases its complexity but does not change the basics. A change in behaviour within a sector,or disturbance from outside that sector, changes aggregate levels of output, employment and prices. A complete multisector macroeconomic theory and model is required to understand the effects, on the aggregate economy, of changes in either internal or external economic conditions. It is also essential for the design of policies to manage the macroeconomic conditions.
Mitigating the effects of a large random shock from outside the economy, like the COVID-19 pandemic, disrupts all sectors of the economy. Flows of income, expenditure, revenue,and output among sectors are reduced sharply both by the pandemic and by government and financial sectors policy responses.
Application Box 1.1 COVID-19 and the Economy
The COVID-19 pandemic attacked Canada in early 2020. It revealed the complexities and interdependencies that drive the macro economy. Control and elimination of the disease depends on stopping person to person transmission. This is why the government mandated personal and social distancing for individuals plus self-isolation and quarantine in some cases. In addition businesses, mainly in the service sector, that relied on face to face interactions with customers or live audiences were forced to close.
As a result, businesses lost sales revenues and cut output. They reduced employment to cut labour costs, but overhead costs remained. Households lost employment and employment incomes. They reduced their discretionary spending, but their overhead costs continued. As a result the economy faced a unique, simultaneous collapse in overall private supply and demand and the risk of a deep recession. The government and financial sectors intervened with fiscal and monetary policy support. Government introduced a wide range of new income supports for the household sector, and loan and subsidy programs to support businesses, funded by large increases in the government's budget deficit. The central bank lowered interest rates and increased the monetary base to support the government's borrowing requirements, and the credit demands on private banks and other financial institutions. The banking system lost the normal growth in customer deposits, but worked to accommodate the needs of their business and household clients.
This unprecedented support from government fiscal policy and central bank monetary policy will offset part of the loss in national output and income. But it will not reverse it. Recovery will begin with the reopening of business and the growth of employment at some time in the uncertain future. The size of the estimated effect of COVID-19 on the Canadian economy is stark. In its Monetary Policy Report, April 2020, The Bank of Canada estimates that real GDP in Canada will be 1% to 7.5% lower in 2020Q1 and lower by 15-30% in 2020Q2 than in 2019Q4. The Monetary Policy Report is available on the Bank of Canada's website at www.bankofcanada.ca.
Individual behaviours
Economic actions, at the level of the person or organization, form the
subject matter of microeconomics. Formally, microeconomics is
the study of individual behaviour in the context of scarcity. Not all
individual behaviours are motivated by self-interest; many are motivated by
a concern for the well being of society-at-large. Philanthropic societies
are goal-oriented and seek to attain their objectives in an efficient
manner.
Microeconomics: the study of individual behaviour in the context of scarcity.
Individual economic decisions need not be world-changing events, or
motivated by a search for profit. Microeconomics is also about how we choose
to spend our time and money. There are quite a few options to choose from:
Sleep, work, study, food, shelter, transportation, entertainment, recreation
and so forth. Because both time and income are limited we cannot do all
things all the time. Many choices are routine or are driven by necessity.
You have to eat and you need a place to live. If you have a job you have
committed some of your time to work, or if you are a student some of your
time is committed to lectures and study. There is more flexibility in other
choices. Critically, microeconomics seeks to understand and explain how we
make choices and how those choices affect our behaviour in the workplace,
the marketplace, and society more generally.
A critical element in making choices is that there exists a scarcity
of time, or income or productive resources. Decisions are invariably subject
to limits or constraints, and it is these constraints that make decisions
both challenging and scientific.
Microeconomics also concerns business choices. How does a business use its
funds and management skill to produce goods and services? The individual
business operator or firm has to decide what to produce, how to produce it,
how to sell it and in many cases, how to price it. To make and sell pizza,
for example, the pizza parlour needs, in addition to a source of pizza
ingredients, a store location (land), a pizza oven (capital), a cook and a
sales person (labour). Payments for the use of these inputs generate income
to those supplying them. If revenue from the sale of pizzas is greater than
the costs of production, the business earns a profit for the owner. A
business fails if it cannot cover its costs.
In these micro-level behaviours the decision makers have a common goal: To
do as well as they can, given the constraints imposed by the
operating environment. The individual wants to mix work and leisure in a
way that makes her as happy or contented as possible. The entrepreneur aims
at making a profit. These actors, or agents as we sometimes call them, are
maximizing. Such maximizing behaviour is a central theme in this
book and in economics at large.
Markets and government
Markets play a key role in coordinating the choices of individuals with the
decisions of business. In modern market economies goods and services are
supplied by both business and government. Hence we call them
mixed economies. Some products or services are available through the marketplace to
those who wish to buy them and have the necessary income—as in cases like
coffee and wireless services. Other services are provided to all people
through government programs like law enforcement and health care.
Mixed economy: goods and services are supplied both by private suppliers and government.
Markets offer the choice of a wide range of goods and services at various
prices. Individuals can use their incomes to decide the pattern of
expenditures and the bundle of goods and services they prefer. Businesses
sell goods and services in the expectation that the market price will cover
costs and yield a profit.
The market also allows for specialization and separation between production
and use. Rather than each individual growing her own food, for example, she
can sell her time or labour to employers in return for income. That income
can then support her desired purchases. If businesses can produce food more
cheaply than individuals the individual obviously gains from using the
market – by both having the food to consume, and additional income with
which to buy other goods and services. Economics seeks to explain how
markets and specialization might yield such gains for individuals and
society.
We will represent individuals and firms by envisaging that they have
explicit objectives – to maximize their happiness or profit. However, this
does not imply that individuals and firms are concerned only with such
objectives. On the contrary, much of microeconomics and macroeconomics
focuses upon the role of government: How it manages the economy through
fiscal and monetary policy, how it redistributes through the tax-transfer
system, how it supplies information to buyers and sets safety standards for
products.
Since governments perform all of these society-enhancing functions, in
large measure governments reflect the social ethos of voters. So, while
these voters may be maximizing at the individual level in their everyday
lives, and our models of human behaviour in microeconomics certainly
emphasize this optimization, economics does not see individuals and
corporations as being devoid of civic virtue or compassion, nor does it
assume that only market-based activity is important. Governments play a
central role in modern economies, to the point where they account for more
than one third of all economic activity in the modern mixed economy.
Governments supply goods and services in many spheres, for example, health
and education. The provision of public education is motivated both by a
concern for equality and a realization that an educated labour force
increases the productivity of an economy. Likewise, the provision of law and
order, through our legal system broadly defined, represents more than a
commitment to a just society at the individual level; without a legal system
that enforces contracts and respects property rights, the private sector of
the economy would diminish dramatically as a result of corruption,
uncertainty and insecurity. It is the lack of such a secure environment in
many of the world's economies that inhibits their growth and prosperity.
Let us consider now the methods of economics, methods that are common to
science-based disciplines.
1.2 Understanding through the use of models
Most students have seen an image of Ptolemy's concept of our Universe.
Planet Earth forms the centre, with the other planets and our sun revolving
around it. The ancients' anthropocentric view of the universe necessarily
placed their planet at the centre. Despite being false, this view of our
world worked reasonably well – in the sense that the ancients could predict
celestial motions, lunar patterns and the seasons quite accurately.
More than one Greek astronomer believed that it was more natural for smaller
objects such as the earth to revolve around larger objects such as the sun,
and they knew that the sun had to be larger as a result of having studied
eclipses of the moon and sun. Nonetheless, the Ptolemaic description of the
universe persisted until Copernicus wrote his treatise "On the Revolutions
of the Celestial Spheres" in the early sixteenth century. And it was
another hundred years before the Church accepted that our corner of the
universe is heliocentric. During this time evidence accumulated as a result
of the work of Brahe, Kepler and Galileo. The time had come for the
Ptolemaic model of the universe to be supplanted with a better
model.
All disciplines progress and develop and explain themselves using models of
reality. A model is a formalization of theory that facilitates
scientific inquiry. Any history or philosophy of science book will describe
the essential features of a model. First, it is a stripped down, or reduced,
version of the phenomenon that is under study. It incorporates the key
elements while disregarding what are considered to be secondary elements.
Second, it should accord with reality. Third, it should be able to make
meaningful predictions. Ptolemy's model of the known universe met these
criteria: It was not excessively complicated (for example distant stars were
considered as secondary elements in the universe and were excluded); it
corresponded to the known reality of the day, and made pretty good
predictions. Evidently not all models are correct and this was the case here.
Model: a formalization of theory that facilitates scientific inquiry.
In short, models are frameworks we use to organize how we think about a
problem. Economists sometimes interchange the terms theories and models,
though they are conceptually distinct. A theory is a logical
view of how things work, and is frequently formulated on the basis of
observation. A model is a formalization of the essential elements of a
theory, and has the characteristics we described above. As an example of an
economic model, suppose we theorize that a household's expenditure depends
on its key characteristics: A corresponding model might specify that wealth,
income, and household size determine its expenditures, while it might ignore
other, less important, traits such as the household's neighbourhood or its
religious beliefs. The model reduces and simplifies the theory to manageable
dimensions. From such a reduced picture of reality we develop an analysis of
how an economy and its components work.
Theory: a logical view of how things work, and is frequently formulated on the basis of observation.
An economist uses a model as a tourist uses a map. Any city map misses out
some detail—traffic lights and speed bumps, for example. But with careful
study you can get a good idea of the best route to take. Economists are not
alone in this approach; astronomers, meteorologists, physicists, and genetic
scientists operate similarly. Meteorologists disregard weather conditions in
South Africa when predicting tomorrow's conditions in Winnipeg. Genetic
scientists concentrate on the interactions of limited subsets of genes that
they believe are the most important for their purpose. Even with huge
computers, all of these scientists build models that concentrate on
the essentials.
1.3 Opportunity cost and the market
Individuals face choices at every turn: In deciding to go to the hockey game
tonight, you may have to forgo a concert; or you will have to forgo some
leisure time this week in order to earn additional income for the hockey
game ticket. Indeed, there is no such thing as a free lunch, a free hockey
game or a free concert. In economics we say that these limits or constraints
reflect opportunity cost. The opportunity cost of a choice is
what must be sacrificed when a choice is made. That cost may be financial;
it may be measured in time, or simply the alternative foregone.
Opportunity cost: what must be sacrificed when a choice is made.
Opportunity costs play a determining role in markets. It is precisely
because individuals and organizations have different opportunity costs that
they enter into exchange agreements. If you are a skilled plumber and an
unskilled gardener, while your neighbour is a skilled gardener and an
unskilled plumber, then you and your neighbour not only have different
capabilities, you also have different opportunity costs, and you
could gain by trading your skills. Here's why. Fixing a leaking pipe has a
low opportunity cost for you in terms of time: You can do it quickly. But
pruning your apple trees will be costly because you must first learn how to
avoid killing them and this may require many hours. Your neighbour has
exactly the same problem, with the tasks in reverse positions. In a sensible
world you would fix your own pipes and your neighbour's pipes, and
she would ensure the health of the apple trees in both backyards.
If you reflect upon this 'sensible' solution—one that involves each of you
achieving your objectives while minimizing the time input—you will quickly
realize that it resembles the solution provided by the marketplace. You may
not have a gardener as a neighbour, so you buy the services of a gardener in
the marketplace. Likewise, your immediate neighbour may not need a leaking
pipe repaired, but many others in your neighbourhood do, so you sell your
service to them. You each specialize in the performance of specific tasks as
a result of having different opportunity costs or different efficiencies.
Let us now develop a model of exchange to illustrate the advantages of
specialization and trade, and hence the markets that facilitate these
activities. This model is developed with the help of some two-dimensional
graphics.
1.4 A model of exchange and specialization
Production and specialization
We have two producers and two goods: Amanda and Zoe produce vegetables (V)
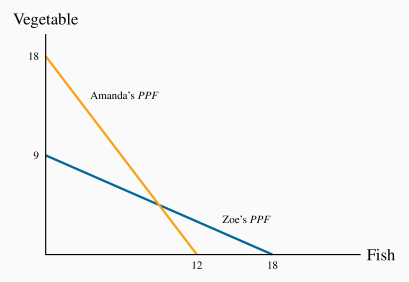
and or fish (F). Their production capabilities are defined in Table 1.1 and in Figure 1.1, where the quantity
of V appears on the vertical axis and the quantity of F on the
horizontal axis. Zoe and Amanda each have 36-hour weeks and they devote
that time to producing the two goods. But their efficiencies differ: Amanda
requires two hours to produce a unit of V and three hours for a unit of F. As a consequence, if she devotes all of her time to V she can produce 18
units, or if she devotes all of her time to F she can produce 12 units.
Or, she could share her time between the two. This environment can also be
illustrated and analyzed graphically, as in Figure 1.1.
Table 1.1 Production possibilities in a two-person economy
|
| Hours/ | Hours/ | Fish | Vegetable |
|
| fish | vegetable | specialization | specialization |
|
Amanda | 3 | 2 | 12 | 18 |
|
Zoe | 2 | 4 | 18 | 9 |
Each producer has a time allocation of 36 hours. By allocating total time to one activity, Amanda can produce 12F or 18V, Zoe can produce 18F or 9V. By splitting their time each person can also produce a combination of the two.
Two-dimensional graphics are a means of portraying the operation of a model,
as defined above. We will use these graphical representations throughout the
text. In this case, Amanda's production capability is represented by the
line that meets the vertical axis at 18 and the horizontal axis at 12. The
vertical point indicates that she can produce 18 units of V if she
produces zero units of F – keep in mind that where V has a value of 18,
Amanda has no time left for fish production. Likewise, if she devotes all of
her time to fish she can produce 12 units, since each unit requires 3 of her
36 hours. The point F=12 is thus another possibility for her. In addition
to these two possibilities, which we can term 'specialization', she could
allocate her time to producing some of each good. For example, by dividing
her 36 hours equally she could produce 6 units of F and 9 units of V. A
little computation will quickly convince us that different allocations of
her time will lead to combinations of the two goods that lie along a
straight line joining the specialization points.
We will call this straight line Amanda's production possibility
frontier (PPF): It is the combination of goods she can produce while
using all of her resources – time. She could not produce combinations of
goods represented by points beyond this line (to the top right). She could
indeed produce combinations below it (lower left) – for example, a
combination of 4 units of V and 4 units of F; but such points would not
require all of her time. The (4,4) combination would require just 20
hours. In sum, points beyond this line are not feasible, and points within
it do not require all of her time resources.
Production possibility frontier (PPF): the combination of goods that can be produced using all of the resources available.
Having developed Amanda's PPF, it is straightforward to develop a
corresponding set of possibilities for Zoe. If she requires 4 hours to
produce a unit of V and 2 hours to produce a unit of F, then her 36
hours will enable her to specialize in 9 units of V or 18 units of F; or
she could produce a combination represented by the straight line that joins
these two specialty extremes.
Consider now the opportunity costs for each person. Suppose Amanda is
currently producing 18 V and zero F, and considers producing some F
and less V. For each unit of F she wishes to produce, it is evident from
her PPF that she must sacrifice 1.5 units of V. This is because F
requires 50% more hours than V. Her trade-off is 1.5:1.0. The
additional time requirement is also expressed in the intercept values: She
could give up 18 units of V and produce 12 units of F instead; this
again is a ratio of 1.5:1.0. This ratio defines her opportunity cost: The
cost of an additional unit of F is that 1.5 units of V must be
'sacrificed'.
Applying the same reasoning to Zoe's PPF, her opportunity cost is 0.5:1;
she must sacrifice one half of a unit of V to free up enough time to
produce one unit of F.
So we have established two things about Amanda and Zoe's production
possibilities. First, if Amanda specializes in V she can produce more than
Zoe, just as Zoe can produce more than Amanda if Zoe specializes in F.
Second, their opportunity costs are different: Amanda must sacrifice more V
than Zoe in producing one more unit of F. The different opportunity costs
translate into potential gains for each individual.
The gains from exchange
We shall illustrate the gains that arise from specialization and exchange
graphically. Note first that if these individuals are self-sufficient, in
the sense that they consume their own production, each individual's
consumption combination will lie on their own PPF. For example, Amanda
could allocate half of her time to each good, and produce (and consume) 6F
and 9V. Such a point necessarily lies on her PPF. Likewise for Zoe. So,
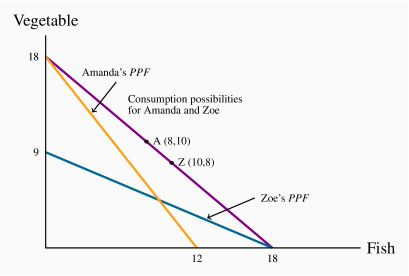
in the absence of exchange, each individual's PPF is also her consumption possibility frontier (CPF). In Figure 1.1 the PPF for each individual is thus also her CPF.
Consumption possibility frontier (CPF): the combination of goods that can be consumed as a result of a given production choice.
Upon realizing that they are not equally efficient in producing the two
goods, they decide to specialize completely in producing just the single
good where they are most efficient. Amanda specializes in V and Zoe in F. Next they must agree to a rate at which to exchange V for F. Since
Amanda's opportunity cost is 1.5:1 and Zoe's is 0.5:1, suppose they
agree to exchange V for F at an intermediate rate of 1:1. There are
many trading, or exchange, rates possible; our purpose is to illustrate that
gains are possible for both individuals at some exchange rate. The
choice of this rate also makes the graphic as simple as possible. At this
exchange rate, 18V must exchange for 18F. In Figure 1.2,
this means that each individual is now able to consume along the line
joining the coordinates (0,18) and (18,0). This is because Amanda produces 18V and she can
trade at a rate of 1:1, while Zoe produces 18F and trades at the same
rate of 1:1.
The fundamental result illustrated in Figure 1.2 is that, as
a result of specialization and trade, each individual can consume
combinations of goods that lie on a line beyond her initial consumption
possibilities. Their consumption well-being has thus improved. For example,
suppose Amanda trades away 8V to Zoe and obtains 8F in return. The
points 'A' and 'Z' with coordinates (8,10) and (10,8) respectively
define their final consumption. Pre-specialization, if Amanda wished to
consume 8F she would have been constrained to consume 6V rather than the
10V now possible. Zoe benefits correspondingly.
The foregoing example illustrates that trade is not a zero-sum game; it has a positive net value because both parties to the trade can gain. A
zero-sum gain is where the gains to one party exactly offset the losses to
another. This is an extraordinarily important principle in trade
negotiations, whether international or domestic.
A zero-sum game is an interaction where the gain to one party equals the loss to another party.
Market design
In the preceding example we have shown that specialization provides scope
for gains that can accrue to those participating in the exchange. But this
tells us little about how a market for these products comes into being: how
does the exchange take place, and how is information transmitted? The answer
is that while some markets have evolved historically to their current state,
many markets are designed by an institution or a firm. Fruit and vegetable
markets have been with us for thousands of years - since we ceased being
purely a hunter-gatherer society. They exist in every community in the world
economy. In contrast, the Dutch tulip auction was designed in the early
1600s and exists in basically the same form to this day: the auctioneer
begins with a high price, lowers it at known time intervals (measured in
seconds or minutes) until some buyer signals that she is willing to purchase
the lot on offer. Supermarkets in contrast offer goods at a fixed price.
Government contracts are normally signed after a tendering process, in which
interested suppliers submit bids. Amazon Inc. is currently experimenting
with cashierless 'bricks and mortar' stores that monitor all transactions
electronically. Craig's List and E-Bay have their own sets of rules.
In each of these cases markets are designed, frequently with a specific
objective on the part of the supplier or the mediating institution: Amazon
wants to increase its share of all goods trades; governments wish to limit
costs. Markets do not all grow spontaneously and the structure of a market
will influence how the gains from trade are distributed.
1.5 Economy-wide production possibilities
The PPFs in Figures 1.1 and 1.2 define the amounts of the goods
that each individual can produce while using all of their fixed
productive capacity—time in this instance. The national, or economy-wide,
PPF for this two-person economy reflects these individual possibilities
combined. Such a frontier can be constructed using the individual frontiers
as the component blocks.
First let us define this economy-wide frontier precisely. The economy-wide PPF is the set of goods and services
combinations that can be produced in the economy when all available
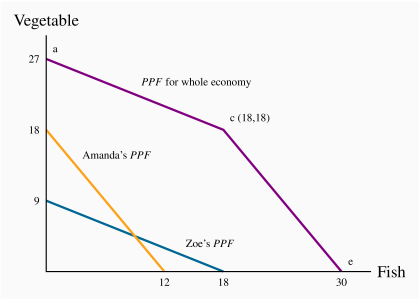
productive resources are in use. Figure 1.3 contains both
of the individual frontiers plus the aggregate of these, represented by the
kinked line ace. The point on the V axis, a=27, represents the
total amount of V that could be produced if both individuals devoted all
of their time to it. The point e=30 on the horizontal axis is the
corresponding total for fish.
Economy-wide PPF: the set of goods and services combinations that can be produced in the economy when all available productive resources are in use.
To understand the point c, imagine initially that all resources are
devoted to V. From such a point, a, consider a reduction in V and an
increase in F. The most efficient way of increasing F production at the
point a is to use the individual whose opportunity cost is lower. Zoe can produce
one unit of F by sacrificing just 0.5 units of V, whereas Amanda must
sacrifice 1.5 units of V to produce 1 unit of F. Hence, at this stage
Amanda should stick to V and Zoe should devote some time to fish. In fact
as long as we want to produce more fish Zoe should be the one to do it,
until she has exhausted her time resource. This occurs after she has
produced 18F and has ceased producing V. At this point the economy will
be producing 18V and 18F – the point c.
From this combination, if the economy wishes to produce more fish Amanda
must become involved. Since her opportunity cost is 1.5 units of V for
each unit of F, the next segment of the economy-wide PPF must see a
reduction of 1.5 units of V for each additional unit of F. This is
reflected in the segment ce. When both producers allocate all of their
time to F the economy can produce 30 units. Hence the economy's PPF is
the two-segment line ace. Since this has an outward kink, we call it
concave (rather than convex).
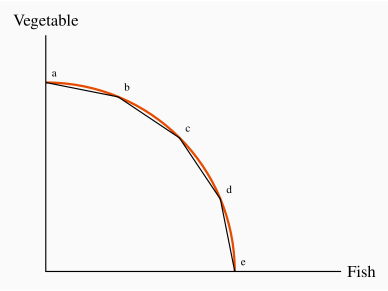
As a final step consider what this PPF would resemble if the economy were
composed of many persons with differing efficiencies. A
little imagination suggests (correctly) that it will have a segment for each
individual and continue to have its outward concave form. Hence, a
four-person economy in which each person had a different opportunity cost
could be represented by the segmented line abcde, in Figure 1.4.
Furthermore, we could represent the PPF of an
economy with a very large number of such individuals by a somewhat smooth PPF that accompanies the 4-person PPF. The logic for its shape continues
to be the same: As we produce less V and more F we progressively bring
into play resources, or individuals, whose opportunity cost, in terms of
reduced V is higher.
The outputs V and F in our economic model require just one input –
time, but if other productive resources were required the result would be
still a concave PPF. Furthermore, we generally interpret the PPF to
define the output possibilities when the economy is running at its
normal capacity. In this example, we consider a work week of 36 hours to be
the 'norm'. Yet it is still possible that the economy's producers might work
some additional time in exceptional circumstances, and this would increase
total production possibilities. This event would be represented by an
outward movement of the PPF.
1.6 Aggregate output, growth and business cycles
The PPF can be used to illustrate several aspects of macroeconomics: In
particular, the level of an economy's output, the growth of national and per
capita output over time, and short-run business-cycle fluctuations in
national output and employment.
Aggregate output
An economy's capacity to produce goods and services depends on its endowment
of resources and the productivity of those resources. The two-person,
two-product examples in the previous section reflect this.
The productivity of labour, defined as output per worker or
per hour, depends on:
The skill, knowledge and experience of the labour force;
The capital stock: Buildings, machinery, equipment, and
software the labour force has to work with; and
The current state of technology.
The productivity of labour is the output of goods and services per worker.
An economy's capital stock is the buildings, machinery, equipment and software used in producing goods and services.
The economy's output, which we define by Y, can be defined as the output
per worker times the number of workers; hence, we can write:
When the employment of labour corresponds to 'full employment' in the sense
that everyone willing to work at current wage rates and normal hours of work
is working, the economy's actual output is also its capacity output Yc.
We also term this capacity output as full employment output:
Full employment output 
 .
.
Suppose the economy is operating with full employment of resources producing
outputs of two types: Goods and services. In Figure 1.5,
 shows the different combinations of goods and services the
economy can produce in a particular year using all its labour, capital and
the best technology available at the time.
shows the different combinations of goods and services the
economy can produce in a particular year using all its labour, capital and
the best technology available at the time.
An aggregate economy produces a large variety of outputs in two broad
categories. Goods are the products of the agriculture, forestry, mining,
manufacturing and construction industries. Services are provided by the
wholesale and retail trade, transportation, hospitality, finance, health
care, education, legal and other service sectors. As in the two-product
examples used earlier, the shape of the PPF illustrates the opportunity
cost of increasing the output of either product type. We are not concerned
with who supplies the products for the moment: It may be the private sector
or the government.
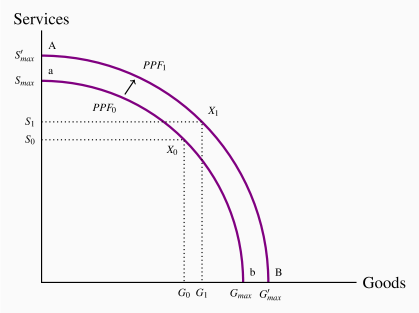
Point X0 on PPF0 shows one possible structure of capacity output. This
combination may reflect the pattern of demand and hence expenditures in this
economy. Output structures and therefore the shapes of PPFs differ among economies with different income
levels. High-income economies spend more on services than goods and produce
higher ratios of services to goods. Middle income countries produce lower
ratios of services to goods, and low income countries much lower ratios of
services to goods. For example, in 2017, the structure of national output in Canada was 70 percent services and 30 percent goods, while in Mexico the structure was 48 percent services and 52 percent goods.
Different countries also have different PPFs and
different output structures, depending on their resource endowments, labour forces, capital stocks, technology and expenditure patterns.
Economic growth
Three things contribute to growth in the economy. The labour supply grows as
the population expands; the stock of capital grows as spending by business
(and government) on buildings, machinery, information technology and so
forth increases; and labour-force productivity grows as a result of experience, the
development of scientific knowledge combined with product and process
innovations, and advances in the technology of production. Combined, these
developments expand capacity output over time. In Figure 1.5
economic growth shifts the PPF out from to  .
.
This basic description covers the key sources of growth in total output.
Economies differ in their rates of overall economic growth as a result of
different rates of growth in labour force, in capital stock, and
improvements in technology. But improvements in standards of living require
more than growth in total output. Increases in output per worker
and per person are necessary. Sustained increases in living
standards require sustained growth in labour productivity, which in turn is
based on advances in the technology along with the amount of capital each
worker has to work with. Furthermore, if the growth in output is to benefit society at large, workers across the board need to see an increase in their earnings. As we shall explore in Chapter 13, several developed countries have seen the fruits of growth concentrated in the hands of the highest income earners.
Recessions and booms
A prime objective of economic policy is to ensure that the economy operates
on or near the PPF – it should use its resources to capacity and have
minimal unemployment. However, economic conditions are seldom tranquil for
long periods of time. Unpredictable changes in business expectations of
future profits, in consumer confidence, in financial markets, in commodity
and energy prices, in trade agreements and disputes, in economic conditions in major trading partners, in
government policy and many other events disrupt patterns of expenditure and
output. Some of these changes disturb the level of total expenditure and
thus the demand for total output. Others disturb the conditions of
production and thus the economy's production capacity. Whatever the exact
cause, the economy may be pushed off its current PPF. If expenditures on
goods and services decline, the economy may experience a recession. Output would fall short of capacity output and
unemployment would rise. Alternatively, times of rapidly growing expenditure
and output may result in an economic boom: Output and
employment expand beyond capacity levels.
An economic recession occurs when output falls below the economy's capacity output.
A boom is a period of high growth that raises output above normal capacity output.
Recent history provides examples. Following the financial crisis of 2008-09
that hit the US and many other developed economies, many economies were
pushed into recessions. Expenditure on new residential construction
collapsed for lack of income and secure financing, as did business
investment, consumption spending and exports. Lower expenditures reduced
producers' revenues, forcing cuts in output and employment and reducing
household incomes. Lower incomes led to further cutbacks in spending. In
Canada in 2009 aggregate output declined by 2.9 percent, employment declined
by 1.6 percent and the unemployment rate rose from 6.1 percent in 2008 to
8.3 percent by 2010. The world's economies have been slow to recover, and
even by 2019 the output in several developed economies was no higher than it
was in 2008. Canada's recession was not nearly as severe as the recessions
in economies such as Spain, Italy and Greece; but output between 2009 and 2019 has
been below the potential of the Canadian economy. In the third quarter of 2019 the national output was about 0.7 percent below potential output and the unemployment rate was 5.5 percent.
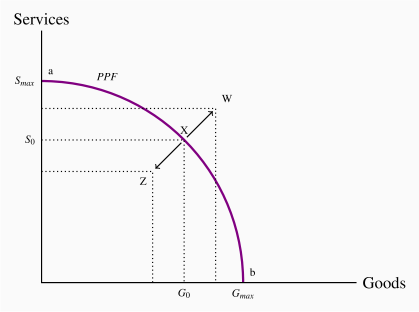
An economy in a recession is operating inside its PPF. The fall in output
from X to Z in Figure 1.6 illustrates the effect
of a recession. Expenditures on goods and services have declined. Output is
less than capacity output, unemployment is up and some plant capacity is
idle. Labour income and business profits are lower. More people would like
to work and business would like to produce and sell more output, but it
takes time for interdependent product, labour and financial markets in the
economy to adjust and increase employment and output. Monetary and fiscal
policy may be productive in specific circumstances, to stimulate demand,
increase output and employment and move the economy back to capacity output
and full employment. The development and implementation of such policies
form the core of macroeconomics.
Alternatively, an unexpected increase in demand for exports would increase
output and employment. Higher employment and output would increase incomes
and expenditure, and in the process spread the effects of higher output
sales to other sectors of the economy. The economy would move outside its PPF, for example to W in Figure 1.6, by using its
resources more intensively than normal. Unemployment would fall and overtime
work would increase. Extra production shifts would run plant and equipment
for longer hours and work days than were planned when it was designed and
installed. Output at this level may not be sustainable, because shortages of
labour and materials along with excessive rates of equipment wear and tear
would push costs and prices up. Again, we will examine how the economy
reacts to such a state in our macroeconomic analysis.
Output and employment in the Canadian economy over the past twenty years
fluctuated about growth trend in the way Figure 1.6
illustrates. For several years prior to 2008 the Canadian economy operated
slightly above its capacity; but once the recession arrived monetary and
fiscal policy were used to fight it – to bring the economy back from a
point such as Z towards a point such as X on the PPF.
Macroeconomic models and policy
The PPF diagrams illustrate the main dimensions of macroeconomics:
Capacity output, growth in capacity output and business cycle fluctuations
in actual output relative to capacity. But these diagrams do not offer
explanations and analysis of macroeconomic activity. We need a macroeconomic
model to understand and evaluate the causes and consequences of
business cycle fluctuations. As we shall see, these models are based on
explanations of expenditure decisions by households and business, financial
market conditions, production costs and producer pricing decisions at
different levels of output. Models also capture the objectives of fiscal and
monetary policies and provide a framework for policy evaluation. A full
macroeconomic model integrates different sector behaviours and the feedbacks
across sectors that can moderate or amplify the effects of changes in one
sector on national output and employment.
Key Terms
Macroeconomics studies the economy as system in which linkages and feedbacks among sectors determine national output, employment and prices.
Microeconomics is the study of individual behaviour in the context of scarcity.
Mixed economy: goods and services are supplied both by private suppliers and government.
Model is a formalization of theory that facilitates scientific inquiry.
Theory is a logical view of how things work, and is frequently formulated on the basis of observation.
Opportunity cost of a choice is what must be sacrificed when a choice is made.
Production possibility frontier (PPF) defines the combination of goods that can be produced using all of the resources available.
Consumption possibility frontier (CPF): the combination of goods that can be consumed as a result of a given production choice.
A zero-sum game is an interaction where the gain to one party equals the loss to another party.
Economy-wide PPF is the set of goods combinations that can be produced in the economy when all available productive resources are in use.
Productivity of labour is the output of goods and services per worker.
Capital stock: the buildings, machinery, equipment and software used in producing goods and services.
Full employment output
.
Recession: when output falls below the economy's capacity output.
Boom: a period of high growth that raises output above normal capacity output.
Exercises for Chapter 1
An economy has 100 identical workers. Each one can produce four cakes or three shirts, regardless of the number of other individuals producing each good.
How many cakes can be produced in this economy when all the workers are cooking?
How many shirts can be produced in this economy when all the workers are sewing?
On a diagram with cakes on the vertical axis, and shirts on the horizontal axis, join these points with a straight line to form the PPF.
Label the inefficient and unattainable regions on the diagram.
In the table below are listed a series of points that define an economy's production possibility frontier for goods Y and X.
|
Y | 1000 | 900 | 800 | 700 | 600 | 500 | 400 | 300 | 200 | 100 | 0 |
|
X | 0 | 1600 | 2500 | 3300 | 4000 | 4600 | 5100 | 5500 | 5750 | 5900 | 6000 |
Plot these pairs of points to scale, on graph paper, or with the help of a spreadsheet.
Given the shape of this PPF is the economy made up of individuals who are similar or different in their production capabilities?
What is the opportunity cost of producing 100 more Y at the combination (X=5500,Y=300).
Suppose next there is technological change so that at every output level of good Y the economy can produce 20 percent more X. Enter a new row in the table containing the new values, and plot the new PPF.
Using the PPF that you have graphed using the data in Exercise 1.2, determine if the following combinations are attainable or not: (X=3000,Y=720), (X=4800,Y=480).
You and your partner are highly efficient people. You can earn $20 per hour in the workplace; your partner can earn $30 per hour.
What is the opportunity cost of one hour of leisure for you?
What is the opportunity cost of one hour of leisure for your partner?
Now consider what a PPF would look like: You can produce/consume two things, leisure and income. Since income buys things you can think of the PPF as having these two 'products' – leisure and consumption goods/services. So, with leisure on the horizontal axis and income in dollars is on the vertical axis, plot your PPF. You can assume that you have 12 hours per day to allocate to either leisure or income. [Hint: the leisure axis will have an intercept of 12 hours. The income intercept will have a dollar value corresponding to where all hours are devoted to work.]
Draw the PPF for your partner.
Louis and Carrie Anne are students who have set up a summer business in their neighbourhood. They cut lawns and clean cars. Louis is particularly efficient at cutting the grass – he requires one hour to cut a typical lawn, while Carrie Anne needs one and one half hours. In contrast, Carrie Anne can wash a car in a half hour, while Louis requires three quarters of an hour.
If they decide to specialize in the tasks, who should cut the grass and who should wash cars?
If they each work a twelve hour day, how many lawns can they cut and how many cars can they wash if they each specialize in performing the task where they are most efficient?
Illustrate the PPF for each individual where lawns are on the horizontal axis and car washes on the vertical axis, if each individual has twelve hours in a day.
Continuing with the same data set, suppose Carrie Anne's productivity improves so that she can now cut grass as efficiently as Louis; that is, she can cut grass in one hour, and can still wash a car in one half of an hour.
In a new diagram draw the PPF for each individual.
In this case does specialization matter if they are to be as productive as possible as a team?
Draw the PPF for the whole economy, labelling the intercepts and the 'kink' point coordinates.
Going back to the simple PPF plotted for Exercise 1.1 where each of 100 workers can produce either four cakes or three shirts, suppose a recession reduces demand for the outputs to 220 cakes and 129 shirts.
Plot this combination of outputs in the diagram that also shows the PPF.
How many workers are needed to produce this output of cakes and shirts?
What percentage of the 100 worker labour force is unemployed?