In this chapter we will explore:
| 11.1 | The principle ideas
|
| 11.2 | Imperfect competitors
|
| 11.3 | Imperfect competitors: measures of structure and market power
|
| 11.4 | Imperfect competition: monopolistic competition
|
| 11.5 | Imperfect competition: economies of scope and platforms
|
| 11.6 | Strategic behaviour: oligopoly and games
|
| 11.7 | Strategic behaviour: duopoly and Cournot games
|
| 11.8 | Strategic behaviour: entry, exit and potential competition
|
| 11.9 | Matching markets: design
|
11.1 The principle ideas
The preceding chapters have explored extreme forms of supply: The monopolist
is the sole supplier and possesses as much market power as possible. In
contrast, the perfect competitor is small and has no market power
whatsoever. He simply accepts the price for his product that is determined
in the market by the forces of supply and demand. These are very useful
paradigms to explore, but the real world for the most part lies between
these extremes. We observe that there are a handful of dominant brewers in
Canada who supply more than three quarters of the market, and they are
accompanied by numerous micro brewers that form the fringe of the brewing
business. We have a small number of air carriers and one of them controls
half of the national market. The communications market has just three major
suppliers; the Canadian Football League has nine teams and there are just a
handful of major hardware/builders' suppliers stores nationally. At the
other end of the spectrum we have countless restaurants and fitness centres,
but they do not supply exactly the same product to the marketplaces for
'food' or 'health', and so these markets are not perfectly competitive,
despite the enormous number of participants.
In this chapter we will explore three broad topics: First is the
relationship between firm behaviour and firm size relative to the whole
sector. This comes broadly under the heading of imperfect
competition and covers a variety of market forms. Second, we will explore
the principle modern ideas in strategic behavior. In a sense all
decisions in microeconomics have an element of strategy to them - economic
agents aim to attain certain goals and they adopt specific maximizing
strategies to attain them. But in this chapter we explore a more specific
concept of strategic behavior - one that focuses upon direct interactions
between a small number of players in the market place. Third, we explore the
principle characteristics of what are termed matching' markets.
These are markets where transactions take place without money and involve
matching heterogeneous suppliers with heterogeneous buyers.
11.2 Imperfect competitors
Imperfect competitors can be defined by the number of firms in
their sector, or the share of total sales going to a small number of
suppliers. They can also be defined in terms of the characteristics of the demand curves they all face. A
perfect competitor faces a perfectly elastic demand at the existing market
price, and this is the only market structure to have this characteristic. In all
other market structures suppliers effectively face a downward-sloping
demand. This means that they have some influence on the price of the good,
and also that if they change the price they charge, they can expect demand
to reflect this in a predictable manner. So, in theory, we can classify all market
structures apart from perfect competition as being imperfectly competitive. In practice we use the term to denote firms that fall between the extremes of perfect competition and monopoly.
Imperfectly competitive firms face a downward-sloping demand curve, and their output price reflects the quantity sold.
The demand curve for the firm and industry coincide for the monopolist, but
not for other imperfectly competitive firms. It is convenient to categorize
the producing sectors of the economy as either having a relatively small
number of participants, or having a large number. The former market
structures are called oligopolistic, and the latter are called monopolistically competitive. The word oligopoly
comes from the Greek word oligos meaning few, and polein
meaning to sell.
Oligopoly defines a market with a small number of suppliers.
Monopolistic competition defines a market with many sellers of products that have similar characteristics. Monopolistically competitive firms can exert only a small influence on the whole market.
The home appliance industry is an oligopoly. The prices of KitchenAid appliances depend not only on their own output and sales, but also on the
prices of Whirlpool, Maytag and Bosch. If a firm
has just two main producers it is called a duopoly. Canadian National and Canadian Pacific are the only two major rail freight carriers
in Canada; they thus form a duopoly. In contrast, the local Italian restaurant is
a monopolistic competitor. Its output is a package of distinctive menu
choices, personal service, and convenience for local customers. It can
charge a different price than the out-of-neighbourhood restaurant, but if
its prices are too high local diners may travel elsewhere for their food
experience, or switch to a different cuisine locally. Many markets are defined by producers who supply similar but not
identical products. Canada's universities all provide degrees, but they differ one from another in their programs, their balance of
in-class and on-line courses, their student activities, whether they are
science based or liberal arts based, whether they have cooperative programs
or not, and so forth. While universities are not in the business of making
profit, they certainly wish to attract students, and one way of doing this
is to differentiate themselves from other institutions. The profit-oriented
world of commerce likewise seeks to increase its market share by
distinguishing its product line.
Duopoly defines a market or sector with just two firms.
These distinctions are not completely airtight. For example, if a sole
domestic producer is subject to international competition it cannot act in
the way we described in the previous chapter – it has potential, or actual,
competition. Bombardier may be Canada's sole rail car manufacturer,
but it is not a monopolist, even in Canada. It could best be described as
being part of an international oligopoly in rail-car manufacture. Likewise,
it is frequently difficult to delineate the boundary of a given market. For
example, is Canada Post a monopoly in mail delivery, or an
oligopolist in hard-copy communication? We can never fully remove these
ambiguities.
The role of cost structures
A critical determinant of market structure is the way in which demand and
cost interact to determine the likely number of market participants in a
given sector or market. Structure also evolves over the long run: Time is
required for entry and exit.
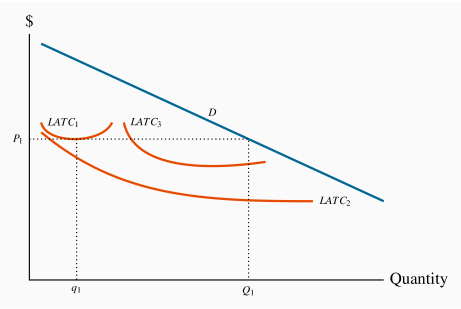
Figure 11.1 shows the demand curve D for
the output of an industry in the long run. Suppose, initially, that all
firms and potential entrants face the long-run average cost curve LATC1.
At the price P1, free entry and exit means that each firm produces q1.
With the demand curve D, industry output is Q1. The number of firms in
the industry is N1 (=Q1/q1). If q1, the minimum average cost
output on LATC1, is small relative to D, then N1 is large. This
outcome might be perfect competition (N virtually infinite), or
monopolistic competition (N large) with slightly differentiated products
produced by each firm.
Instead, suppose that the production structure in the industry is such that
the long-run average cost curve is LATC2. Here, scale economies are vast,
relative to the market size. At the lowest point on this cost curve, output
is large relative to the demand curve D. If this one firm were to act like
a monopolist it would produce an output where MR=MC in the long run and
set a price such that the chosen output is sold. Given the scale economies,
there may be no scope for another firm to enter this market, because such a
firm would have to produce a very high output to compete with the existing
producer. This situation is what we previously called a "natural"
monopolist.
Finally, the cost structure might involve curves of the type LATC3, which
would give rise to the possibility of several producers, rather than one or
very many. This results in oligopoly.
It is clear that one crucial determinant of market structure is
minimum efficient scale relative to the size of the total market as shown
by the demand curve. The larger the minimum efficient scale relative to
market size, the smaller is the number of producers in the industry.
11.3 Imperfect competitors: measures of structure and market power
Sectors of the economy do not fit neatly into the limited number of categories
described above. The best we can say in most cases is that they resemble
more closely one type of market than another. Consider the example of
Canada's brewing sector: It has two large brewers in Molson-Coors
and Labatt, a couple of intermediate sized firms such as
Sleeman, and an uncountable number of small boutique brew pubs. While such
a large number of brewers satisfy one requirement for perfect competition,
it would not be true to say that the biggest brewers wield no market power;
and this is the most critical element in defining market structure.
By the same token, we could not define this market as a duopoly: Even though
there are just two major participants, there are countless others who,
together, are important.
One way of defining what a particular structure most closely resembles is to
examine the percentage of sales in the market that is attributable to a small number
of firms. For example: What share is attributable to the largest three or
four firms? The larger the share, the more concentrated the market
power. Such a statistic is called a concentration ratio. The N-firm concentration ratio is the sales share of the largest
N firms in that sector of the economy.
The N-firm concentration ratio is the sales share of the largest N firms in that sector of the economy.
Table 11.1 Concentration in Canadian food processing 2011
|
Sector | % of shipments |
|
Sugar | 98 |
|
Breakfast cereal | 96 |
|
Canning | 60 |
|
Meat processing | 23 |
Source: "Four Firm Concentration Ratios (CR4s) for selected food processing sectors," adapted from Statistics Canada publication Measuring industry concentration in Canada's food processing sectors, Agriculture and Rural Working Paper series no. 70, Catalogue 21-601,
http://www.statcan.gc.ca/pub/21-601-m/21-601-m2004070-eng.pdf.
Table 11.1 contains information on the 4-firm
concentration ratio for several sectors of the Canadian economy. It
indicates that, at one extreme, sectors such as breakfast cereals and sugars
have a high degree of concentration, whereas meat processing has much less.
A high degree of concentration suggests market power, and possibly economies
of scale.
11.4 Imperfect competition: monopolistic competition
Monopolistic competition presumes a large number of quite small producers or
suppliers, each of whom may have a slightly differentiated
product. The competition element of this name signifies that there are many
participants, while the monopoly component signifies that each supplier
faces a downward-sloping demand. In concrete terms, your local coffee shop
that serves "fair trade" coffee has a product that differs slightly from
that of neighbouring shops that sell the traditional product. They coexist
in the same sector, and probably charge different prices: The fair trade
supplier likely charges a higher price, but knows nonetheless that too large
a difference between her price and the prices of her competitors will see
some of her clientele migrate to those lower-priced establishments. That is
to say, she faces a downward-sloping demand curve.
The competition part of the name also indicates that there is free
entry and exit. There are no barriers to entry. As a consequence, we know
at the outset that only normal profits will exist in a long-run equilibrium.
Economic profits will be competed away by entry, just as losses will erode
due to exit.
As a general rule then, each firm can influence its market share to some
extent by changing its price. Its demand curve is not horizontal because
different firms' products are only limited substitutes. A lower price level
may draw some new customers away from competitors, but convenience or taste
will prevent most patrons from deserting their local businesses. In concrete
terms: A pasta special at the local Italian restaurant that reduces the
price below the corresponding price at the competing local Thai restaurant
will indeed draw clients away from the latter, but the foods are
sufficiently different that only some customers will leave the Thai
restaurant. The differentiated menus mean that many customers will continue
to pay the higher price.
A differentiated product is one that differs slightly from other products in the same market.
Given that there are very many firms, the theory also envisages limits to
scale economies. Firms are small and, with many competitors, individual
firms do not compete strategically with particular rivals. Because
the various products offered are slightly differentiated, we avoid graphics
with a market demand, because this would imply that a uniform
product is being considered. At the same time the market is a well-defined
concept—it might be composed of all those restaurants within a reasonable
distance, for example, even though each one is slightly different from the
others. The market share of each firm depends on the price that it charges
and on the number of competing firms. For a given number of
suppliers, a shift in industry demand also shifts the demand facing each
firm. Likewise, the presence of more firms in the industry reduces the
demand facing each one.
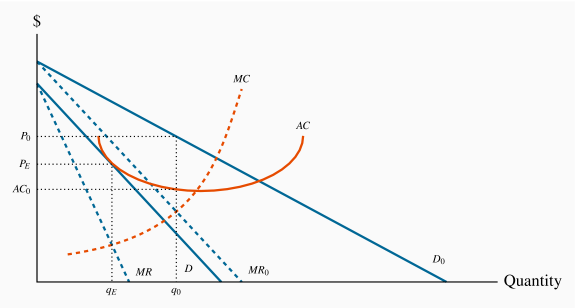
Equilibrium is illustrated in Figure 11.2. Here
D0 is the initial demand facing a representative firm, and MR0 is the
corresponding marginal revenue curve. Profit is maximized where MC=MR, and
the price P0 is obtained from the demand curve corresponding to the
output q0. Total profit is the product of output times the difference
between price and average cost, which equals  .
.
With free entry, such profits attract new firms. The increased number of
firms reduces the share of the market that any one firm can claim. That is,
the firm's demand curve shifts inwards when entry occurs. As long as
(economic) profits exist, this process continues. For entry to cease,
average cost must equal price. A final equilibrium is illustrated by the
combination  , where the demand has shifted inward to D.
At this long-run equilibrium, two conditions must hold: First, the optimal
pricing rule must be satisfied—that is MC=MR; second it must be the case
that only normal profits are made at the final equilibrium. Economic profits
are competed away as a result of free entry. Graphically this implies that ATC must equal
price at the output where MC=MR. In turn this implies that the ATC is
tangent to the demand curve where P=ATC. While this could be proven
mathematically, it is easy to intuit why this tangency must exist: If ATC
merely intersected the demand curve at the output where MC=MR, we could
find some other output where the demand price would be above ATC,
suggesting that profits could be made at such an output. Clearly that could
not represent an equilibrium.
The monopolistically competitive equilibrium in the long run requires the firm's demand curve to be tangent to the ATC curve at the output where MR=MC.
11.5 Imperfect competition: economies of scope and platforms
The communications revolution has impacted market structure in modern
economies profoundly: it has facilitated economies of scope, meaning that
firms may yield more collective profit if merged than if operating
independently.
Economies of Scope
Imagine an aspiring entrepreneur who envisages a revolution of the
traditional taxi sector of the economy. He decides to develop a smartphone
application that will match independent income-seeking vehicle owners
(drivers) with individuals seeking transport (passengers) from point A to
point B. We know how this adventure evolves. In one case it takes the form
of the corporation Uber, in another the corporation Lyft, and others
worldwide.
These corporations have grown in leaps and bounds and have taken business
from the conventional taxi corporations. As of 2019 they cannot turn a
profit, yet the stock market continues to bet upon future success: investors
believe that when these corporations evolve into fully integrated
multi-product suppliers, both costs will decline and demand will increase
for each component of the business. In the case of transportation companies,
they aim to become a 'one-stop-shop' for mobility services. Uber is not only
a ride-hailing service, it also transports meals through its Uber-eats
platform, and is developing the electric scooter and electric bike markets
in addition. In some local markets it is linked to public transport
services. All of this is being achieved through a single smartphone
application. The objective is to simplify movement for persons, by providing
multiple options on a variety of transport modes, accessed through a single
portal.
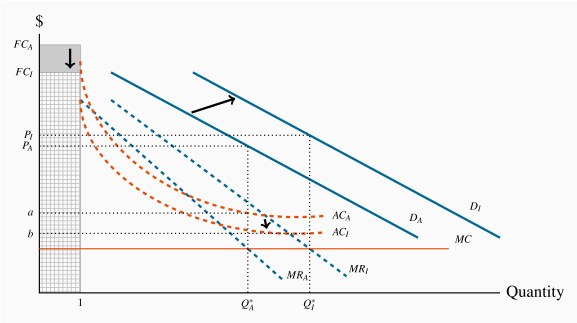
This phenomenon is described in Figure 11.3. The subscripts A and I
represent market conditions when the service supplier is operating Alone or
in an Integrated corporation. The initial equilibrium is defined by the A
demand and cost conditions. The profit maximizing output occurs when  , leading to a price
  and a quantity
  .
Each unit of the good yields a profit margin of
.
Each unit of the good yields a profit margin of  .
.
This firm now merges with another transportation corporation - perhaps a
food delivery service, perhaps an electric bike service. Since each firm has
a similar type of fixed cost, these costs can be reduced by the merger. In
technical terms, the merged firms, or merged operations, share a common
hardware-cum-software platform. Each firm will therefore incur
lower average costs, even if marginal costs remain unchanged: the AC curve
declines to  . In addition to the decline in average costs, each firm
sees an increase in its customer base, because transportation service buyers
find it preferable to choose their mode of transport through a single portal
rather than through several different modes of access. This is represented
by an outward shift in the demand curve for vehicle rides to
. In addition to the decline in average costs, each firm
sees an increase in its customer base, because transportation service buyers
find it preferable to choose their mode of transport through a single portal
rather than through several different modes of access. This is represented
by an outward shift in the demand curve for vehicle rides to  .
.
The new profit maximizing equilibrium occurs at  Total
profit necessarily increases both because average costs have fallen and the
number of buyers willing to buy at any price has risen. The analytics in
this figure also describe the benefits accruing to the other firm or firms
in the merger.
Total
profit necessarily increases both because average costs have fallen and the
number of buyers willing to buy at any price has risen. The analytics in
this figure also describe the benefits accruing to the other firm or firms
in the merger.
A platform describes a technology that is common to more than one product in a multi-product organization.
We conclude from this analysis that, if scope economies are substantial, it
may be difficult for stand-alone firms specializing in just one component of
the transportation services sector to remain profitable. It may also be
impossible to define a conventional equilibrium in this kind of marketplace.
This is because some conglomerate firms may have different component
producers in their suite of firms. For example, Lyft may not have a food
delivery service, but it may have a limousine or bus service. What is
critical for an equilibrium is that firms of a particular type, whether they
are part of a conglomerate or not, be able to compete with corresponding
firms. This means that their cost structure must be similar.
As a further example: Amazon initially was primarily an on-line book seller.
But it expanded to include the sale of other products. And once it became a
'market for everything' the demand side of the market exploded in parallel
with the product line, because it becomes easy to shop for 'anything' or
even different objects on a single site. Only Walmart, in North America,
comes close to being able to compete with Amazon.
11.6 Strategic behaviour: Oligopoly and games
Under perfect competition or monopolistic competition, there are so many
firms in the industry that each one can ignore the immediate effect of its
own actions on particular rivals. However, in an oligopolistic industry
each firm must consider how its actions affect the decisions of its
relatively few competitors. Each firm must guess how its rivals will react.
Before discussing what constitutes an intelligent guess, we investigate
whether they are likely to collude or compete. Collusion is a
means of reducing competition with a view to increasing profit.
Collusion is an explicit or implicit agreement to avoid competition with a view to increasing profit.
A particular form of collusion occurs when firms co-operate to form a
cartel, as we saw in the last chapter. Collusion is more difficult if there
are many firms in the industry, if the product is not standardized, or if
demand and cost conditions are changing rapidly. In the absence of
collusion, each firm's demand curve depends upon how competitors react: If
Air Canada contemplates offering customers a seat sale on a particular
route, how will West Jet react? Will it, too, make the same offer to buyers?
If Air Canada thinks about West Jet's likely reaction, will it go ahead with
the contemplated promotion? A conjecture is a belief that one
firm forms about the strategic reaction of another competing firm.
A conjecture is a belief that one firm forms about the strategic reaction of another competing firm.
Good poker players will attempt to anticipate their opponents' moves or
reactions. Oligopolists are like poker players, in that they try to
anticipate their rivals' moves. To study interdependent decision making, we
use game theory. A game is a situation in which contestants
plan strategically to maximize their payoffs, taking account of rivals'
behaviour.
A game is a situation in which contestants plan strategically to maximize their payoffs, taking account of rivals' behaviour.
The players in the game try to maximize their own payoffs.
In an oligopoly, the firms are the players and their payoffs are their
profits. Each player must choose a strategy, which is a plan
describing how a player moves or acts in different situations.
A strategy is a game plan describing how a player acts, or moves, in each possible situation.
Equilibrium outcomes
How do we arrive at an equilibrium in these games? Let us begin by defining
a commonly used concept of equilibrium. A Nash equilibrium is
one in which each player chooses the best strategy, given the strategies
chosen by the other players, and there is no incentive to move or change
choice.
A Nash equilibrium is one in which each player chooses the best strategy, given the strategies chosen by the other player, and there is no incentive for any player to move.
In such an equilibrium, no player wants to change strategy, since the other
players' strategies were already figured into determining each player's own
best strategy. This concept and theory are attributable to the Princeton
mathematician John Nash, who was popularized by the Hollywood movie version
of his life, A Beautiful Mind.
In most games, each player's best strategy depends on the strategies chosen
by their opponents. Occasionally, a player's best strategy
is independent of those chosen by rivals. Such a strategy is called a
dominant strategy.
A dominant strategy is a player's best strategy, independent of the strategies adopted by rivals.
We now illustrate these concepts with the help of two different games. These
games differ in their outcomes and strategies. Table 11.2
contains the domestic happiness game. Will
and Kate are attempting to live in harmony, and their happiness depends upon
each of them carrying out domestic chores such as shopping, cleaning and
cooking. The first element in each pair defines Will's outcome, the second
Kate's outcome. If both contribute to domestic life they each receive a
happiness or utility level of 5 units. If one contributes and the other does
not the happiness levels are 2 for the contributor and 6 for the
non-contributor, or 'free-rider'. If neither contributes happiness levels
are 3 each. When each follows the same strategy the payoffs are on the
diagonal, when they follow different strategies the payoffs are on the
off-diagonal. Since the elements of the table define the payoffs resulting
from various choices, this type of matrix is called a payoff
matrix.
A payoff matrix defines the rewards to each player resulting from particular choices.
So how is the game likely to unfold? In response to Will's choice of a
contribute strategy, Kate's utility maximizing choice involves lazing: She
gets 6 units by not contributing as opposed to 5 by contributing. Instead,
if Will decides to be lazy what is in Kate's best interest? Clearly it is to
be lazy also because that strategy yields 3 units of happiness compared to 2
units if she contributes. In sum, Kate's best strategy is to be lazy,
regardless of Will's behaviour. So the strategy of not contributing is a
dominant strategy, in this particular game.
Will also has a dominant strategy – identical to Kate's. This is not
surprising since the payoffs are symmetric in the table. Hence, since each
has a dominant strategy of not contributing the Nash equilibrium is in the
bottom right cell, where each receives a payoff of 3 units. Interestingly,
this equilibrium is not the one that yields maximum combined happiness.
Table 11.2 A game with dominant strategies
|
| | Kate's choice |
|
| | Contribute | Laze |
|
Will's choice | Contribute | 5,5 | 2,6 |
| Laze | 6,2 | 3,3 |
The first element in each cell denotes the payoff or utility to Will; the second element the utility to Kate.
The reason that the equilibrium yields less utility for each player in this
game is that the game is competitive: Each player tends to their own
interest and seeks the best outcome conditional on the choice of the other
player. This is evident from the (5,5) combination. From this position
Kate would do better to defect to the Laze strategy, because her utility
would increase.
To summarize: This game has a unique equilibrium and each player has a
dominant strategy. But let us change the payoffs just slightly to the values
in Table 11.3. The off-diagonal elements have changed.
The contributor now gets no utility as a result of his or her contributions:
Even though the household is a better place, he or she may be so annoyed
with the other person that no utility flows to the contributor.
Table 11.3 A game without dominant strategies
|
| | Kate's choice |
|
| | Contribute | Laze |
|
Will's choice | Contribute | 5,5 | 0,4 |
| Laze | 4,0 | 3,3 |
The first element in each cell denotes the payoff or utility to Will; the second element the utility to Kate.
What are the optimal choices here? Starting again from Will choosing to
contribute, what is Kate's best strategy? It is to contribute: She gets 5
units from contributing and 4 from lazing, hence she is better contributing.
But what is her best strategy if Will decides to laze? It is to laze,
because that yields her 3 units as opposed to 0 by contributing. This set of
payoffs therefore contains no dominant strategy for either player.
As a result of there being no dominant strategy, there arises the
possibility of more than one equilibrium outcome. In fact there are two
equilibria in this game now: If the players find themselves both
contributing and obtaining a utility level of (5,5) it would not be
sensible for either one to defect to a laze option. For example, if Kate
decided to laze she would obtain a payoff of 4 utils rather than the 5 she
enjoys at the (5,5) equilibrium. By the same reasoning, if they find
themselves at the (laze, laze) combination there is no incentive to move to
a contribute strategy.
Once again, it is to be emphasized that the twin equilibria emerge in a
competitive environment. If this game involved cooperation or collusion the
players should be able to reach the (5,5) equilibrium rather than the
(3,3) equilibrium. But in the competitive environment we cannot say
ex ante which equilibrium will be attained.
Repeated games
This game illustrates the tension between collusion and competition. While
we have developed the game in the context of the household, it can equally
be interpreted in the context of a profit maximizing game between two market
competitors. Suppose the numbers define profit levels rather than utility as
in Table 11.4. The 'contribute' option can be
interpreted as 'cooperate' or 'collude', as we described for a cartel in the
previous chapter. They collude by agreeing to restrict output, sell that
restricted output at a higher price, and in turn make a greater total profit
which they split between themselves. The combined best profit outcome
(5,5) arises when each firm restricts its output.
Table 11.4 Collusion possibilities
|
| | Firm K's profit |
|
| | Low output | High output |
|
Firm W's profit | Low output | 5,5 | 2,6 |
| High output | 6,2 | 3,3 |
The first element in each cell denotes the profit to Firm W; the second element the profit to Firm K.
But again there arises an incentive to defect: If Firm W agrees to maintain
a high price and restrict output, then Firm K has an incentive to renege and
increase output, hoping to improve its profit through the willingness of
Firm W to restrict output. Since the game is symmetric, each firm has an
incentive to renege. Each firm has a dominant strategy – high output, and
there is a unique equilibrium (3,3).
Obviously there arises the question of whether these firms can find an
operating mechanism that would ensure they each generate a profit of 5 units
rather than 3 units, while remaining purely self-interested. This question
brings us to the realm of repeated games. For example,
suppose that firms make strategic choices each quarter of the year. If firm
K had 'cheated' on the collusive strategy it had agreed with firm W in the
previous quarter, what would happen in the following quarter? Would firms
devise a strategy so that cheating would not be in the interest of either
one, or would the competitive game just disintegrate into an unpredictable
pattern? These are interesting questions and have provoked a great deal of
thought among game theorists. But they are beyond our scope at the present
time.
A repeated game is one that is repeated in successive time periods and where the knowledge that the game will be repeated influences the choices and outcomes in earlier periods.
We now examine what might happen in one-shot games of the type we have been
examining, but in the context of many possible choices. In particular,
instead of assuming that each firm can choose a high or low output, how
would the outcome of the game be determined if each firm can choose an
output that can lie anywhere between a high and low output? In terms of the
demand curve for the market, this means that the firms can choose some
output and price that is consistent with demand conditions: There may be an
infinite number of choices. This framing of a game enables us to explore new
concepts in strategic behavior.
11.7 Strategic behaviour: Duopoly and Cournot games
The duopoly model that we frequently use in economics to analyze competition
between a small number of competitors is fashioned after the ideas of French
economist Augustin Cournot. Consequently it has come to be known as the Cournot duopoly model. While the maximizing behaviour that is
incorporated in this model can apply to a situation with several firms
rather than two, we will develop the model with two firms. This differs
slightly from the preceding section, where each firm has simply a choice
between a high or low output.
The critical element of the Cournot approach is that the firms each
determine their optimal strategy – one that maximizes profit – by reacting
optimally to their opponent's strategy, which in this case involves their
choice of output.
Cournot behaviour involves each firm reacting optimally in their choice of output to their competitors' output decisions.
A central element here is the reaction function of each firm,
which defines the optimal output choice conditional upon their opponent's
choice.
Reaction functions define the optimal choice of output conditional upon a rival's output choice.
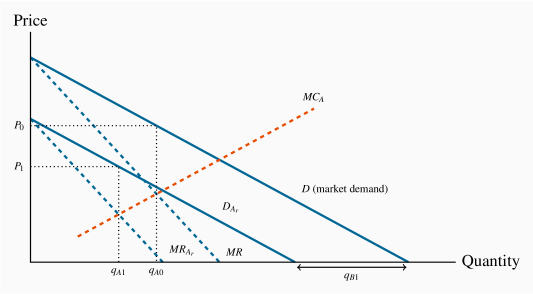
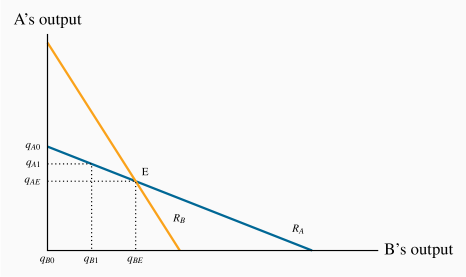
We can develop an optimal strategy with the help of Figure 11.4.
D is the market demand, and two firms supply this
market. If B supplies a zero output, then A would face the whole demand,
and would maximize profit where MC=MR. Let this output be defined by
 . We transfer this output combination to Figure 11.5,
where the output of each firm is on one of the axes—A on the vertical
axis and B on the horizontal. This particular combination of zero output
for B and for A is represented on the vertical axis as the
point .
. We transfer this output combination to Figure 11.5,
where the output of each firm is on one of the axes—A on the vertical
axis and B on the horizontal. This particular combination of zero output
for B and for A is represented on the vertical axis as the
point .
Instead, suppose that B produces a quantity  in Figure 11.4.
This reduces the demand curve facing A
correspondingly from D to
in Figure 11.4.
This reduces the demand curve facing A
correspondingly from D to  , which we call A's residual demand. When subject to such a choice by B, firm A maximizes
profit by producing where
, which we call A's residual demand. When subject to such a choice by B, firm A maximizes
profit by producing where  , where
  is the
marginal revenue corresponding to the residual demand . The
optimum for A is now
is the
marginal revenue corresponding to the residual demand . The
optimum for A is now  , and this pair of outputs is represented by
the combination
, and this pair of outputs is represented by
the combination  in Figure 11.5.
Firm A forms a similar optimal response for every possible output level
that B could choose, and these responses define A's reaction
function. The reaction function illustrated for A in Figure 11.5
is thus the locus of all optimal response outputs on the
part of A. The downward-sloping function makes sense: The more B
produces, the smaller is the residual market for A, and therefore the less
A will produce.
But A is just one of the players in the game. If B acts in the same
optimizing fashion, B too can formulate a series of optimal reactions to
A's output choices. The combination of such choices would yield a
reaction function for B. This is plotted as  in Figure 11.5.
An equilibrium is defined by the intersection of the two reaction functions,
in this case by the point E. At this output level each firm is
making an optimal decision, conditional upon the choice of its opponent.
Consequently, neither firm has an incentive to change its output; therefore
it can be called the Nash equilibrium.
Any other combination of outputs on either reaction function would lead one
of the players to change its output choice, and therefore could not
constitute an equilibrium. To see this, suppose that B produces an output
greater than  ; how will A react? A's reaction function
indicates that it should choose a quantity to supply less than
; how will A react? A's reaction function
indicates that it should choose a quantity to supply less than  . If
so, how will B respond in turn to that optimal choice? It responds with a
quantity read from its reaction function, and this will be less than the
amount chosen at the previous stage. By tracing out such a sequence of
reactions it is clear that the output of each firm will move to the
equilibrium
. If
so, how will B respond in turn to that optimal choice? It responds with a
quantity read from its reaction function, and this will be less than the
amount chosen at the previous stage. By tracing out such a sequence of
reactions it is clear that the output of each firm will move to the
equilibrium  .
.
Application Box 11.1 Cournot: Fixed costs and brand
Why do we observe so many industries on the national, and even international, stages with only a handful of firms? For example, Intel produces more than half of the world's computer chips, and AMD produces a significant part of the remainder. Why are there only two major commercial aircraft producers in world aviation – Boeing and Airbus? Why are there only a handful of major North American suppliers in pharmaceuticals, automobile tires, soda pop, internet search engines and wireless telecommunications?
The answer lies primarily in the nature of modern product development. Product development (fixed) costs, coupled with a relatively small marginal cost of production, leads to markets where there is enough space for only a few players. The development cost for a new cell phone, or a new aircraft, or a new computer-operating system may run into billions, while the cost of producing each unit may in fact be constant. The enormous development cost associated with many products explains not only why there may be a small number of firms in the domestic market for the product, but also why the number of firms in some sectors is small worldwide.
The Cournot model yields an outcome that lies between monopoly (or
collusion/cartel) and competitive market models. It does not necessarily
assume that the firms are identical in terms of their cost structure,
although the lower-cost producer will end up with a larger share of the market.
The next question that arises is whether this duopoly market will be
sustained as a duopoly, or if entry may take place. In particular, if
economic profits accrue to the participants will such profits be competed
away by the arrival of new producers, or might there be barriers of either a
'natural' or 'constructed' type that operate against new entrants?
11.8 Strategic behaviour: Entry, exit & potential competition
At this point we inquire about the potential entry and impact of new firms
– firms who might enter the industry if conditions were sufficiently
enticing, meaning the presence of economic profits. One way of examining
entry in this oligopolistic world is to envisage potential entry barriers as
being either intended or unintended, though the difference between the two
can be blurred. Broadly, an unintended or 'natural' barrier is one related
to scale economies and the size of the market. An intended barrier involves
a strategic decision on the part of the firm to prevent entry.
Unintended entry barriers
Oligopolists tend to have substantial fixed costs, accompanied by declining
average costs up to high output levels. Such a cost structure
'naturally' gives rise to a supply side with a small number of suppliers.
For examples, given demand and cost structures, could Vancouver support two
professional soccer teams; could Calgary support two professional hockey
teams; could Montreal sustain two professional football teams? The answer to
each of these questions is likely 'no'. Because given the cost structure of
these markets, it would not be possible to induce twice as many spectators
without reducing the price per game ticket to such a degree that revenue
would be insufficient to cover costs. (We will neglect for the moment that
the governing bodies of these sports also have the power to limit entry.)
Fixed costs include stadium costs, staff payrolls and player payrolls. In
fact most costs in these markets are relatively fixed. Market size relative
to fixed and variable costs is not large enough to sustain two teams in most
cities. Exceptions in reality are huge urban areas such as New York and Los
Angeles.
Accordingly, it is possible that the existing team, or teams, may earn
economic profit from their present operation; but such profit does not
entice further entry, because the market structure is such that the entry of
an additional team could lead to each team making losses.
Intended entry barriers
Patent Law
This is one form of protection for incumbent firms. Research
and development is required for the development of many products in the
modern era. Pharmaceuticals are an example. If innovations were not
protected, firms and individuals would not be incentivized to devote their
energies and resources to developing new drugs. Society would be poorer as a
result. Patent protection is obviously a legal form of protection. At the same time, patent
protection can be excessive. If patents provide immunity from replication or
copying for an excessive period of time - for longer than required to recoup
R & D costs - then social welfare declines because monopoly profits are
being generated as a result of output restriction at too high a price.
Advertising
Advertising is a second form of entry deterrence. In this instance
firms attempt to market their product as being distinctive and even
enviable. For example, Coca-Cola and PepsiCo invest
hundreds of millions annually to project their products in this light. They
sponsor sports, artistic and cultural events. Entry into the cola business
is not impossible, but brand image is so strong for these firms that
potential competitors would have a very low probability of entering this
sector profitably. Likewise, in the 'energy-drinks' market, Red Bull
spends hundreds of millions of dollars per annum on Formula One racing, kite
surfing contests, mountain biking events and other extreme sports. In doing
this it it reinforcing its brand image and distinguishing its product from
Pepsi or Coca-Cola. This form of advertising is one of product
differentiation and enables the manufacturer to maintain a higher price for
its products by convincing its buyers that there are no close substitutes.
Predatory pricing
This form of pricing constitutes an illegal form of entry deterrence. It
involves an incumbent charging an artificially low price for its product in
the event of entry of a new competitor. This is done with a view to making
it impossible for the entrant to earn a profit. Given that incumbents have
generally greater resources than entrants, they can survive a battle of
losses for a more prolonged period, thus ultimately driving out the entrant.
An iconic example of predatory pricing is that of Amazon deciding to take on
a startup called Quidsi that operated the website diapers.com.
The latter was proving to be a big hit with consumers in 2009 and Amazon
decided that it was eating into Amazon profits on household and baby
products. Amazon reacted by cutting its own prices dramatically, to the
point where it was ready to loose a huge amount of money in order to grind
Quidsi into the ground. The ultimate outcome was that Quidsi capitulated
and sold to Amazon.
Whether this was a legal tactic or not we do not know, but it underlines the
importance of war chests.
Maintaining a war chest
Many large corporations maintain a mountain of cash. This might seem like an
odd thing to do when it could be paying that cash out to owners in the form
of dividends. But there are at least two reasons for not doing this. First,
personal taxes on dividends are frequently higher than taxes on capital
gains; accordingly if a corporation can transform its cash into capital gain
by making judicious investments, that strategy ultimately yields a higher
post-tax return to the stock holders. A second reason is that a cash war
chest serves as a credible threat to competitors of the type described
involving Amazon and Quidsi above.
Network externalities
These externalities arise when the existing number of buyers
itself influences the total demand for a product. Facebook is now a
classic example. An individual
contemplating joining a social network has an incentive to join one where
she has many existing 'friends'. Not everyone views the Microsoft
operating system (OS) as the best. Many prefer a simpler system such as
Linux that also happens to be free. However, the fact that almost
every new computer (that is not Apple) coming onto the market place
uses Microsoft OS, there is an incentive for users to continue to use it
because it is so easy to find a technician to repair a breakdown.
Transition costs and loyalty cards
Transition costs can be erected by firms who do not wish to lose
their customer base. Cell-phone plans are a good example.
Contract-termination costs are one obstacle to moving to a new supplier.
Some carriers grant special low rates to users communicating with other
users within the same network, or offer special rates for a block of users
(perhaps within a family). Tim Hortons and other coffee chains offer loyalty cards that give
one free cup of coffee for every eight purchased. These suppliers are not
furnishing love to their caffeine consumers, they are providing their
consumers with an incentive not to switch to a competing supplier. Air miles
rewards operate on a similar principle. So too do loyalty cards for hotel
chains.
How do competitors respond to these loyalty programs? Usually by offering
their own. Hilton and Marriot each compete by offering a free night after a
given points threshold is reached.
Over-investment
An over-investment strategy means that an existing supplier
generates additional production capacity through investment in new plant or
capital. This is costly to the incumbent and is intended as a signal to any
potential entrant that this capacity could be brought on-line immediately
should a potential competitor contemplate entry. For example, a ski-resort
owner may invest in a new chair-lift, even if she does not use it frequently. The
existence of the additional capacity may scare potential entrants. A key
component of this strategy is that the incumbent firm invests ahead of time
– and inflicts a cost on itself. The incumbent does not simply say "I will
build another chair-lift if you decide to develop a nearby mountain into a
ski hill." That policy does not carry the same degree of credibility as
actually incurring the cost of construction ahead of time. However, such a
strategy may not always be feasible: It might be just too costly to pre-empt
entry by putting spare capacity in place. Spare capacity is not so different
from brand development through advertising; both are types of sunk cost. The
threats associated with the incumbent's behaviour become a credible threat because the incumbent incurs costs up front.
A credible threat is one
that is effective in deterring specific behaviours; a competitor must
believe that the threat will be implemented if the competitor behaves in a
certain way.
Lobbying
In our chapter on monopoly we stressed the role of political/lobbying
activity. Large firms invariably employ public relations firms, and maintain
their own public relations departments. The role of these units is not
simply to portray a positive image of the corporation to the public; it is
to maintain and increase whatever market power such firms already possess.
It is as much in the interest of an oligopolistic firm as a monopolist to
prevent entry and preserve supernormal profits.
In analyzing perfect competition, we saw that free entry is critical to
maintaining normal profits. Lobbying is designed to obstruct entry, and it
is also designed to facilitate mergers and acquisitions. The economist
Thomas Philippon has written about the increasing concentration of economic
power in recent decades in the hands of a small number of corporations in
many sectors of the North American economy. He argues that this
concentration of power contributes to making the distribution of income more
favorable to corporate interests and less favorable to workers. In his
recent book ("The Great Reversal: How America Gave up Free
Markets" ), he shows that, contrary to traditional beliefs,
Europe is now much more competitive than the US in most sectors of the
economy. More broadband suppliers result in rates in Europe that are about
half of US rates. Whereas in the US four airlines control 80% of the
market, In Europe they control 40%. If scale economies were the prime
determinant of corporate concentration we should not expect such large
differences. Likewise, if globalization and technological change were the
main determinants of corporate concentration, we should expect experiences in
Europe and North America to be similar. But they are not. Hence, it is
reasonable to conclude that entry barriers in North America are more
effective, or that regulatory forces are stronger in Europe.
11.9 Matching markets: design
Markets are institutions that facilitate the exchange of goods and services.
They act as clearing houses. The normal medium of exchange is money in some form.
But many markets deal in exchanges that do not involve money and frequently
involve matching: Graduating medical students are normally matched with
hospitals in order that graduates complete their residency requirement; in
many jurisdictions in the US applicants for places in public schools that
form a pool within a given school-board must go through an application
process that sorts the applicants into the different schools within the
board; patients in need of a new kidney must be matched with kidney donors.
These markets are clearinghouses and have characteristics that distinguish
them from traditional currency-based markets that we have considered to this point.
The good or service being traded is generally heterogeneous.
For example, patients in search of a kidney donor must be medically
compatible with the eventual donor if the organ transplant is not to be
rejected. Hospitals may seek residents in particular areas of health, and
they must find residents who are, likewise, seeking such placements. Students
applying to public schools may be facing a choice between schools that focus
upon science or upon the arts. Variety is key.
Frequently the idea of a market that is mediated by money is repugnant. For example, the only economy in the world that permits the sale
of human organs is Iran. Elsewhere the idea of a monetary payment for a
kidney is unacceptable. A market in which potential suppliers of kidneys
registered their reservation prices and demanders registered their
willingness to pay is incompatible with our social mores. Consequently,
potential living donors or actual deceased donors must be directly
matched with a patient in need. While some individuals believe
that a market in kidneys would do more good than harm, because a monetary
payment might incentivize the availability of many more organs and therefore
save many more lives, virtually every society considers the downside to such
a trading system to outweigh the benefits.
Modern matching markets are more frequently electronically
mediated, and the communications revolution has led to an increase in the
efficiency of these markets.
The Economics prize in memory of Alfred Nobel was awarded to Alvin Roth and
Lloyd Shapley in 2011 in recognition of their contributions to designing
markets that function efficiently in the matching of demanders and suppliers
of the goods and services. What do we mean by an efficient mechanism? One
way is to define it is similar to how we described the market for apartments
in Chapter 5: following an equilibrium in the market, is it possible to
improve the wellbeing of one participant without reducing the wellbeing of
another? We showed in that example that the market performed efficiently: a
different set of renters getting the apartments would reduce total surplus
in the system.
Consider a system in which medical graduates are matched with hospitals, and
the decision process results in the potential for improvement: Christina
obtains a residency in the local University Hospital while Ulrich obtains a
residency at the Childrens' Hospital. But Christina would have preferred the
Childrens' and Ulrich would have preferred the University. The matching
algorithm here was not efficient because, at the end of the allocation
process, there is scope for gains for each individual. Alvin Roth devised a matching mechanism
that surmounts this type of inefficiency. He called it the deferred
acceptance algorithm.
Roth also worked on the matching of kidney donors to individuals in need of
a kidney. The fundamental challenge in this area is that a patient in need
of a kidney may have a family member, say a sibling, who is willing to
donate a kidney, but the siblings are not genetically compatible. The
patient's immune system may attack the implantation of a 'foreign' organ.
One solution to this incompatibility is to find matching pairs of donors
that come from a wider choice set. Two families in each of which there is patient
and a donor may be able to cross-donate: donor in Family A can donate to
patient in Family B, and donor in Family B can donate to patient in Family
A, in the sense that the donor organs will not be rejected by recipients'
immune systems. Hence if many patient-donor families register in a
clearinghouse, a computer algorithm can search for matching pairs.
Surgical operations may be performed simultaneously in order to prevent one donor from
backing out following his sibling's receipt of a kidney.
A more recent development concerns 'chains'. In this case a good Samaritan
('unaligned donor') offers a kidney while seeking nothing in return. The
algorithm then seeks a match for the good Samaritan's kidney among all of
the recipient-donor couples registered in the data bank. Having found (at
least) one, the algorithm seeks a recipient for the kidney that will come
from the first recipient's donor partner. And so on. It turns out that an
algorithm which seeks to maximize the potential number of participating
pairs is fraught with technical and ethical challenges: should a young
patient, who could benefit from the organ for a whole lifetime, get priority
over an older patient, who will benefit for fewer years of life, even if the
older patient is in greater danger of dying in the absence of a transplant?
This is an ethical problem.
Examples where these algorithms have achieved more than a dozen linked
transplants are easy to find on an internet search - they are called chains, for the obvious reason.
Consider the following efficiency aspect of the exchange. Suppose a patient
has two siblings, each of whom is willing to donate (though only one of the
two actually will); should such a patient get priority in the computer
algorithm over a patient who has just a single sibling willing to donate?
The answer may be yes; the dual donor patient should get priority
because if his two siblings have different blood types, this greater variety
on the supply side increases the chances for matching in the system as a
whole and is therefore beneficial. If a higher priority were not given to
the dual-donor patient, there would be an incentive for him to name just one
potential donor, and that would impact the efficiency of the whole matching
algorithm.
It is not always recognized that the discipline of Economics explores social
problems of the nature we have described here, despite the fact that the
discipline has developed the analytical tools to address them.
Conclusion
Monopoly and perfect competition are interesting paradigms; but few markets
resemble them in the real world. In this chapter we addressed some of the
complexities that define the economy we inhabit: It is characterized by
strategic planning, entry deterrence, differentiated products and so forth.
Entry and exit are critical to competitive markets. Frequently entry is
blocked because of scale economies – an example of a natural or unintended
entry barrier. In addition, incumbents can formulate numerous strategies to limit
entry.
Firms act strategically – particularly when there are just a few
participants in the market. Before acting, firms make conjectures about how
their competitors will react, and incorporate such reactions into their own
planning. Competition between suppliers can frequently be analyzed in terms
of a game, and such games usually have an equilibrium outcome. The Cournot
duopoly model that we developed is a game between two competitors in which
an equilibrium market output is determined from a pair of reaction functions.
Scale economies are critical. Large development costs or setup costs may mean
that the market can generally support just a limited number of producers. In
turn this implies that potential new (small-scale) firms cannot benefit from
the scale economies and will not survive competition from large-scale
suppliers.
Product differentiation is critical. If small differences exist
between products produced in markets where there is free entry we get a
monopolistically competitive structure. In these markets long-run profits
are 'normal' and firms operate with some excess capacity. It is not possible
to act strategically in this kind of market.
The modern economy also has sectors that have successfully erected barriers.
These barriers lead to fewer competitors than could efficiently supply the
market. Ultimately the owners of capital are the beneficiaries of these
barriers and consumers suffer from higher prices.
Key Terms
Imperfectly competitive firms face a downward-sloping demand curve, and their output price reflects the quantity sold.
Oligopoly defines an industry with a small number of suppliers.
Monopolistic competition defines a market with many sellers of products that have similar characteristics. Monopolistically competitive firms can exert only a small influence on the whole market.
Duopoly defines a market or sector with just two firms.
Concentration ratio: N-firm concentration ratio is the sales share of the largest N firms in that sector of the economy.
Differentiated product is one that differs slightly from other products in the same market.
The monopolistically competitive equilibrium in the long run requires the firm's demand curve to be tangent to the ATC curve at the output where MR=MC.
Collusion is an explicit or implicit agreement to avoid competition with a view to increasing profit.
Conjecture: a belief that one firm forms about the strategic reaction of another competing firm.
Game: a situation in which contestants plan strategically to maximize their profits, taking account of rivals' behaviour.
Strategy: a game plan describing how a player acts, or moves, in each possible situation.
Nash equilibrium: one in which each player chooses the best strategy, given the strategies chosen by the other player, and there is no incentive for any player to move.
Dominant strategy: a player's best strategy, whatever the strategies adopted by rivals.
Payoff matrix: defines the rewards to each player resulting from particular choices.
Credible threat: one that, after the fact, is still optimal to implement.
Cournot behaviour involves each firm reacting optimally in their choice of output to their competitors' decisions.
Reaction functions define the optimal choice of output conditional upon a rival's output choice.
Exercises for Chapter 11
Imagine that the biggest four firms in each of the sectors listed below produce the amounts defined in each cell. Compute the three-firm and four-firm concentration ratios for each sector, and rank the sectors by degree of industry concentration.
|
Sector | Firm 1 | Firm 2 | Firm 3 | Firm 4 | Total market |
|
Shoes | 60 | 45 | 20 | 12 | 920 |
|
Chemicals | 120 | 80 | 36 | 24 | 480 |
|
Beer | 45 | 40 | 3 | 2 | 110 |
|
Tobacco | 206 | 84 | 30 | 5 | 342 |
You own a company in a monopolistically competitive market. Your marginal cost of production is $12 per unit. There are no fixed costs. The demand for your own product is given by the equation P=48–(1/2)Q.
Plot the demand curve, the marginal revenue curve, and the marginal cost curve.
Compute the profit-maximizing output and price combination.
Compute total revenue and total profit [Hint: Remember AC=MC here].
In this monopolistically competitive industry, can these profits continue indefinitely?
Two firms in a particular industry face a market demand curve given by the equation P=100–(1/3)Q. The marginal cost is $40 per unit and the marginal revenue is MR=100–(2/3)Q. The quantity intercepts for demand and MR are 300 and 150.
Draw the demand curve and MR curve to scale on a diagram. Then insert the MC curve.
If these firms got together to form a cartel, what output would they produce and what price would they charge?
Assuming they each produce half of the total what is their individual profit?
The classic game theory problem is the "prisoners' dilemma." In this game, two criminals are apprehended, but the police have only got circumstantial evidence to prosecute them for a small crime, without having the evidence to prosecute them for the major crime of which they are suspected. The interrogators then pose incentives to the crooks-incentives to talk. The crooks are put in separate jail cells and have the option to confess or deny. Their payoff depends upon what course of action each adopts. The payoff matrix is given below. The first element in each box is the payoff (years in jail) to the player in the left column, and the second element is the payoff to the player in the top row.
|
| | B's strategy |
|
| | Confess | Deny |
|
A's strategy | Confess | 6,6 | 0,10 |
| Deny | 10,0 | 1,1 |
Does a "dominant strategy" present itself for each or both of the crooks?
What is the Nash equilibrium to this game?
Is the Nash equilibrium unique?
Was it important for the police to place the crooks in separate cells?
Taylormade and Titlelist are considering a production strategy for their new golf drivers. If they each produce a small output, they can price the product higher and make more profit than if they each produce a large output. Their payoff/profit matrix is given below.
|
| | Taylormade strategy |
|
| | Low output | High output |
|
Titleist strategy | Low output | 50,50 | 20,70 |
| High output | 70,20 | 40,40 |
Does either player have a dominant strategy here?
What is the Nash equilibrium to the game?
Do you think that a cartel arrangement would be sustainable?
Ronnie's Wraps is the only supplier of sandwich food and makes a healthy profit. It currently charges a high price and makes a profit of six units. However, Flash Salads is considering entering the same market. The payoff matrix below defines the profit outcomes for different possibilities. The first entry in each cell is the payoff/profit to Flash Salads and the second to Ronnie's Wraps.
|
| | Ronnie's Wraps |
|
| | High price | Low price |
|
Flash Salads | Enter the market | 2,3 | -1,1 |
| Stay out of market | 0,6 | 0,4 |
If Ronnie's Wraps threatens to lower its price in response to the entry of a new competitor, should Flash Salads stay away or enter?
Explain the importance of threat credibility here.
Optional: Consider the market demand curve for appliances: P=3,200–(1/4)Q. There are no fixed production costs, and the marginal cost of each appliance is  . As usual, the MR curve has a slope that is twice as great as the slope of the demand curve.
Illustrate this market geometrically.
Determine the output that will be produced in a 'perfectly competitive' market structure where no profits accrue in equilibrium.
If this market is supplied by a monopolist, illustrate the choice of output.
Optional: Consider the outputs you have obtained in Exercise 11.7.
Can you figure out how many firms would produce at the perfectly competitive output? If not, can you think of a reason?
If, in contrast, each firm in that market had to cover some fixed costs, in addition to the variable costs defined by the MC value, would that put a limit on the number of firms that could produce in this market?