Fiscal policy is the government's use of its taxing and spending powers to affect aggregate expenditure and equilibrium real GDP. The main objective of fiscal policy is to stabilize output by managing aggregate demand, keeping output close to potential output, and reducing the size and duration of business cycle fluctuations. This requires changes in the government's expenditure plans and tax policy to offset changes in autonomous expenditures that would otherwise push the economy away from equilibrium at potential output.
Fiscal policy: government use of taxes and spending to affect equilibrium GDP.
In 2008 and 2009, for example, the international financial crises and the recession that followed led to fiscal stimulus programs in most industrial countries, like Canada's federal 'Economic Action Plan', and calls for international coordination of fiscal stimulus. This fiscal stimulus led in turn to increased budget deficits and national debts and, especially in Europe, to national or sovereign debt crises.
Fiscal austerity
At times government directs fiscal policy not to the level of economic activity but to state of the government budget balance and public debt ratio. A balanced budget (BB=0) is often the target of a fiscal plan that involves some combination of cuts in government expenditure and tax increases. This is fiscal austerity. Federal government fiscal policy in Canada from 2010 to 2015 is a good example.
Fiscal austerity: cuts in government expenditure and/or increases in taxes aimed at improving the government's budget balance.
But the same linkage and feedback effects that work to finance part of a fiscal expansion work to opposite effect in the case of fiscal austerity. If a government cuts expenditures in trying to reduce a budget deficit, some of the initial effect on the budget balance is lost to falling tax revenue. Lower G lowers equilibrium income and lower income lowers tax revenues. Larger budget expenditure cuts to make up for lost revenues make matters worse. This was the experience of many European countries in the years following the recession of 2008. Greece is the extreme case.
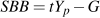
Figure 7.6 illustrates the effects of a cut in G designed to reduce a budget deficit.
Because the observed budget balance combines autonomous (G) and induced (NT) components it is important to consider if the observed budget balance—whether surplus, balanced, or deficit—is a good measure of the government's policy action or fiscal stance.
Does the budget balance show whether fiscal policy is expansionary, aiming to raise national income, or contractionary, aimed at deficit control and reduction?
In itself, the budget balance may be a poor measure of the government's fiscal stance, because the budget balance can change for reasons unconnected to fiscal policy. Even if G and t are unaltered, a fall in investment or exports will reduce national income and output. In turn, this reduces net tax revenue and reduces the budget balance. Indeed, any change in non-government autonomous expenditure changes equilibrium income, net tax revenue, and the government's budget balance. Recent experience in Canada with oil prices and lower growth is a good illustration.
The structural budget balance provides a fiscal indicator that helps to solve this problem.
The structural budget balance
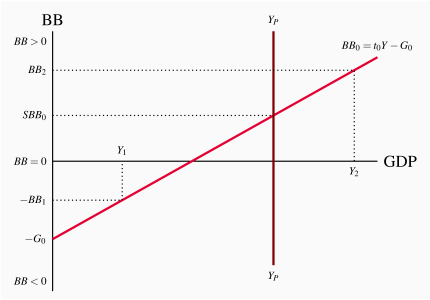
The structural budget balance (SBB) is an estimate of what the budget balance would be if the economy were operating at potential output. By evaluating the budget at a fixed level of income, namely potential GDP, the structural budget balance does not change as a result of business cycle fluctuations in output. In terms of the budget function we used above, the structural balance is:
 |
(7.6) |
Structural budget balance (SBB): the government budget balance at potential output.
Notice that this structural budget function differs from the general budget function of Equation 7.5 by calculating net tax revenue at YP rather than at any Y.
Using the previous numerical example, suppose government expenditure is 200 and the tax rate is 0.20. Holding these terms of the fiscal plan constant, as in Figure 7.4, the budget balance is a deficit at any income below 1000 and a surplus at any income above 1000. If, given other components of aggregate expenditure, the equilibrium output is 800, the actual budget balance will be a deficit. Net tax revenue will be  . With government expenditure of G=200, BB=160–200=–40.
Conversely, suppose higher AE makes equilibrium output 1200. With a tax rate of 0.20 and government expenditure of 200, the budget balance would be a surplus of 40. The important point of these examples is that we cannot tell the stance of fiscal policy, or a change in the stance of fiscal policy, by looking at the budget balance reported by the Department of Finance and published in the media. We need to look at a structural budget balance, calculated at potential output (YP) that is not changed by business fluctuations in actual output around potential output. Estimates of structural budget balances in Canada are published by the Department of Finance in Fiscal Reference Tables, www.fin.gc.ca/frt-trf/2016/frt-trf-16-eng.asp, Tables 17 and 46, as 'cyclically adjusted budget balances'.
Figure 7.7 illustrates the concept of the structural budget deficit as compared to the actual budget deficit. The fiscal policy program is BB0=t0Y–G0. If the economy were operating at potential output YP the budget balance would be SBB0, the structural balance. At any other level of income, resulting for example from cyclical changes in autonomous investment or exports, the actual budget balance would be different from the structural budget balance. A fall in autonomous expenditure that lowered equilibrium GDP to Y1 would result in a budget deficit – BB1 in the diagram. There has been no change in fiscal policy – just a change in the actual budget caused by a business cycle change in national income.
A change in the fiscal plan that changed the net tax rate or a change in planned government expenditure would change the budget function and the structural budget balance. There would be a different budget function line in the diagram. The slope of the line would increase with an increase in the tax rate or fall with a cut in the tax rate. A change in planned government expenditure would change the position of the line. In either case the new structural budget balance would indicate that fiscal policy had changed. The change in fiscal policy would increase or decrease aggregate expenditure.


 by increasing government expenditures or by lowering the net tax rate or a combination of the two. In this case, the government chooses to increase G from G0 to
  . The increase in G, working through the multiplier raises equilibrium real GDP to potential output.
 , increasing the deficit from D1 to D2. The higher autonomous G increases AE to
  and real GDP increases to YP, eliminating the output gap. That increase in Y increases tax revenue and offsets some of the initial increase in the deficit such that the final budget deficit is D3.
 to the new function
  .
. and higher national income generates higher tax revenue. Higher revenue offsets some of the increase in the deficit caused by
  leaving deficit D3, larger than the deficit D1 but less than the increase in spending and deficit used to stimulate the economy.