5.4: Food Systems in British Columbia
- Page ID
- 21992
\( \newcommand{\vecs}[1]{\overset { \scriptstyle \rightharpoonup} {\mathbf{#1}} } \)
\( \newcommand{\vecd}[1]{\overset{-\!-\!\rightharpoonup}{\vphantom{a}\smash {#1}}} \)
\( \newcommand{\id}{\mathrm{id}}\) \( \newcommand{\Span}{\mathrm{span}}\)
( \newcommand{\kernel}{\mathrm{null}\,}\) \( \newcommand{\range}{\mathrm{range}\,}\)
\( \newcommand{\RealPart}{\mathrm{Re}}\) \( \newcommand{\ImaginaryPart}{\mathrm{Im}}\)
\( \newcommand{\Argument}{\mathrm{Arg}}\) \( \newcommand{\norm}[1]{\| #1 \|}\)
\( \newcommand{\inner}[2]{\langle #1, #2 \rangle}\)
\( \newcommand{\Span}{\mathrm{span}}\)
\( \newcommand{\id}{\mathrm{id}}\)
\( \newcommand{\Span}{\mathrm{span}}\)
\( \newcommand{\kernel}{\mathrm{null}\,}\)
\( \newcommand{\range}{\mathrm{range}\,}\)
\( \newcommand{\RealPart}{\mathrm{Re}}\)
\( \newcommand{\ImaginaryPart}{\mathrm{Im}}\)
\( \newcommand{\Argument}{\mathrm{Arg}}\)
\( \newcommand{\norm}[1]{\| #1 \|}\)
\( \newcommand{\inner}[2]{\langle #1, #2 \rangle}\)
\( \newcommand{\Span}{\mathrm{span}}\) \( \newcommand{\AA}{\unicode[.8,0]{x212B}}\)
\( \newcommand{\vectorA}[1]{\vec{#1}} % arrow\)
\( \newcommand{\vectorAt}[1]{\vec{\text{#1}}} % arrow\)
\( \newcommand{\vectorB}[1]{\overset { \scriptstyle \rightharpoonup} {\mathbf{#1}} } \)
\( \newcommand{\vectorC}[1]{\textbf{#1}} \)
\( \newcommand{\vectorD}[1]{\overrightarrow{#1}} \)
\( \newcommand{\vectorDt}[1]{\overrightarrow{\text{#1}}} \)
\( \newcommand{\vectE}[1]{\overset{-\!-\!\rightharpoonup}{\vphantom{a}\smash{\mathbf {#1}}}} \)
\( \newcommand{\vecs}[1]{\overset { \scriptstyle \rightharpoonup} {\mathbf{#1}} } \)
\( \newcommand{\vecd}[1]{\overset{-\!-\!\rightharpoonup}{\vphantom{a}\smash {#1}}} \)
\(\newcommand{\avec}{\mathbf a}\) \(\newcommand{\bvec}{\mathbf b}\) \(\newcommand{\cvec}{\mathbf c}\) \(\newcommand{\dvec}{\mathbf d}\) \(\newcommand{\dtil}{\widetilde{\mathbf d}}\) \(\newcommand{\evec}{\mathbf e}\) \(\newcommand{\fvec}{\mathbf f}\) \(\newcommand{\nvec}{\mathbf n}\) \(\newcommand{\pvec}{\mathbf p}\) \(\newcommand{\qvec}{\mathbf q}\) \(\newcommand{\svec}{\mathbf s}\) \(\newcommand{\tvec}{\mathbf t}\) \(\newcommand{\uvec}{\mathbf u}\) \(\newcommand{\vvec}{\mathbf v}\) \(\newcommand{\wvec}{\mathbf w}\) \(\newcommand{\xvec}{\mathbf x}\) \(\newcommand{\yvec}{\mathbf y}\) \(\newcommand{\zvec}{\mathbf z}\) \(\newcommand{\rvec}{\mathbf r}\) \(\newcommand{\mvec}{\mathbf m}\) \(\newcommand{\zerovec}{\mathbf 0}\) \(\newcommand{\onevec}{\mathbf 1}\) \(\newcommand{\real}{\mathbb R}\) \(\newcommand{\twovec}[2]{\left[\begin{array}{r}#1 \\ #2 \end{array}\right]}\) \(\newcommand{\ctwovec}[2]{\left[\begin{array}{c}#1 \\ #2 \end{array}\right]}\) \(\newcommand{\threevec}[3]{\left[\begin{array}{r}#1 \\ #2 \\ #3 \end{array}\right]}\) \(\newcommand{\cthreevec}[3]{\left[\begin{array}{c}#1 \\ #2 \\ #3 \end{array}\right]}\) \(\newcommand{\fourvec}[4]{\left[\begin{array}{r}#1 \\ #2 \\ #3 \\ #4 \end{array}\right]}\) \(\newcommand{\cfourvec}[4]{\left[\begin{array}{c}#1 \\ #2 \\ #3 \\ #4 \end{array}\right]}\) \(\newcommand{\fivevec}[5]{\left[\begin{array}{r}#1 \\ #2 \\ #3 \\ #4 \\ #5 \\ \end{array}\right]}\) \(\newcommand{\cfivevec}[5]{\left[\begin{array}{c}#1 \\ #2 \\ #3 \\ #4 \\ #5 \\ \end{array}\right]}\) \(\newcommand{\mattwo}[4]{\left[\begin{array}{rr}#1 \amp #2 \\ #3 \amp #4 \\ \end{array}\right]}\) \(\newcommand{\laspan}[1]{\text{Span}\{#1\}}\) \(\newcommand{\bcal}{\cal B}\) \(\newcommand{\ccal}{\cal C}\) \(\newcommand{\scal}{\cal S}\) \(\newcommand{\wcal}{\cal W}\) \(\newcommand{\ecal}{\cal E}\) \(\newcommand{\coords}[2]{\left\{#1\right\}_{#2}}\) \(\newcommand{\gray}[1]{\color{gray}{#1}}\) \(\newcommand{\lgray}[1]{\color{lightgray}{#1}}\) \(\newcommand{\rank}{\operatorname{rank}}\) \(\newcommand{\row}{\text{Row}}\) \(\newcommand{\col}{\text{Col}}\) \(\renewcommand{\row}{\text{Row}}\) \(\newcommand{\nul}{\text{Nul}}\) \(\newcommand{\var}{\text{Var}}\) \(\newcommand{\corr}{\text{corr}}\) \(\newcommand{\len}[1]{\left|#1\right|}\) \(\newcommand{\bbar}{\overline{\bvec}}\) \(\newcommand{\bhat}{\widehat{\bvec}}\) \(\newcommand{\bperp}{\bvec^\perp}\) \(\newcommand{\xhat}{\widehat{\xvec}}\) \(\newcommand{\vhat}{\widehat{\vvec}}\) \(\newcommand{\uhat}{\widehat{\uvec}}\) \(\newcommand{\what}{\widehat{\wvec}}\) \(\newcommand{\Sighat}{\widehat{\Sigma}}\) \(\newcommand{\lt}{<}\) \(\newcommand{\gt}{>}\) \(\newcommand{\amp}{&}\) \(\definecolor{fillinmathshade}{gray}{0.9}\)Indigenous Foodways
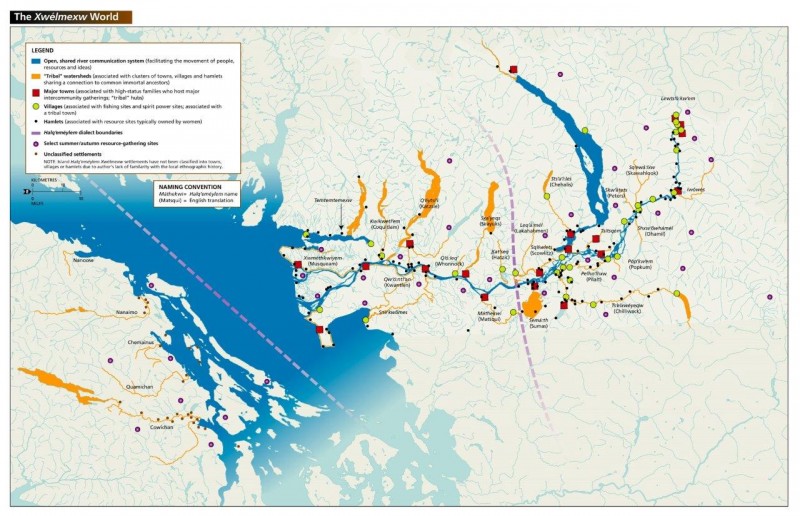
The first human food systems in British Columbia were primarily based on hunting, gathering and cultivating root crops (Turner & Turner, 2008). The ancestors of First Nations peoples often practised periodic migration to take advantage of seasonal resources, including the abundant salmon runs and a number of native seasonal fruits.

Indigenous food systems also included the cultivation and gathering of root crops such as springbank clover, Pacific silverweed, northern rice root, and Nootka lupine (Turner, 1995).

This food system relied on populations moving to find food sources around coastal areas or interior locations usually within a constrained geographic region.
Introduction of European Agricultural Practices and Foodways
The settlement of European communities in BC led to the displacement of indigenous food systems through the destruction of indigenous food resources (e.g., tubers and native crabapples), constraints to the movement of indigenous peoples, and the introduction of new crops and agricultural methods (Turner & Turner, 2008).
The expansion of European agriculture was largely a function of the settlement following the gold rush in the 19th century. As the gold rush expanded through the Interior, entrepreneurs saw an opportunity to begin cattle ranching in locations like Coldstream, which were ideally placed in grasslands relatively close to gold mining communities. Land developers soon followed in the Interior, creating small parcels of land in pre-planned communities with names like Summerland and Peachland — parcels that would be advertised as a “British Garden of Eden” to new settlers and potential investors from Europe.
In addition, many other immigrant communities often took up agricultural production in their first generation. For example, Doukhobors near Grand Forks and Sikh communities throughout the Lower Mainland represent historical immigrant enclaves that continue to practise agriculture as their primary source of income. Much of the growth of agriculture was oriented toward internal markets until the expanded use of canning and the requirements for food exports during the two world wars.
Contemporary agriculture in BC plays several roles: it is a major economic sector that employs over 300,000 people (in agriculture, fishing, manufacturing and food services), it has a multiplier effect on regional economies, it provides ecosystem services and it defines cultural landscapes in several areas where regional identity has become tied to agricultural livelihood.
The increases in export-oriented, agricultural production has increased pressures on BC’s natural resources such as fresh water, fertile soils and wild animal populations.
The Contemporary Food System
The globally integrated agrifoods industry includes primary production in agriculture, aquaculture and commercial fisheries, and processing of food and beverages. Over 200 primary agriculture products and over 100 species of fish, shellfish and marine plants are produced in BC. The food and beverage processing industry is the largest manufacturing industry in the province with almost 1,400 small- and medium-sized firms.
The 2011 Canadian Agricultural Census shows that the province’s 19,759 farms (9.6% of all farms in Canada) produced $2.9 billion (5.8% of all Canadian gross farm receipts) on 2,611,382 hectares (4% of the Canadian agricultural lands).
In 2012, the agrifoods industry had sales of $11.7 billion with primary production agriculture at $2.8 billion, aquaculture and commercial fisheries at $0.7 billion and food and beverage manufacturers at $8.2 billion.
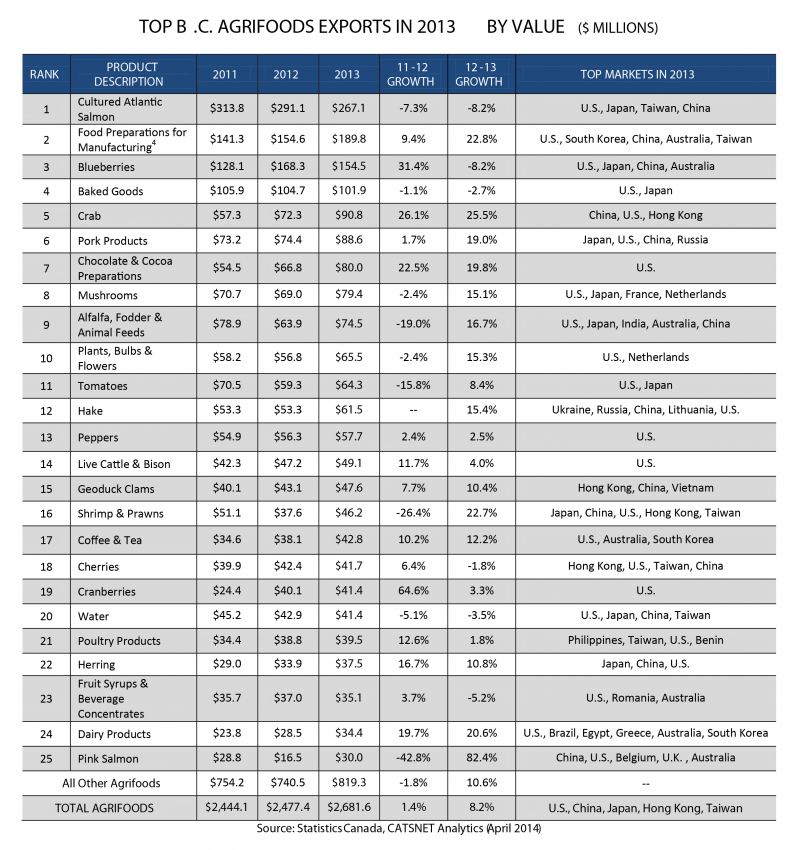
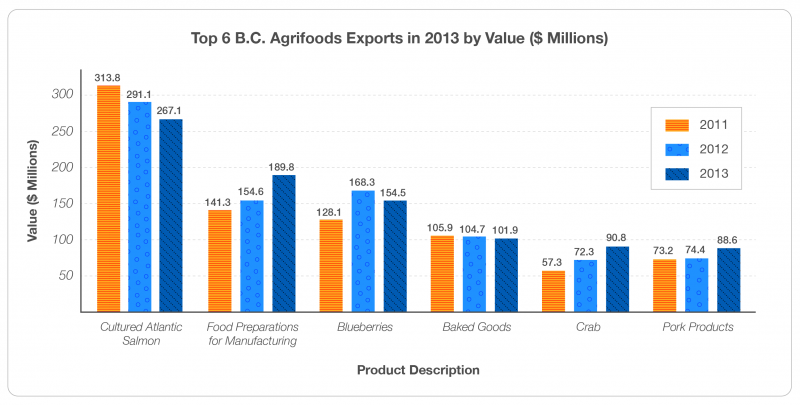
In 2013, the entire agrifood industry and BC producers exported over $2.7 billion of agrifoods products to more than 140 markets. The top exports were farmed Atlantic salmon at $267 million and “food preparations for manufacturing” at $190 million. Over $1.8 billion (68%) of all agrifoods exports in 2013 went to the United States, though the most rapid agrifood export growth from 2012 to 2013 was oriented across the Pacific to the Philippines ($21 million, increasing by 42%), China ($234 million, increasing by 38%), and Japan ($174 million, increasing by 13%). In 2013, BC led Canada in sales of agricultural products like blueberries, sweet cherries, raspberries, pears, apricots, brussel sprouts and rhubarb. In addition, it was the secon- highest producer for 17 other agricultural commodities.


Growth in Viticulture
Among the major growth industries within the BC food system is a rapidly expanding wine industry. Between 2006 and 2011, Statistics Canada estimates that the number of grape growers increased 42% from 686 to 965, and that 9,169 hectares were dedicated to grape growing. Another 2011 survey supported by the BC Wine Institute and BC Grape Growers estimated that there were 210 licensed wineries, 705 grape growers and 864 vineyards that covered 9,867 hectares. According to this second study, the wine growing land was distributed in the Okanagan Valley (81.7%), Similkameen (7%), coastal areas (8.3%), and other areas (3%).
Food Distribution and Cost
Despite increasing production in staple foods and growth in the commodities like wine, many BC families have increasing difficulty managing a budget that allows them to access foods that meet the requirements of a healthy diet. In 2011, the average monthly cost for the nutritious food basket (for a family of four) in BC was estimated by the Dietitians of Canada to be $868.43. BC’s 91 food banks assisted 90,193 individuals in 2010-2011. Of this amount 31.8% were children and youth and 45.1% were women. As well, 16.4% of households receiving food had income from current or recent employment, 14.7% of food bank users identified as Aboriginal, and 76.1% lived in non-subsidized housing.
Food distribution in BC is linked to the large supermarket chain stores (e.g., Save-On Foods, Real Canadian Superstore) that sell primarily imported food, though local retail chains like Askew’s (in Salmon Arm), farm gate sales, and farmers’ markets are firmly established as alternative distribution mechanisms throughout the province.
Attributions
- Figure 5.5. Indigenous food-gathering Map Carlson, K.T., Duffield, C., McHalsie, A.J., Perrier, J., Rhodes,L.,Schaepe, D.M., Smith, D.A. & Sto:lo Heritage Trust 2001, A Stó:l?-Coast Salish historical atlas, Douglas & McIntyre, Chilliwack, B.C. Page 24-25 is licensed under CC BY-NC-ND 4.0 (http://creativecommons.org/licenses/by-nc-nd/4.0/).
- Figure 5.6 Indigenous food systems is comprised of the following images:
- Aspringbank clover Clover hiding a yellow flower (https://www.flickr.com/photos/12567713@N00/1351673683/) by Tom Brandt (https://www.flickr.com/photos/12567713@N00/) is licensed under CC BY 3.0 (https://creativecommons.org/licenses/by/3.0/).
- Pacific Silverweed Rosaceae – Potentilla anserina ssp. pacifica – PACIFIC SILVERWEED/cinquefoil DS (https://www.flickr.com/photos/tcorelli/14061345418/in/photolist-fCwc7a-bjxGNi-a3RmMC-nGRtqC-nqy56Y) by Toni Corelli (https://www.flickr.com/photos/tcorelli/) is licensed under CC BY-NC 2.0 (https://creativecommons.org/licenses/by-nc/2.0/)
- Northern rice root Black Lily at Trail Bay, BC (www.flickr.com/photos/adavey/3053916172/) by Alan (https://www.flickr.com/photos/adavey/) is licensed under CC BY 2.0 (https://creativecommons.org/licenses/by/2.0/).
- Nootka lupine (www.flickr.com/photos/14601516@N00/3758658488/) by JPC Raleigh (https://www.flickr.com/photos/14601516@N00/) is licensed under CC BY NC (creativecommons.org/licenses/by-nc/2.0/).
- Figure 5.7 Top BC Agrifoods Exports in 2013 derived from 2013 BC Agrifoods Export Highlights (www.agf.gov.bc.ca/stats/Export/2013BCAgrigoodsExportHighlights.pdf)
- Figure 5.8 Top six BC agrifoods exports in 2013 by Hilda Anggraeni derived from 2013 BC Agrifoods Export Highlights (www.agf.gov.bc.ca/stats/Export/2013BCAgrigoodsExportHighlights.pdf)

