Standard 6.9: Tax-Supported Facilities and Services
Give examples of tax-supported facilities and services provided by the Massachusetts state government and by local governments. (Massachusetts Curriculum Framework for History and Social Studies) [8.T6.9]
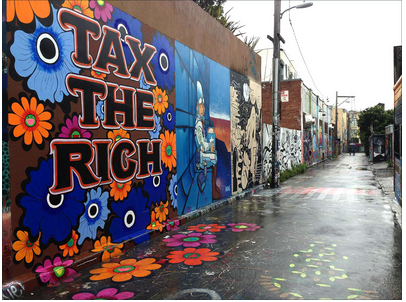
Figure \(\PageIndex{1}\): "Tax The Rich" mural by Megan Wilson, located on Clarion Alley, San Francisco, California
In 1789, a few months before his death, the American revolutionary Benjamin Franklin wrote to his friend and French scientist, Jean-Baptiste Le Roy, "Our new Constitution is now established, everything seems to promise it will be durable; but, in this world, nothing is certain except death and taxes" (Benjamin Franklin's Last Great Quote and the Constitution, Constitution Daily, November 20, 2020).
This standard explores how state and local governments use taxes to provide services and facilities for people. A tax is a fee or a charge that people have to pay. To understand what services you are entitled to receive as a member of a state or local community, it is essential to understand how state and local governments use tax monies, including how public education is funded.
From a public policy perspective, taxes involve two key political questions: 1) How we as a nation spend tax monies; and 2) Who pays taxes and in what amount.
Debates over tax policy tend to focus on whether to implement a more progressive tax system, which relies on those who earn more income to pay more tax, or to maintain a mainly regressive tax system which is uniformly applied, such as a sales tax or a lottery, that results in those with a lower income paying more of their income in taxes.
6.9.1 INVESTIGATE: People's Taxes and How They Are Spent
Massachusetts collected $27.8 billion in taxes in 2018. A billion is a thousand million. How big is a billion? If you saved $100 a day, it would take you 27,397.26 years to reach $1 billion (UC Berkeley Museum of Paleontology, nd).
In Fiscal Year 2021, the federal government collected $3,863 trillion in taxes (U.S. Government Tax Revenue). A trillion is a million million; one trillion seconds equals 31,546 years (How Big is a Trillion?). In 2020, the United States defense budget was $7.78 trillion or 39% of the country's overall spending, the highest amount of any country in the world. China was the next highest, committing $252 billion, 13% of its overall spending, to defense.
How much money do people pay in taxes every year? Looking at the 153 million American households who filed federal income taxes in 2018, one commentator found those earning between $40,000 and $50,000 paid $2,859. Those who earned less paid less; someone earning between $20,000 and $25,000 paid $994. Those who earn more, paid more; someone earning $1 million to $1.5 million paid $313,160 (The Motley Fool, December 31, 2020).
But, there are more taxes than federal taxes. Using figures from the Bureau of Labor Statistics, other analysts found over their lifetime, Americans will pay $525,037 in taxes on earnings, expenditures (sales), property, and automobiles, a figure that varies by state -- those in New Jersey will pay the most; those in West Virginia the least (USA Today, April 1, 2021).
At the same time, many wealthy Americans pay less than their fair share due to loopholes and deductions in the tax laws. Donald Trump famously paid only $750 in federal income taxes in 2016 and 2017, and no taxes at all for 10 of the previous 15 years (MakeIt, CNBC, September 28, 2020).
You can learn more at The Secret IRS Files: Trove of Never-Before-Seen Records Reveal how the Wealthiest Avoid Income Taxes from ProPublicia (June 8, 2021).
You can compare your own salary to that of a billionaire with an interactive called You vs. A Billionaire from RS Components, an electronics company located in the United Kingdom.
Sources of Revenue
State and local governments in Massachusetts get tax revenue from multiple sources as shown in Table \(\PageIndex{1}\) (Learn more: The State of the State (and Local) Tax Policy).
Figure \(\PageIndex{1}\): Sources of Revenue for State and Local Government
| State Government |
Local Government |
|
property taxes
individual income taxes
corporate income taxes
sales taxes
motor vehicle license taxes
marijuana sales taxes\(^*\)
other assessments
|
funds from state and federal government
local property taxes
individual income taxes
charges for water, sewer, etc. services
parking meter fees
corporate taxes
hotel taxes
business license taxes
|
\(^*\)Massachusetts gained a new source of tax revenue when the first legal recreational marijuana stores opened in the state in November 2018. Marijuana has been legal for purchase by people 21 and older in Massachusetts, under certain conditions, since 2016 (Marijuana in Massachusetts--What's Legal?). Marijuana sales are subject to taxation.
To explore marijuana taxation, read What is Massachusetts Planning To Do with All That Marijuana Tax Revenue?, Boston.com, December 5, 2018 and Weed Taxes Roll into Massachusetts, WBUR, July 8, 2019.
By 2021, every state except Nebraska and Idaho has legalized marijuana in some form. You can explore state-by-state policies with this interactive map.
Paying for Schools
"Education is the only area where the state tells cities and towns how much to spend on a local function. We don't tell cities and towns how much to spend on a local fire department or on their public works department" (Jeff Wulfson, Massachusetts Department of Elementary and Secondary Education, quoted in Toness, 2019, para. 7).
Massachusetts uses a formula to determine what it thinks communities need to pay for the expenses of K-12 education—everything from teacher salaries to books and curriculum materials to the costs of maintaining school buildings. This is called the foundation budget. The current foundation budget is $11,448 per student multiplied by the number of students in the school district. The foundation budget is the minimum amount that must be spent. State and local governments pay their share of the foundation budget based on a complicated formula.
Cities and towns may spend more than the foundation budget, but they have to raise that money themselves through local taxes. As a result, wealthier communities, if they choose to do so, can raise more money through taxes to spend on education than poorer communities. According to Boston Magazine, in 2017, Cambridge, Weston, Dover-Sherborn and Watertown spent more than $20,000 per pupil while Haverhill, Lowell, Malden and Taunton were among the communities spending less than $14,000 per pupil.
Tax-Supported Culture for Kids on an App
Beginning in May 2021, as the nation loosened pandemic-related restrictions, the French Government began providing a smartphone app known as Culture Pass that gives every 18-year-old in the country 300 Euros (about $350 dollars) to spend as they choose on cultural purchases. Young people, numbering 720,000 by September 2021, can use these funds to go to the theatre, take a dance class, attend a museum exhibition, or buy art supplies or musical recordings. So far two-thirds of the purchases have been for Japanese comic books ("Why the French Government is Buying Teens Comics Books," The New York Times for Kids, September 26, 2021, p.9).
More than 8000 businesses and cultural institutions are offering products and services on the app. A more restricted version of the app for middle schoolers is on the way. Video game purchases are restricted to those published by French companies and must not feature violence. The cost in taxpayer-provided money is estimated to be some $95 million this year, a figure that will rise in 2022.
What do you consider to be a cultural purchase? Books, eBooks, streaming services, video games, rock concerts, museums, theatre performances, movies, comics?
Suggested Learning Activity
- Write a response to the Culture Pass program in France
- What would you spend $350 on for cultural purchases? Should any purchases be off-limits as not sufficiently cultural or educational?
- How you respond to critics who say government money should not used to let youngsters buy comic books or go to mass-market entertainment movies and concerts?
- In what other ways might governments in the United States support the education of children and adolescents with tax monies?
Suggested Learning Activities
- Discuss and analyze
- What are people's rights as taxpayers?
- Research and design where your taxes are spent
- Did you know that more money is spent on nuclear weapons than foreign aid? More money is spent on disaster recovery rather than climate change investments. The average U.S. taxpayer worked 63 days to fund military spending by the U.S. government. Explore the site Where Your Tax Dollar Was Spent in 2018.
- Create a public service announcement (PSA) video or podcast about a taxpayer issue of your choosing.
Online Resources for Government Spending and School Funding
6.9.2 UNCOVER: A Brief History of Taxation in the U.S.
In the article "The History of Taxes in the U.S.", Fontinelle (2019) noted that "most of the taxes we pay today have been around for less than half of the country's history" (para. 2). The modern estate tax appeared in 1916; the federal income tax was established by the 16th Amendment in 1916; West Virginia established the first sales tax 1921; social security taxes were first collected in 1937.
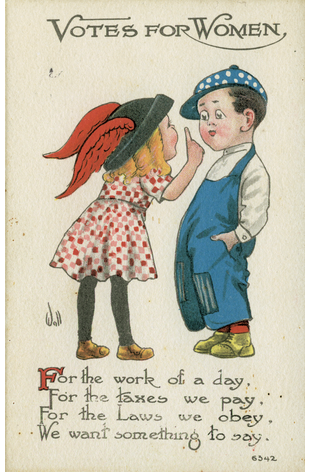
Figure \(\PageIndex{2}\): Poster declaring that women who pay taxes want votes too | "Votes for women" by Bernhardt T. Wall, 1913, public domain
Types of Taxes
Broadly speaking, Americans pay seven different types of taxes (Hess, 2014):
- Income taxes on the money or taxable income made by individuals and corporations. The first income tax was put in placed in 1862 to help pay for the Civil War.
- Sales taxes on goods and services purchased.
- Excise taxes on items such as gasoline, cigarettes, beer, liquor, etc...
- Payroll taxes on salaries to cover Social Security and Medicare.
- Property taxes on value of real estate.
- Estate taxes on cash and other assets when a person dies.
- Gift taxes on items of value given to a person by another person.
While everyone pays taxes, the richest Americans pay the least, concluded economists Emmanuel Saez and Gabriel Zucman (2019). While all income groups pay about 28% of their income in taxes, the very top earners - billionaires, or the 400 wealthiest individuals - pay only 23%. Corporations pay a 21% tax rate. You can track the accumulation of wealth at The World's Real-Time Billionaires from Forbes.
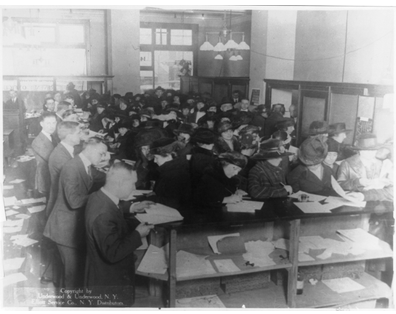
Figure \(\PageIndex{3}\): People filling out tax forms in Internal Revenue Services office, circa 1920 | Photograph by Underwood & Underwood, Library of Congress, public domain
The Constitution gives Congress the power to tax and spend, otherwise known as the "power of the purse."
The Internal Revenue Service (IRS) is the nation's tax collection agency. Following the passage of the 16th Amendment, it was originally known as the Bureau of Internal Revenue, and renamed the Internal Revenue Service in 1952.
Once tax money is collected, the Federal Government engages in two types of spending: Mandatory Spending (required spending for programs such as Medicare, unemployment, social security and interest on the national debt) and Discretionary Spending (all the other spending that is requested by the President and approved by the Congress). Military spending now accounts for almost 60% of all discretionary spending and the rest goes to education, transportation, housing, energy, environment, food, agriculture and everything else.
Progressive and Regressive Taxation
Much of the Massachusetts tax system is regressive, not progressive. Regressive taxes, such as sales taxes, force those with the least money to contribute a higher percentage of their total income to cover taxes. For example, Mary has a weekly salary of $300 and Julie has a salary of $1,500, but both pay a $6 sales tax on their $100 grocery bill. Mary pays 2% of her weekly salary in taxes while Julie only pays 0.4% of hers (Why the Sales Tax is Considered a Regressive Tax, AccurateTax, 2017). Similar to sales taxes, property taxes, payroll taxes, and excise taxes all require lower-earning individuals and families to pay a higher percentage of their income in taxes.
The Massachusetts income tax is somewhat less regressive in nature. Since everyone pays Massachusetts income taxes at a flat rate, lower-income households pay less than do higher-income households.
Nationally and at the state level, there are calls for establishing more fair and equitable tax policies by increasing taxes on the wealthiest individuals and families. New York State extended its "millionaire tax" through 2024. Under its millionaire tax, those making more than one million dollars a year pay taxes at a higher rate than everyone else.
Noting that the richest 130,000 families now have nearly as much wealth as the bottom 117 million families combined, 2020 Presidential candidate Elizabeth Warren proposed an "Ultra-Millionaire Tax" that would place additional taxes on those making more $50 million a year. Presidential candidate Bernie Sanders also proposed a Tax on Extreme Wealth as part of his 2020 campaign.
Racial and Gender Bias in the Tax System
Racial and gender bias is built into the U.S. tax system, notes reporter Clark Merrefield in a post for The Journalist's Resource, a blog from the Shorenstein Center on Media, Politics and Public Policy at Harvard University. In theory, everyone's tax bills are unrelated to their race, ethnicity, or gender. No law states that a White American can pay less in taxes because they are White.
In practice, however, deductions (a reduction in amount of income to be taxed) and exclusions (income that is not taxed) result in significant savings ($489 billion in 2016) for those who qualify for them; those who do qualify are disproportionately White households. Federal tax deductions and exclusions include home mortgage interest, state and local taxes, charitable contributions, tax-exempt bonds, life insurance exclusion, pension exclusion, capital gains exclusion, home sales exclusion, and estate set-up exclusion.
Many of these deductions and exclusions are out the reach of low-income individuals and families. One is less likely to make charitable donations, for example, if one is struggling to make enough money to live at or just above the poverty line. There is a enormous wealth gap in U.S. society in which White Americans have 10 times the wealth of Black Americans and 8 times that of Latina/o Americans (Brown, 2021, p.18). Economist Dorothy A. Brown (2021) concluded that across all income levels, Black Americans "are paying more taxes than white Americans because our tax laws were designed with white Americans in mind" (p. 21).
Suggested Learning Activities
- Debate (in person, on social media, or on Flipgrid)
- Should everyone pay the same percentage of their income in taxes, or should those with more money pay more in taxes?
- Should minors (individuals under 18 years old) be required to pay taxes?
Online Resources for Taxes and History of Taxation
- Lesson Plans
- Regressive Tax Lesson Plan
- Progressive Taxes Lesson Plan
- Getting to Know the Commonwealth Formerly Known as "Taxachusetts", American Bar Association (November 18, 2016)
- History of the U.S. income tax, Library of Congress
- History of the IRS
6.9.3 ENGAGE: Should States Expand Lotteries to Raise Money for Communities?
A lottery is a drawing of lots (tickets with numbers) in order to award prizes to individuals who have paid money to buy chances to win. Forty-eight governments (45 states plus the District of Columbia, Puerto Rico and the U.S. Virgin Islands) operate lotteries. Massachusetts began its lottery in 1972; MegaMillions started in 2000, and Powerball in 2010. By law, youngsters under 18 years old cannot buy lottery tickets, although adults can purchase them for minors as gifts.

Figure \(\PageIndex{4}\): Logo of the Massachusetts state lottery | Public domain
Lotteries have been part of American society since colonial times. Massachusetts had the first authorized lottery in Boston in 1745; 25,000 tickets were sold. Rhode Island soon did the same, starting their first lottery to build a bridge over the Weybosset River in Providence. You can learn more at Colonial America Lotteries from The Ephemera Society of America.
Lotteries generate huge sums of money for state governments. One study found that Americans spent $71,826,670 on lotteries in 2017, or about $220 for every individual in the country. While the average American spends $288 on lottery tickets, Massachusetts residents spent the most money of any state in the nation: about $933 per person annually, more than $300 more than people in Rhode Island, the next highest state (Jacoby, 2021, p. K5). Five percent of the state's people said they play the lottery every day ("These 22 States Love Playing the Lottery the Most," July 28, 2020).
Proponents contend lotteries provide needed revenue for cities and towns since state governments do redistribute some of the money they take in from lottery sales as prizes for winners and financial support for local communities. In Massachusetts, 72% of lottery revenue is paid out in prizes (most states pay out less); 8% goes to cover operating expenses; and the remaining 20% is returned to cities and towns throughout the state (Massachusetts State Lottery Commission, 2019).
Opponents of lotteries question whether the money goes to the communities that need it the most (How to Fix the Unfair Distribution of Revenue Collected by the Massachusetts State Lottery, 2018). There is also deep concern that lotteries promote an addiction to gambling, since it is so easy to purchase tickets at stores. There are also equity issues since households in the lowest income brackets (making $30,000 or less a year) spend significantly more lottery tickets than those earning higher incomes ($75,000 a year and up).
Media Literacy Connections: Advertising the Lottery Online and in Print
A lottery is a game of chance. Players are not guaranteed to win; in fact, hardly anyone ever does. The thrill that keeps people playing and paying is the hope that "today might be your lucky day" - the time when it all comes together and you win big money, with its accompanying celebrity status.
Lotteries are a form of regressive taxation where lower-earning individuals spend a higher percentage of their incomes on games of chance in which they have little opportunity to earn back what they spend. A few people do win large amounts of money, but the likelihood is extremely small. The chance of winning a Mega Millions jackpot is about 1 in 302.5 million; the odds of being struck by lightning are only 1 in 500,000.
In the following activities, you will uncover how lottery advertisements are designed to persuade people to gamble their money and then you will inform people about their chances of winning the lottery.
Suggested Learning Activities
- Research and discuss
- Examine the mathematics of lotteries, probabilities, and games of chance with the Local Lotto Curriculum at the City Digits website developed by Laurie Rubel and her team at Brooklyn College.
- After examining the mathematics of lotteries, discuss whether you will buy lotto tickets when you turn 18 years old.
- Design an infographic
- Display the probabilities of winning a lottery versus other likely and unlikely events (e.g., getting eaten by a shark!).
- Discuss and debate
- Are lotteries an effective public policy?
- Why do Massachusetts people spend the most on lotteries of any state in the nation?
- How should states distribute the money from lottery sales?
Online Resources for Lotteries
Standard 6.9 Conclusions
Taxes and how state and local governments spend them were the focus of this standard. INVESTIGATE examined what taxes people pay and how some of those funds are used to support public education. UNCOVER reviewed the history of taxation, including progressive and regressive taxation. ENGAGE asked whether lotteries are a fair and sensible way to raise money for communities.
