
5.3: Voter Turnout and Political Participation- Are the Voting Winds Changing in Texas?
- Page ID
- 129159
Texas has in the past been notorious for low voter turnout, even for national elections. In the 2012 primary, only four percent of Democrats and eight percent of Republicans turned out to vote.18 The voter turnout rate was 11.6 percent in the 2014 primary election.19 In the 2018 primary, 2.6 million people voted: 1.5 million Republicans and 1.1 million Democrats, yielding a seventeen percent turnout in the 2018 primary election.20 There are many reasons for this. For example, a study completed by the National Commission on Voting Rights in September 2015 found that state registration laws can either raise or reduce voter turnout rates, especially among citizens who are young or whose income falls below the poverty line.21 The study also found that states with a less complex voting system yielded higher voter registration.22 Although the government says it wants to increase voter turnout, the registration process and state voting laws may be placing barriers that prevent various groups of citizens from participating in the electoral process.
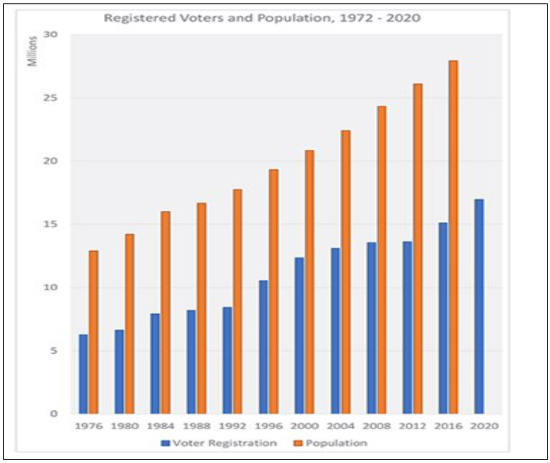
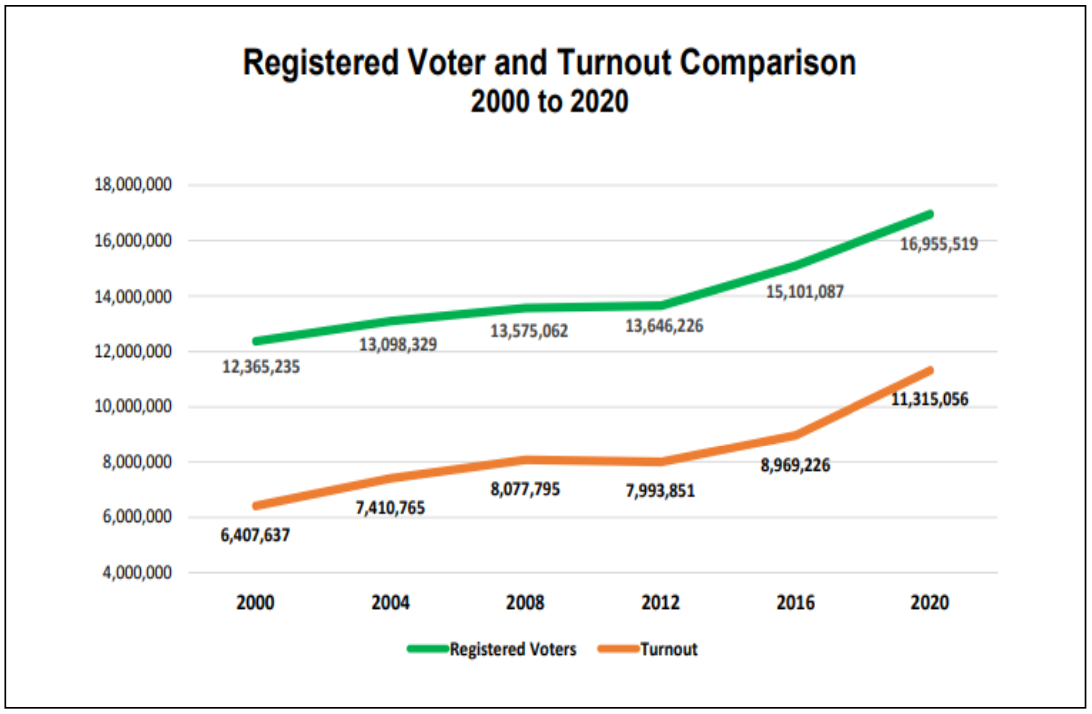
However, voter registration is on the rise. Headed into the 2020 primary elections, voter registration had increased by 417,941 with 16,211,198 registered voters. By the 2020 general election voter registration was at 16,955,519. That means that there were 1,162,262 more registered voters in 2020 that 2018. This increase in voter registration has been attributed by some to a massive efforts by political parties to get people registered. However, this increase could also be simply a reflection of the increase in Texas population. Although there was an increase of 12.3 percent of registered voters, this number is not really that unusual. From 1992 to 1996 there was a 24.9 percent increase and from 1980-1984 there was a nineteen percent increase.23 You can see from the graph in Figure 5.9 that voter registration can be at least partially explained by population increases in Texas.
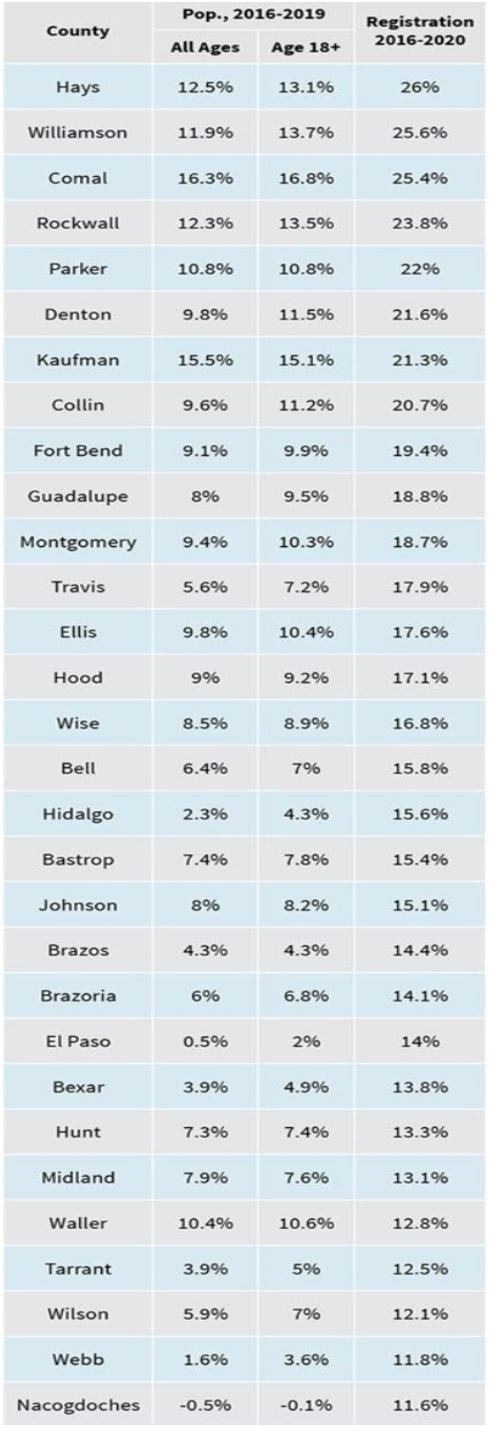
Much of this growth was concentrated in the big cities of Houston, Dallas-Fort Worth, San Antonio and Austin, although border counties such as El Paso County and areas along the Permian Basin also saw increases in population. Table 5.1 offers a comparison of population and registration on a county-by-county basis.
Table 5.1 Change in Registration and Voter Population
So, registration numbers went up in Texas and that led to much discussion that Texas might turn blue. Discussion was also fueled by the 2018 candidacy for U.S. Senate of Robert Francis O'Rourke, better known as Beto. Beto served from 2013-2019 in Texas's Sixteenth Congressional District for El Paso in the United States House of Representatives. A Democrat winning a statewide office seemed unlikely in a staunchly Republican state like Texas, or at least it did until Beto O’Rourke. Because Beto was such a strong candidate, Democrats showed up to the polls in record numbers. Republicans got scared and realized that the Republican who held the seat, Senator Ted Cruz, could actually lose, so Republicans also showed up to the polls in
record numbers especially for a midterm election where turnout is usually low. Ted Cruz kept his Senate seat, but the race ended up being the closest in the past forty years! Beto lost the race by only 2.5 percentage points. Does 2018 voter turnout mean that Texans are going to continue to show up and vote or was it an anomaly? Were Texans simply responding to the specific candidates who were running?
However, a blue Texas did not happen. In 2020, not much changed. According to Derek Ryan 2020 Post Election Report, here’s what we saw from the 2020 election:
- The Republican presidential candidate won Texas for the eleventh consecutive presidential election;
- Republicans won every statewide race on the ballot for the thirteenth consecutive election;
- Republicans held on to all of their congressional seats;
- Republicans maintained their majority in the Texas House by a margin of eighty-three to sixty-seven.24
While the Republicans had much to celebrate, there were also several victories for Democrats:
- Democrats held the two congressional seats they won from the Republicans in 2018;
- Democrats won back a seat in the Texas Senate;
- Democrats won all but one of the twelve seats in the Texas House they won from the Republicans in 2018;
- Democrats won seven seats on Court of Appeals benches and several other District Judge positions.25
Ultimately, it’s not just voter registration that’s important but who is participating in the electoral process through voting.
18. Ross Ramsey, “Elections Behind and Ahead,” Texas Weekly, Aug. 24, 2012, http://www.texastribune.org/texas-we...ind-and-ahead/.
19. Ramsey, “Elections,” http://www.texastribune.org/texas-we...ind-and-ahead/.
20. “Turnout and Voter Registration Figures (1970-current),” Texas Secretary of State, Ruth R. Hughs, https://www.sos.state.tx.us/election...al/70-92.shtml.
21. Stanley Augustin, “New Report Released by National Commission on Voting Rights: More Work Needed to Improve Registration and Voting in the U.S.,” Press Release, Sept. 22, 2015, Lawyers Committee for Civil Rights Under Law, https://lawyerscommittee.org/new-rep...ng-in-the-u-s/.
22. Augustin, “National Commission on Voting Rights,” https://lawyerscommittee.org/new- report-released-by-national-commission-on-voting-rights-more-work-needed-to-improve-registration-and-voting-in-the-u-s.
23. Tim Brown, “Texas Voter Surge in 2020 More Dynamic in Certain Areas,” Texas Association of Counties, Jan./Feb. 2021, https://www.county.org/County- Magazine/January-February-2021/Trends-in-voter-registration.
24. Ryan Data & Research, "2020 Post Election Report," https://mailchi.mp/ryandata/2020_gen...6?e=e7bad3d9fe.
25. Ryan Data & Research, "2020 Post Election Report," https://mailchi.mp/ryandata/2020_gen...6?e=e7bad3d9fe.