Now let’s take a look at the EEG data that we just loaded. In the EEGLAB window, go to Plot > Channel data (scroll). This will be your main way of visualizing EEG data. You should see a new window that looks something like Screenshot 1.5. This window is showing the EEG data from all of the electrode sites for the first five seconds of the recording. If you click the >> button near the bottom of the window, it will scroll rightward to show you the next 5-second period. Using the <<, <, >, and >> buttons, scan through the file and see what the EEG looks like
If you type a number into the text box between the < and > buttons, it will go to that time point. Try typing 20 into that box (and hit Enter/Return). You should now see the data from 20-25 seconds.
Screenshot 1.5
Now we’re going to zoom in a little closer. You should be looking at the data from 20-25 seconds; if not, type 20 into the box between the < and > buttons. To zoom in on a shorter time period, go to the menus in the plot window and selection Settings > Time range to display, type a 1 into the text box, and click OK. You’ll now be looking at the time period from 20-21 seconds instead of 20-25 seconds.
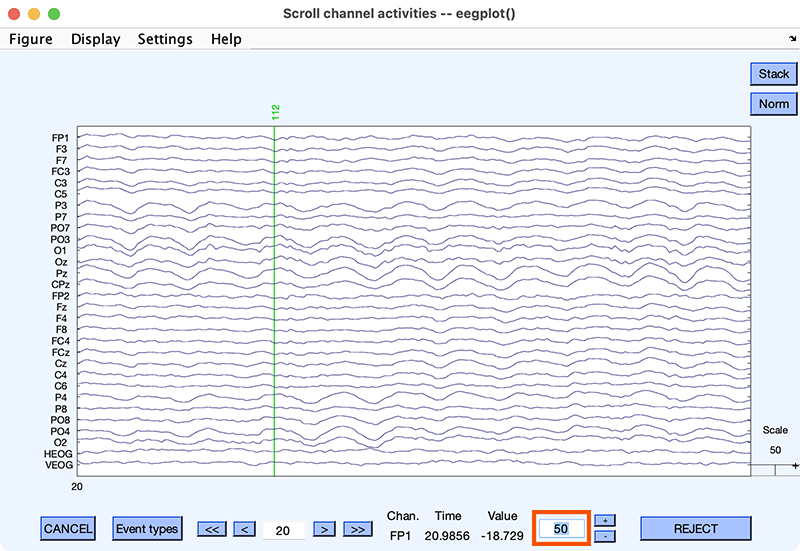
Now let’s adjust the vertical zoom. If you look near the right edge of the window, you should see a vertical scale marker. On my computer, it says 194 µV (but it might be different on your computer). This means that the vertical space indicated by the marker corresponds to 194 µV. To zoom in closer, we need to do something a little counterintuitive: We need to use a smaller number of µV for that marker. For example, if we use 50 µV for that same vertical space, a smaller voltage deflection will now extend over a larger vertical range. To make this change, enter 50 into the vertical scale text box (indicated by the red box in Screenshot 1.6). Now you’re zoomed in both in time and in amplitude.
If you look at the occipital and parietal electrode sites (e.g., O1), you can see an oscillating wave. Count the number of positive peaks. You should see 11 peaks in this 1-second period. 11 peaks per second means that it’s an 11 Hz oscillation. This is called the alpha wave, which was the very first feature of the human EEG to be described (Berger, 1929). Alpha waves are oscillations at approximately 10 Hz that are largest over posterior electrode sites and are particularly large when the participant is zoned out or has closed eyes. I like to think of alpha waves as indicating that the participant’s attention is internally focused instead of externally focused. In most experiments, you want the subject to be alert and paying attention externally to the task, so you don’t want to see alpha waves. However, most ERP experiments are pretty boring, so the participants are often a little sleepy and generate quite a bit of alpha. When a participant produces a lot of alpha, we often give them a break and offer a caffeinated beverage.