Social Sci LibreTexts

1.5: Exercise - Viewing EEG Spectra

  • Page ID
    87928
  • \( \newcommand{\vecs}[1]{\overset { \scriptstyle \rightharpoonup} {\mathbf{#1}} } \) \( \newcommand{\vecd}[1]{\overset{-\!-\!\rightharpoonup}{\vphantom{a}\smash {#1}}} \)\(\newcommand{\id}{\mathrm{id}}\) \( \newcommand{\Span}{\mathrm{span}}\) \( \newcommand{\kernel}{\mathrm{null}\,}\) \( \newcommand{\range}{\mathrm{range}\,}\) \( \newcommand{\RealPart}{\mathrm{Re}}\) \( \newcommand{\ImaginaryPart}{\mathrm{Im}}\) \( \newcommand{\Argument}{\mathrm{Arg}}\) \( \newcommand{\norm}[1]{\| #1 \|}\) \( \newcommand{\inner}[2]{\langle #1, #2 \rangle}\) \( \newcommand{\Span}{\mathrm{span}}\) \(\newcommand{\id}{\mathrm{id}}\) \( \newcommand{\Span}{\mathrm{span}}\) \( \newcommand{\kernel}{\mathrm{null}\,}\) \( \newcommand{\range}{\mathrm{range}\,}\) \( \newcommand{\RealPart}{\mathrm{Re}}\) \( \newcommand{\ImaginaryPart}{\mathrm{Im}}\) \( \newcommand{\Argument}{\mathrm{Arg}}\) \( \newcommand{\norm}[1]{\| #1 \|}\) \( \newcommand{\inner}[2]{\langle #1, #2 \rangle}\) \( \newcommand{\Span}{\mathrm{span}}\)\(\newcommand{\AA}{\unicode[.8,0]{x212B}}\)
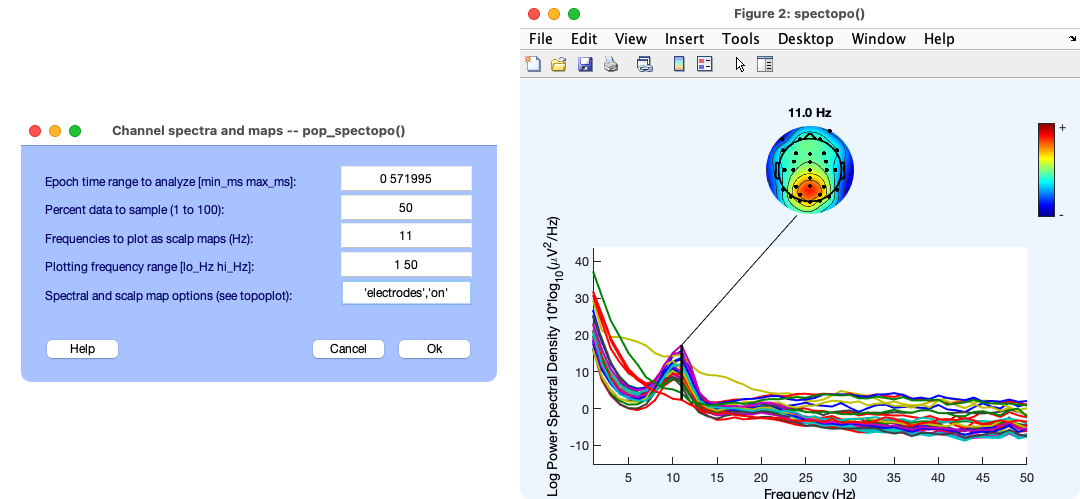
    Now let’s take a closer look at the alpha wave. Close the plotting window that shows the EEG, go to the main EEGLAB GUI, and select Plot > Channel spectra and maps. Adjust the bottom three text boxes so that they match the values shown in the left portion of Screenshot 1.7 and then click OK. You should now see a window like that shown on the right side of Screenshot 1.7.

    This routine performs a Fourier transform of the EEG, converting it from the time domain to the frequency domain (see Chapters 1 and 12 in Luck, 2014). The waveforms at the bottom of the window show the strength of each frequency in the EEG data, with one waveform for each channel. You can see that most of the channels have a peak around 11 Hz, which is the alpha wave you saw previously. The topograph map at the top shows how the strength at 11 Hz varies across the scalp (using interpolation to estimate the values in between the electrode sites). You can see a big peak over the posterior electrode sites, where the alpha is largest.

    Screenshot 1.7

    7 Plot_Spectrum.png

    Try playing around with the settings for this routine (e.g., getting scalp maps for different frequencies). When you’re done, close the plotting window to prepare for the next exercise.


    This page titled 1.5: Exercise - Viewing EEG Spectra is shared under a CC BY 4.0 license and was authored, remixed, and/or curated by Steven J Luck directly on the LibreTexts platform.

    • Was this article helpful?