Now we’re going to load some averaged ERP data and plot the waveforms. Take a look at the ERPLAB menu inside the EEGLAB window. ERPLAB is an EEGLAB plugin, and the ERPLAB menu is the main way you’ll access the ERPLAB functions.
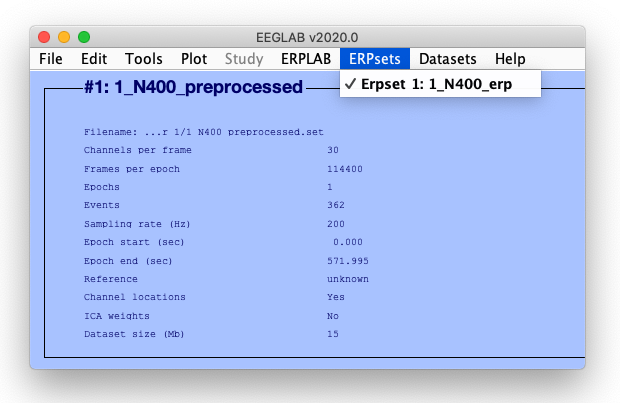
Select ERPLAB > Load existing ERPset, which will bring up a dialog box showing you the contents of the current folder. Select and open the file named 1_N400_erp.erp. An ERPset is the ERPLAB equivalent of EEGLAB’s datasets. Instead of holding EEG data, an ERPset contains averaged ERPs. I previously created this ERPset by averaging together the trials in the EEG dataset that you looked at in the previous exercise. We’ll see how this averaging process works later. The currently loaded ERPsets are listed in the ERPsets menu (see Screenshot 1.8).
Screenshot 1.8
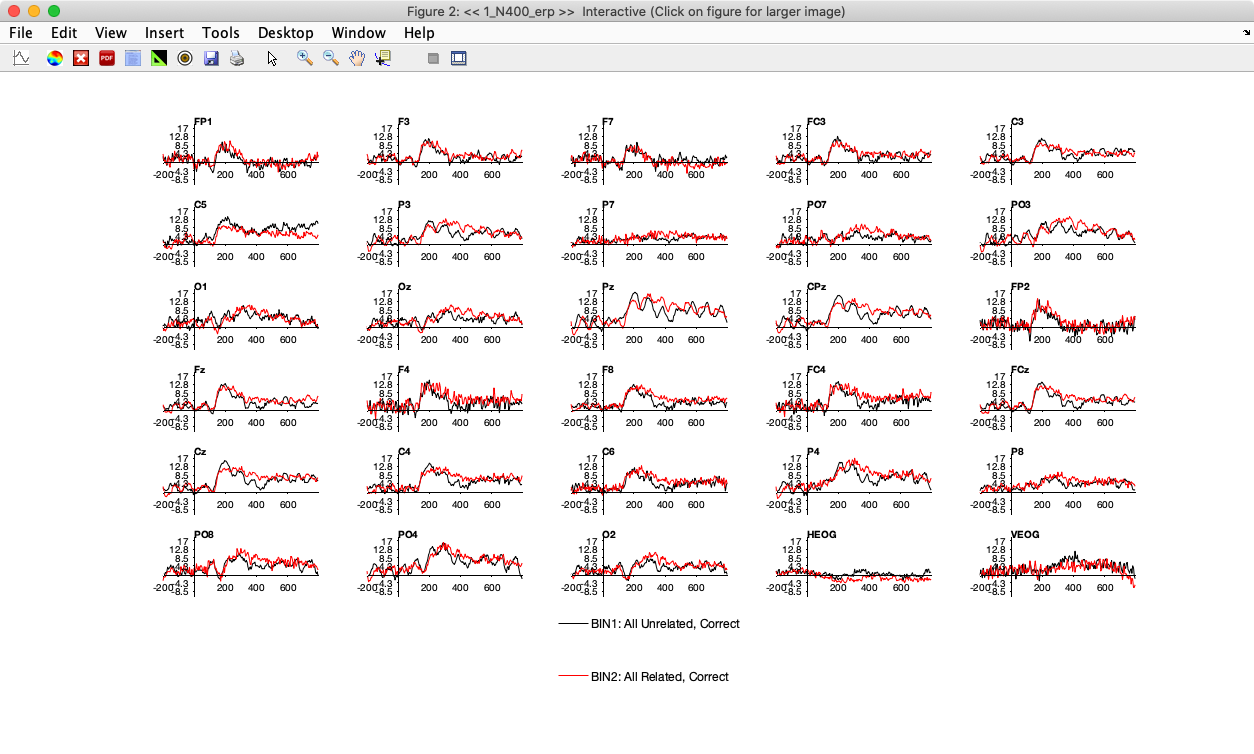
To visualize the ERP waveforms in an ERPset, go to ERPLAB > Plot ERP > Plot ERP waveforms. It will bring up a large and complicated window that allows you to control many different plotting parameters. Click the RESET button at the bottom window so that it uses its default parameters, and the click the PLOT button in the lower right corner of the window. You should see something like Screenshot 1.9. (Hint: If things don’t look right when you plot a set of ERP waveforms, trying clicking the RESET button to get rid of any custom settings that you might have been using the last time you plotted some waveforms.)
Screenshot 1.9
This ERPset contains ERPs for two different bins (experimental conditions), labeled “All Unrelated, Correct” and “All Related, Correct”. There is a separate waveform for each electrode site for each of the two bins.
If you click an electrode label (like FP1 for the waveforms in the upper left corner), it will pop up a new window with a blown-up version of the waveforms for that electrode site. The plotting GUI is a little twitchy and a little slow. If it doesn’t pop up the window after a second or two, try again (but wait a second before trying again or you’ll end up with multiple windows open). Also, you only need to click once; if you double-click the electrode label, you may end up with an extra copy of the blown-up window. Play around with this a bit, and close the plotting windows when you’re done.
The GUI that controls the plotting has a lot of options. For example, you select the show standard error option, it will show the standard error of the mean at each time point as a semitransparent cloud around the waveform. Play around with the options in this window so that you get a sense of what you can do.
Making High-Quality Figures
Although ERPLAB’s tool for plotting ERP waveforms has a lot of options, it’s not designed to create publication-quality figures. To make nice figures for papers, posters, or presentations, you can plot the waveforms with this tool and then select File > Save As… from the plotting window. I recommend saving the plot in a vector format, such as PDF or SVG. In my lab, we save the files in SVG format and then load these files into a graphics program called Affinity Designer (which is like Adobe Illustrator, but easier to use and much less expensive).
Save As… gives you a lot of other file format options, including several bitmap formats (e.g., .bmp, .jpg, .tif). I recommend against using bitmap formats, because they’re difficult to edit and look terrible when blown up. If you don’t know the difference between vector and bitmap formats, you should search for “vector versus bitmap” in your favorite search engine. It’s an important distinction when you’re trying to plot ERP waveforms.
You can also plot the waveforms by going to ERPLAB > ERP Viewer (see Screenshot 1.10). Give it a try. This tool ordinarily shows you one waveform at a time (although you can overlay multiple waveforms by checking the boxes labeled all. You can scan through different bins and channels by clicking the arrow buttons next to Bin and Channel. If you click the box labeled Adjust measurement time by clicking with the mouse on the desired latency (near the left side of the window), you can click a point on the waveform and see the amplitude and latency at that point. This tool also provide a convenient way of overlaying waveforms from different files.