Social Sci LibreTexts

1.7: Exercise- Plotting ERP Scalp Maps

  • Page ID
    87930
  • \( \newcommand{\vecs}[1]{\overset { \scriptstyle \rightharpoonup} {\mathbf{#1}} } \) \( \newcommand{\vecd}[1]{\overset{-\!-\!\rightharpoonup}{\vphantom{a}\smash {#1}}} \)\(\newcommand{\id}{\mathrm{id}}\) \( \newcommand{\Span}{\mathrm{span}}\) \( \newcommand{\kernel}{\mathrm{null}\,}\) \( \newcommand{\range}{\mathrm{range}\,}\) \( \newcommand{\RealPart}{\mathrm{Re}}\) \( \newcommand{\ImaginaryPart}{\mathrm{Im}}\) \( \newcommand{\Argument}{\mathrm{Arg}}\) \( \newcommand{\norm}[1]{\| #1 \|}\) \( \newcommand{\inner}[2]{\langle #1, #2 \rangle}\) \( \newcommand{\Span}{\mathrm{span}}\) \(\newcommand{\id}{\mathrm{id}}\) \( \newcommand{\Span}{\mathrm{span}}\) \( \newcommand{\kernel}{\mathrm{null}\,}\) \( \newcommand{\range}{\mathrm{range}\,}\) \( \newcommand{\RealPart}{\mathrm{Re}}\) \( \newcommand{\ImaginaryPart}{\mathrm{Im}}\) \( \newcommand{\Argument}{\mathrm{Arg}}\) \( \newcommand{\norm}[1]{\| #1 \|}\) \( \newcommand{\inner}[2]{\langle #1, #2 \rangle}\) \( \newcommand{\Span}{\mathrm{span}}\)\(\newcommand{\AA}{\unicode[.8,0]{x212B}}\)
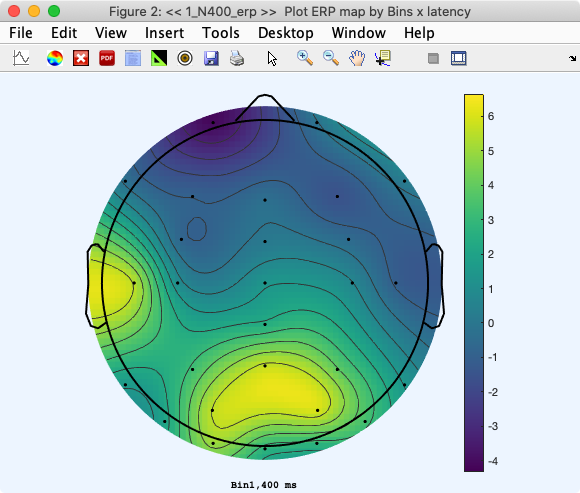
    As a last step in our quick tour of EEGLAB and ERPLAB, we’re going to plot a topographic map (aka scalp map) of the ERPs.

    Select ERPLAB > Plot ERP > Plot Scalp maps, which will bring up a dialog box that lets you control the plotting parameters. Enter 1 into the text box at the upper left labeled Bin(s) to plot (so that it plots bin 1) and enter 400 into the text box labeled Latencies to plot in ms (so that it plots the voltage at 400 ms). Then check the box labeled display color scale box near the right edge of the window. Finally, click the PLOT button in the lower right corner. You should see something like Screenshot 1.11.

    Screenshot 1.11

    11 Plot_ERP_Map.png

    Each little dot on the head is one of the electrode sites. The coloring indicates the voltage at each point on the scalp (using interpolation to fill in the values between electrodes). The scale along the right side indicates what amplitude (in microvolts) is indicated by a particular color.


    This page titled 1.7: Exercise- Plotting ERP Scalp Maps is shared under a CC BY 4.0 license and was authored, remixed, and/or curated by Steven J Luck.

    • Was this article helpful?