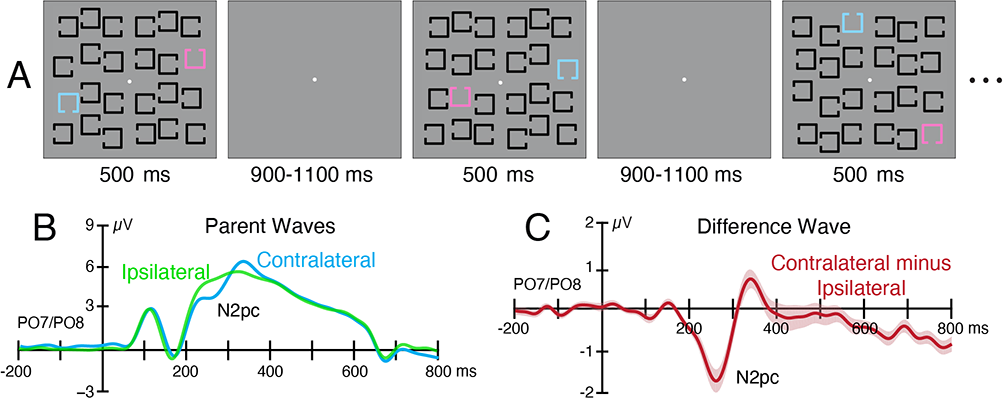
The following exercise will focus on data from the ERP CORE N2pc experiment. This section will describe the experimental design and event code scheme (see Kappenman et al., 2021 for a detailed description). Example stimuli are shown in Figure 8.5.A. N2pc experiments are typically designed to study how people focus their covert attention onto peripheral stimuli without looking at the stimuli, so participants in this experiment were instructed to maintain gaze on the central fixation point at all times.
The experiment was divided into 8 blocks of 40 trials, and participants were instructed to attend to pink in half the blocks and blue in the other half. The task was to find the square of the attended color (using peripheral vision) and press one of two buttons to indicate whether this square had a gap on the top or on the bottom. Each stimulus array had 1 pink square and 11 black squares on one side, along with 1 blue square and 11 black squares on the other side. Except for these constraints, the stimulus locations varied randomly from trial to trial. Most importantly, pink and blue were always on opposite sides, but we randomized which side contained pink and which side contained blue on each trial. Consequently, participants could not know where to shift attention until a given display appeared.
The N2pc component reflects the focusing of attention onto a visual object and is largest when this object is surrounded by nearby distractors (see review by Luck, 2012). It’s a negative voltage in the N2 latency range (typically from 200-300 ms) at posterior electrode sites, and its distinguishing characteristic is that the negative voltage is larger over the hemisphere contralateral to the attended object. For example, the voltage for left-hemisphere electrodes will typically be more negative when the target is in the right visual field than when it is in the left visual field, whereas the voltage for right-hemisphere electrodes will typically be more negative when the target is in the left visual field than when it is in the right visual field.
To make the N2pc easier to visualize, we typically collapse the data into a contralateral waveform (left hemisphere when the target is on the right averaged with right hemisphere when the target is on the left) and an ipsilateral waveform (left hemisphere when the target is on the left averaged with right hemisphere when the target is on the right). These collapsed waveforms are shown in Figure 8.5.B. You can see that the voltage is more negative (less positive) from ~200-300 ms in the contralateral waveform than in the ipsilateral waveform. This voltage is summed with the other ERP components that are active at the same time, which are mainly positive. Thus, the overall voltage is typically positive in both the contralateral and ipsilateral waveforms, but more negative for contralateral than for ipsilateral. To isolate the N2pc from these other components, we make a contralateral-minus-ipsilateral difference wave, as shown in Figure 8.5.C. This difference wave subtracts away all the nonlateralized components, making it easier to see and quantify the time course of the N2pc component.
Figure 8.5. ERP CORE N2pc task (A), grand average ERP waveforms (B), and grand average contralateral-minus-ipsilateral difference wave.
The event code scheme is summarized in Table 8.3. You can see that the event code for each stimulus indicates which color was relevant for the current trial block (in the 100s place), which side contained the target square on the current trial (10s place), and whether the gap on the target square was on the top or bottom of the square (1s place). There were also event codes for correct and incorrect responses.
Table 8.3. Event codes for the ERP CORE N2pc experiment.
Relevant Color for Current Block
Target Side
Target Gap Location
Event Code
Stimuli
Blue
Left
Top
111
Blue
Left
Bottom
112
Blue
Right
Top
121
Blue
Right
Bottom
122
Pink
Left
Top
211
Pink
Left
Bottom
212
Pink
Right
Top
221
Pink
Right
Bottom
222
Accuracy
Event Code
Responses
correct
201
incorrect
202
The bin descriptor file is located in the Chapter_8 folder (named BDF_N2pc.txt), and the bin descriptors are shown below. You can see that there are separate bins for left and right targets, irrespective of which color was relevant in the current block and whether the target gap was on the top or the bottom. However, we require a correct response between 200 and 1000 ms after the stimuli.
bin 1
Left Target
.{111;112;211;212}{t<200-1000>201}
bin 2
Right Target
.{121;122;221;222}{t<200-1000>201}