This module provides an overview of several popular psycho-physiological methods, though it is far from exhaustive. Each method can draw from a broad range of data-analysis strategies to provide an even more expansive set of tools. The psychophysiological methods discussed below focus on the central nervous system. Structural magnetic resonance imaging (sMRI) is a noninvasive technique that allows researchers and clinicians to view anatomical structures within a human. The participant is placed in a magnetic field that may be 66,000 times greater than the Earth’s magnetic field, which causes a small portion of the atoms in his or her body to line up in the same direction. The body is then pulsed with low-energy radio frequencies that are absorbed by the atoms in the body, causing them to tip over. As these atoms return to their aligned state, they give off energy in the form of harmless electromagnetic radiation, which is measured by the machine. The machine then transforms the measured energy into a three-dimensional picture of the tissue within the body. In psychophysiology research, this image may be used to compare the size of structures in different groups of people (e.g., are areas associated with pleasure smaller in individuals with depression?) or to increase the accuracy of spatial locations as measured with functional magnetic resonance imaging.
Figure \(\PageIndex{1}\): The adult human brain only makes up about 2% (i.e., ≈ 3 pounds) of the average adult’s weight, but it uses 20% of the body’s energy! [“Human brain on white background” by _DJ_/Flickr is licensed under CC BY-SA 2.0.]
Functional magnetic resonance imaging (fMRI) is a method that is used to assess changes in activity of tissue, such as measuring changes in neural activity in different areas of the brain during thought. This technique builds on the principles of sMRI and also uses the property that, when neurons fire, they use energy, which must be replenished. Glucose and oxygen, two key components for energy production, are supplied to the brain from the blood stream as needed. Oxygen is transported through the blood using hemoglobin, which contains binding sites for oxygen. When these sites are saturated with oxygen, it is referred to as oxygenated hemoglobin. When the oxygen molecules have all been released from a hemoglobin molecule, it is known as deoxygenated hemoglobin. As a set of neurons begins firing, oxygen in the blood surrounding those neurons is consumed, leading to a reduction in oxygenated hemoglobin. The body then compensates and provides an abundance of oxygenated hemoglobin in the blood surrounding that activated neural tissue. When activity in that neural tissue declines, the level of oxygenated hemoglobin slowly returns to its original level, which typically takes several seconds.
fMRI measures the change in the concentration of oxygenated hemoglobin, which is known as the blood-oxygen- level-dependent (BOLD) signal. This leads to two import- ant facts about fMRI. First, fMRI measures blood volume and blood flow, and from this we infer neural activity; fMRI does not measure neural activity directly. Second, fMRI data typically have poor temporal resolution (the precision of measurement with respect to time); however, when combined with sMRI, fMRI provides excellent spatial resolution (the ability to distinguish one object from another in space). Temporal resolution for fMRI is typically on the order of seconds, whereas its spatial resolution is on the order of millimeters. Under most conditions there is an inverse relationship between temporal and spatial resolution—one can increase temporal resolution at the expense of spatial resolution and vice versa.
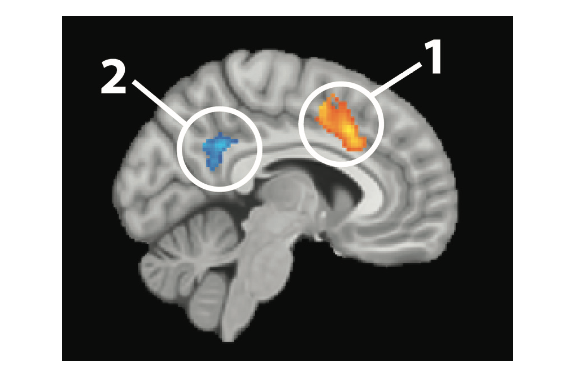
This method is valuable for identifying specific areas of the brain that are associated with different physical or psycho- logical tasks. Clinically, fMRI may be used before neurosurgery in order to identify areas that are associated with language so that the surgeon can avoid those areas during the operation. fMRI allows researchers to identify differential or convergent patterns of activation associated with tasks. For example, if participants are shown words on a screen and are expected to indicate the color of the letters, are the same brain areas recruited for this task if the words have emotional con- tent or not? Does this relationship change in psychological disorders such as anxiety or depression? Is there a different pattern of activation even in the absence of overt performance differences? fMRI is an excellent tool for comparing brain activation in different tasks and/or populations. Figure \(\PageIndex{2}\)provides an example of results from fMRI analyses overlaid on an sMRI image. The blue and orange shapes represent areas with significant changes in the BOLD signal, thus changes in neural activation.
Electroencephalography (EEG) is another technique for studying brain activation. This technique uses at least two and sometimes up to 256 electrodes to measure the difference in electrical charge (the voltage) between pairs of points on the head. These electrodes are typically fastened to a flexible cap (similar to a swimming cap) that is placed on the participant’s head. From the scalp, the electrodes measure the electrical activity that is naturally occurring within the brain. They do not introduce any new electrical activity. In contrast to fMRI, EEG measures neural activity directly, rather than a correlate of that activity.
Figure \(\PageIndex{2}\): Example of fMRI analyses overlaid on an sMRI image. Area 1 (orange) indicates an increase in the BOlD signal, and Area 2 (blue) indicates a decrease in the BOlD signal. We infer that neural activity increased in the Area 1 and decreased in Area 2. [“Figure 1” by Zachary Infantolino and Gregory A. Miller/Noba is licensed under CC BY-NC-SA 4.0.]
Electrodes used in EEG can also be placed within the skull, resting directly on the brain itself. This application, called electrocorticography (ECoG), is typically used before medical procedures for localizing activity, such as the origin of epileptic seizures. This invasive procedure allows for more precise localization of neural activity, which is essential in medical applications. However, it is generally not justifiable to open a person’s skull solely for research purposes, and instead electrodes are placed on the participant’s scalp, resulting in a noninvasive technique for measuring neural activity.
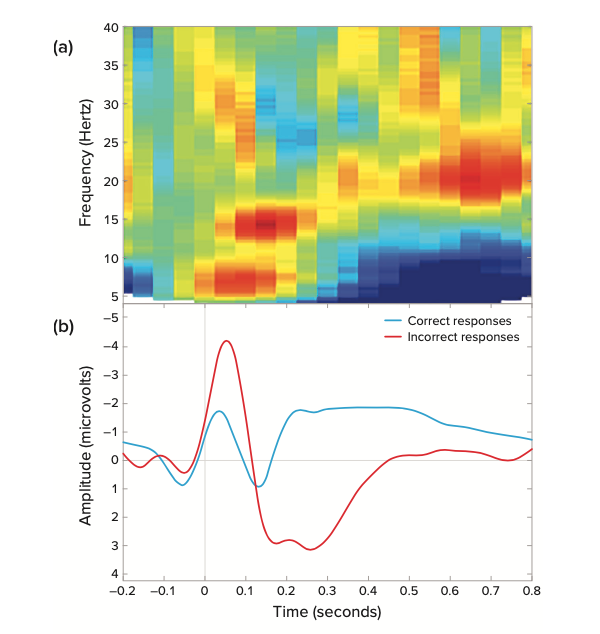
Given that this electrical activity must travel through the skull and scalp before reaching the electrodes, localization of activity is less precise when measuring from the scalp, but it can still be within several millimeters when localizing activity that is near the scalp. One major advantage of EEG is its temporal resolution. Data can be recorded thousands of times per second, allowing researchers to document events that happen in less than a millisecond. EEG analyses typically investigate the change in amplitude or frequency components of the recorded EEG on an ongoing basis or averaged over dozens of trials (see Figure \(\PageIndex{3}\)).
Figure \(\PageIndex{3}\): Example of EEG analysis output. Panel (a) represents changes in the relative strength of different frequencies in the EEG data over time. Panel (b) represents changes in the amplitude in the instantaneous EEG voltage over time. [This work, “EEG Analysis Output,” is licensed under CC BY-NC-SA 4.0 by Judy Schmitt. It is a derivative of “Figure 2” by Zachary Infantolino and Gregory A. Miller/ Noba, which is licensed under CC BY-NC-SA 4.0.]
Magnetoencephalography (MEG) is another technique for noninvasively measuring neural activity. The flow of electrical charge (the current) associated with neural activity produces very weak magnetic fields that can be detected by sensors placed near the participant’s scalp. The number of sensors used varies from a few to several hundred. Due to the fact that the magnetic fields of interest are so small, special rooms that are shielded from magnetic fields in the environment are needed in order to avoid contamination of the signal being measured. MEG has the same excellent temporal resolution as EEG. Additionally, MEG is not as susceptible to distortions from the skull and scalp. Magnetic fields are able to pass through the hard and soft tissue relatively unchanged, thus providing better spatial resolution than EEG. MEG analytic strategies are nearly identical to those used in EEG. However, the MEG recording apparatus is much more expensive than EEG, so MEG is much less widely available.
EEG and MEG are both excellent for elucidating the temporal dynamics of neural processes. For example, if someone is reading a sentence that ends with an unexpected word (e.g., Michelle is going outside to water the book), how long after he or she reads the unexpected word does he or she recognize this as unexpected? In addition to these types of questions, EEG and MEG methods allow researchers to investigate the degree to which different parts of the brain “talk” to each other. This allows for a better understanding of brain net- works, such as their role in different tasks and how they may function abnormally in psychopathology.
Positron emission tomography (PET) is a medical imaging technique that is used to measure processes in the body, including the brain. This method relies on a positron-emitting tracer atom that is introduced into the blood stream in a biologically active molecule, such as glucose, water, or ammonia. A positron is a particle much like an electron but with a positive charge. One example of a biologically active molecule is fludeoxyglucose, which acts similarly to glucose in the body.
Fludeoxyglucose will concentrate in areas where glucose is needed—commonly areas with higher metabolic needs. Over time, this tracer molecule emits positrons, which are detected by a sensor. The spatial location of the tracer molecule in the brain can be determined based on the emitted positrons. This allows researchers to construct a three-dimensional image of the areas of the brain that have the highest metabolic needs, typically those that are most active. Images resulting from PET usually represent neural activity that has occurred over tens of minutes, which is very poor temporal resolution for some purposes. PET images are often combined with computed tomography (CT) images to improve spatial resolution, as fine as several millimeters. Tracers can also be incorporated into molecules that bind to neurotransmitter receptors, which allows researchers to answer some unique questions about the action of neurotransmitters. Unfortunately, very few research centers have the equipment required to obtain the images or the special equipment needed to create the positron-emitting tracer molecules, which typically need to be produced on site.
Transcranial magnetic stimulation (TMS) is a noninvasive method that causes depolarization or hyperpolarization in neurons near the scalp. This method is not considered psychophysiological because the independent variable is physiological, rather than the dependent. However, it does qualify as a neuroscience method because it deals with the function of the nervous system, and it can readily be combined with conventional psychophysiological methods. In TMS, a coil of wire is placed just above the participant’s scalp. When electricity flows through the coil, it produces a magnetic field. This magnetic field travels through the skull and scalp and affects neurons near the surface of the brain. When the magnetic field is rapidly turned on and off, a current is induced in the neurons, leading to depolarization or hyper- polarization, depending on the number of magnetic field pulses. Single- or paired-pulse TMS depolarizes site-specific neurons in the cortex, causing them to fire. If this method is used over primary motor cortex, it can produce or block muscle activity, such as inducing a finger twitch or preventing someone from pressing a button. If used over primary visual cortex, it can produce sensations of flashes of light or impair visual processes. This has proved to be a valuable tool in studying the function and timing of specific processes such as the recognition of visual stimuli. Repetitive TMS produces effects that last longer than the initial stimulation. Depending on the intensity, coil orientation, and frequency, neural activity in the stimulated area may be either attenuated or amplified. Used in this manner, TMS is able to explore neural plasticity, which is the ability of connections between neurons to change. This has implications for treating psychological disorders as well as understanding long-term changes in neuronal excitability.