In the United States, marriage is the legal union of a man and a woman. Outside of the U.S., most societies define marriage between a man and a woman or between a man and women (for example, polygamy among a variety of religious and tribal cultures throughout the world).
Same-sex marriage is the legal union of two people of the same sex. Since 2001 when the Netherlands granted same-sex marriage rights to its citizens, about six other Western nations have granted same-sex marriage rights. Many countries refuse to give same-sex marriage rights to its citizens. Notice that in modern societies, the state government claims the authority to grant marriage rights. This has not always been true for Western societies. A few centuries ago, tribal or clan leaders, a father, or elderly members of small groups could grant marriages.
To legally marry in the United States today, one simply goes to the local county or state office and applies for a state marriage license. The state also claims authority in granting divorce rights to couples. Divorce is the legal dissolution of a previously granted marriage.
Most marriages still endure, and the odds are that divorce won't happen to most marriages. It is a myth that one in two marriages eventually ends in divorce. There are a few myths about U.S. divorce trends that will be dispelled in this chapter. You might have heard the myth of the Seven-Year Itch where divorce happens prior to or shortly after the \(7^{\text {th }}\) year. Current government estimates indicate that about \(75 \%\) of couples make their ten-year anniversary in their first marriage. \({ }^1\) The myths are false, but divorce does happen more today than it did 50 years ago and more people today are currently divorced than were currently divorced 50 years ago.
We'll discuss these trends in divorce rates below, but first we must define cohort. A Cohort is a group of people who share some demographic characteristic, typically a year such as their birth year or marriage year. The Baby Boom is a cohort of those born between 1946 and 1964 and represented a never before nor never repeated high period of birth rates that yielded about 70 million living Baby Boomers today.
There are few different rates for measuring divorce. The most common divorce rate used by the U.S. Census Bureau is the number of divorces \(/ 1,000\) population. Another divorce rate is the number of divorces/1,000 married women. The divorce rate that most hear about is the predictive divorce rate which is the percent of people who had married in a given year who will divorce at some point before death. The National Center for Health Statistics reported that in 2001, 43\% of marriages break up within the first 15 years of marriage. \({ }^2\) That was the highest official scientifically-based divorce risks estimate ever reported. So for example of those who married in the year 2001, about \(43 \%\) are predicted to divorce at some point before their \(15{ }^{\text {th }}\) anniversary. It is estimated that close to half of them will divorce before one of them dies.
Figure \(\PageIndex{1}\) shows the United States marriage and divorce rates/1,000 population from 1900 to 2006. Notice that divorce rates have always been much lower than marriage rates in the U.S. Also notice that marriage and divorce rates moved in very similar directions over the last century. A slight rise is visible after both WWI and WWII ended (1919 and 1946). A slight decline is visible during the Depression (1930s) and turbulent 1960s. Most importantly notice that both marriage and divorce rates have been declining in the 1990s and 2000s. Younger people today are waiting to marry until their late twenties (delayed marriage) while cohabiting has increased in the U.S.
Figure \(\PageIndex{1}\). United States Marriage and Divorce Rates per 1,000 Population 1900-2006. www.census.gov/prod/2005pubs/p70-97.pdf.
Figure \(\PageIndex{1}\) also shows the trends in ratio of divorces to marriages for the U.S. In 1900 there was 1 divorce per 13 marriages that year or 1:13; in 1930, 1:6; in 1950, 1:4; in 1970, 1:3; 1980, 1:2; 1990, 1:2; and 2006, 1:2. Today, that means that every year there are two state-sanctioned legal marriages with only one state-sanctioned legal dissolution of a marriage. For the last 12 months ending in December 2008 there was a marriage rate of 7.1 marriages for every 1,000 population and a divorce rate of 3.5 divorces for every 1,000 population. That translates to over 2.1 million marriages and about 1 million divorces in 2008.
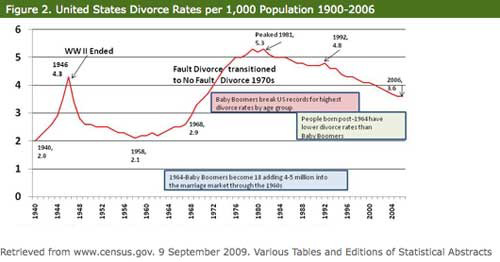
Figure \(\PageIndex{2}\). United States Divorce Rates per 1,000 Population 1900-2006
Figure \(\PageIndex{2}\) shows a more detailed description of U.S. divorce rates since 1940 and some of the factors that contributed to them. As you already noticed in Figure 1, divorce rates were relatively low prior to 1940. But, in the 1940s WWII was ongoing and divorce rates moved upward with a spike in 1946. Keep in mind that 1946 was the United States' most unusual year for family-related rates. Divorce rates, marriage rates, birth rates, and remarriage rates surged during this year while couples married at their lowest median age in U.S. history.
After 1946, divorce rates fell to steady low levels and remained there until the 1960s when they slowly began to rise. The Baby Boomers directly and indirectly influenced the rise of divorce rates. In 1964 the first among the Baby Boomers became 18 and entered the prime marriage market years. For the next two decades Baby Boomers added about four million men and women to the marriage market each year. Thus, Baby Boomers raised the numbers of married people and thereby the numbers at risk of divorcing.
Directly, Baby Boomers contributed to the divorce rate. Baby Boomers and those immediately preceding them (born 1936-1945) have very high rates of divorce. Table \(\PageIndex{1}\) shows that the experience of ever having divorced is not directly related to age. In other words, the oldest members of society have not divorced the most. In fact, it is the Baby Boomers and Pre-Baby Boomers who divorced the most followed by the oldest and then the younger cohorts. The symbol in Table \(\PageIndex{1}\) signifies the highest ever divorced rates. This is in the 50-59 year old cohort (these are Baby Boomers born 1946-1955). The highest currently divorced rates also found among the women and men of the 50-59 cohort. The Baby Boomers 1946-1955 still hold the highest divorce rates by any cohort in U.S. history. Their unprecedented high divorce rates raised the overall divorce rates for the entire nation.
Table \(\PageIndex{1}\): Percent Ever Divorced *and Percent Currently Divorced in 2004 by Age Groups US: Boomers Ages 40-59 in 2004
Ages
15-19
20-24
25-29
30-34
35-39
40-49 Boomers
50-59 Boomers
60-69 Pre-Boomers
70+
Total
Males Ever Div.
0.1%
0.8%
5.1%
13.1%
20.7%
30.3%
37.5%
34.1%
20.6%
20.7%
Males Currently Div.
0.1%
0.7%
3.2%
6.6%
10.9%
14.7%
16.2%
13.0%
6.2%
9.3%
Females Ever Div.
0.2%
2.5%
7.0%
17.1%
25.6%
33.9%
40.7%
32.3%
17.8%
22.9%
Females Currently Div.
0.1%
1.7%
4.1%
9.1%
11.7%
16.4%
19.4%
15.0%
7.2%
10.9%
*Data retrieved 16 September, 2009 from www.Census.gov Number Timing and Duration of Marriages and Divorce 2004 released in 2007: Table 3. Marital History for People 15 Years and Over by Age and Sex: 2004
When scientists and government researchers predict the risk you might have of divorcing they use the experiences of currently married people who have and have not divorced-therein lies part of the complication of deriving an "odds or risks of divorce" that we can have confidence in enough to offer advice to the soon-to-be-married . The U.S. has had its worst divorcing cohort ever and some of them will likely divorce again before their death. The trend among younger marrieds is to remain married longer and divorce less, but what if they collectively have an increase in their marital dissolution experiences? What if all of a sudden, millions of currently married couples flock to the courthouse to file for divorce?
First, that scenario isn't likely to happen because today's married couples tend to remain married. Second, and this is more important, the national risk of divorce is different from your personal risk of divorce in one crucial factor-you have a great deal of influence in your own marriage quality and outcome. You and your spouse have much control over your marital experience, how you enhance it, how you protect it from stressors that can undermine it, and finally how you maintain it.
Family scientists refer to marital entropy as the principle based on the belief that if a marriage does not receive preventative maintenance and upgrades it will move towards decay and break down. Hearing an evening news report on national divorce trends has much less impact on your marriage than a relaxing weekend away together to recharge your romance and commitment which is a marital maintenance strategy designed to combat marital entropy. A proactive and assertive approach to your marital quality is far more influential than most other factors leading to divorce.
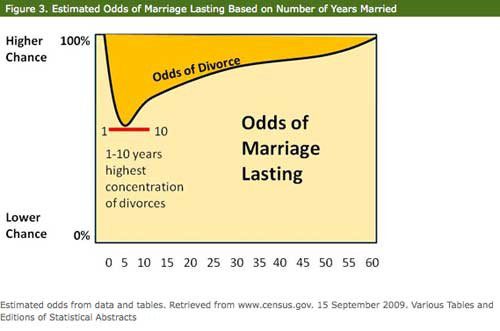
The longer a couple is married the lower their odds of divorce. Figure \(\PageIndex{3}\) shows a visual depiction of how the odds of divorce decline over time. The first three years of marriage require many adjustments for newlyweds. Of special mention is the process of transitioning into a cohesive couple relationship with negotiated financial, sexual, social, emotional, intellectual, physical, and spiritual rules of engagement. Most couples have many of these negotiations in place by years 7-10. Since longevity of a marriage is often associated with the arrival of children, accumulation of wealth, establishment of acceptable social status (being married is still highly regarded as a status), and the buffering of many of life's daily stressors the average couple finds it difficult and too costly to divorce, even though some features of the marriage are less than desirable.
Figure \(\PageIndex{3}\). Estimated Odds of Marriage Lasting Based on Number of Years Married
Footnotes
1. U.S. Census Bureau, 2004 Detailed Tables-Number, Timing and Duration of Marriages and Divorces: 2004; Table 2 Percent Reaching Stated Anniversary, By Marriage Cohort and Sex, and Sex for first and Second Marriages, Retrieved 9 Sept 2009 from www.census.gov