Social Sci LibreTexts

12: Separation and Divorce

  • Page ID
    231855
  • \( \newcommand{\vecs}[1]{\overset { \scriptstyle \rightharpoonup} {\mathbf{#1}} } \)

    \( \newcommand{\vecd}[1]{\overset{-\!-\!\rightharpoonup}{\vphantom{a}\smash {#1}}} \)

    \( \newcommand{\dsum}{\displaystyle\sum\limits} \)

    \( \newcommand{\dint}{\displaystyle\int\limits} \)

    \( \newcommand{\dlim}{\displaystyle\lim\limits} \)

    \( \newcommand{\id}{\mathrm{id}}\) \( \newcommand{\Span}{\mathrm{span}}\)

    ( \newcommand{\kernel}{\mathrm{null}\,}\) \( \newcommand{\range}{\mathrm{range}\,}\)

    \( \newcommand{\RealPart}{\mathrm{Re}}\) \( \newcommand{\ImaginaryPart}{\mathrm{Im}}\)

    \( \newcommand{\Argument}{\mathrm{Arg}}\) \( \newcommand{\norm}[1]{\| #1 \|}\)

    \( \newcommand{\inner}[2]{\langle #1, #2 \rangle}\)

    \( \newcommand{\Span}{\mathrm{span}}\)

    \( \newcommand{\id}{\mathrm{id}}\)

    \( \newcommand{\Span}{\mathrm{span}}\)

    \( \newcommand{\kernel}{\mathrm{null}\,}\)

    \( \newcommand{\range}{\mathrm{range}\,}\)

    \( \newcommand{\RealPart}{\mathrm{Re}}\)

    \( \newcommand{\ImaginaryPart}{\mathrm{Im}}\)

    \( \newcommand{\Argument}{\mathrm{Arg}}\)

    \( \newcommand{\norm}[1]{\| #1 \|}\)

    \( \newcommand{\inner}[2]{\langle #1, #2 \rangle}\)

    \( \newcommand{\Span}{\mathrm{span}}\) \( \newcommand{\AA}{\unicode[.8,0]{x212B}}\)

    \( \newcommand{\vectorA}[1]{\vec{#1}}      % arrow\)

    \( \newcommand{\vectorAt}[1]{\vec{\text{#1}}}      % arrow\)

    \( \newcommand{\vectorB}[1]{\overset { \scriptstyle \rightharpoonup} {\mathbf{#1}} } \)

    \( \newcommand{\vectorC}[1]{\textbf{#1}} \)

    \( \newcommand{\vectorD}[1]{\overrightarrow{#1}} \)

    \( \newcommand{\vectorDt}[1]{\overrightarrow{\text{#1}}} \)

    \( \newcommand{\vectE}[1]{\overset{-\!-\!\rightharpoonup}{\vphantom{a}\smash{\mathbf {#1}}}} \)

    \( \newcommand{\vecs}[1]{\overset { \scriptstyle \rightharpoonup} {\mathbf{#1}} } \)

    \( \newcommand{\vecd}[1]{\overset{-\!-\!\rightharpoonup}{\vphantom{a}\smash {#1}}} \)

    \(\newcommand{\avec}{\mathbf a}\) \(\newcommand{\bvec}{\mathbf b}\) \(\newcommand{\cvec}{\mathbf c}\) \(\newcommand{\dvec}{\mathbf d}\) \(\newcommand{\dtil}{\widetilde{\mathbf d}}\) \(\newcommand{\evec}{\mathbf e}\) \(\newcommand{\fvec}{\mathbf f}\) \(\newcommand{\nvec}{\mathbf n}\) \(\newcommand{\pvec}{\mathbf p}\) \(\newcommand{\qvec}{\mathbf q}\) \(\newcommand{\svec}{\mathbf s}\) \(\newcommand{\tvec}{\mathbf t}\) \(\newcommand{\uvec}{\mathbf u}\) \(\newcommand{\vvec}{\mathbf v}\) \(\newcommand{\wvec}{\mathbf w}\) \(\newcommand{\xvec}{\mathbf x}\) \(\newcommand{\yvec}{\mathbf y}\) \(\newcommand{\zvec}{\mathbf z}\) \(\newcommand{\rvec}{\mathbf r}\) \(\newcommand{\mvec}{\mathbf m}\) \(\newcommand{\zerovec}{\mathbf 0}\) \(\newcommand{\onevec}{\mathbf 1}\) \(\newcommand{\real}{\mathbb R}\) \(\newcommand{\twovec}[2]{\left[\begin{array}{r}#1 \\ #2 \end{array}\right]}\) \(\newcommand{\ctwovec}[2]{\left[\begin{array}{c}#1 \\ #2 \end{array}\right]}\) \(\newcommand{\threevec}[3]{\left[\begin{array}{r}#1 \\ #2 \\ #3 \end{array}\right]}\) \(\newcommand{\cthreevec}[3]{\left[\begin{array}{c}#1 \\ #2 \\ #3 \end{array}\right]}\) \(\newcommand{\fourvec}[4]{\left[\begin{array}{r}#1 \\ #2 \\ #3 \\ #4 \end{array}\right]}\) \(\newcommand{\cfourvec}[4]{\left[\begin{array}{c}#1 \\ #2 \\ #3 \\ #4 \end{array}\right]}\) \(\newcommand{\fivevec}[5]{\left[\begin{array}{r}#1 \\ #2 \\ #3 \\ #4 \\ #5 \\ \end{array}\right]}\) \(\newcommand{\cfivevec}[5]{\left[\begin{array}{c}#1 \\ #2 \\ #3 \\ #4 \\ #5 \\ \end{array}\right]}\) \(\newcommand{\mattwo}[4]{\left[\begin{array}{rr}#1 \amp #2 \\ #3 \amp #4 \\ \end{array}\right]}\) \(\newcommand{\laspan}[1]{\text{Span}\{#1\}}\) \(\newcommand{\bcal}{\cal B}\) \(\newcommand{\ccal}{\cal C}\) \(\newcommand{\scal}{\cal S}\) \(\newcommand{\wcal}{\cal W}\) \(\newcommand{\ecal}{\cal E}\) \(\newcommand{\coords}[2]{\left\{#1\right\}_{#2}}\) \(\newcommand{\gray}[1]{\color{gray}{#1}}\) \(\newcommand{\lgray}[1]{\color{lightgray}{#1}}\) \(\newcommand{\rank}{\operatorname{rank}}\) \(\newcommand{\row}{\text{Row}}\) \(\newcommand{\col}{\text{Col}}\) \(\renewcommand{\row}{\text{Row}}\) \(\newcommand{\nul}{\text{Nul}}\) \(\newcommand{\var}{\text{Var}}\) \(\newcommand{\corr}{\text{corr}}\) \(\newcommand{\len}[1]{\left|#1\right|}\) \(\newcommand{\bbar}{\overline{\bvec}}\) \(\newcommand{\bhat}{\widehat{\bvec}}\) \(\newcommand{\bperp}{\bvec^\perp}\) \(\newcommand{\xhat}{\widehat{\xvec}}\) \(\newcommand{\vhat}{\widehat{\vvec}}\) \(\newcommand{\uhat}{\widehat{\uvec}}\) \(\newcommand{\what}{\widehat{\wvec}}\) \(\newcommand{\Sighat}{\widehat{\Sigma}}\) \(\newcommand{\lt}{<}\) \(\newcommand{\gt}{>}\) \(\newcommand{\amp}{&}\) \(\definecolor{fillinmathshade}{gray}{0.9}\)

    Learning Outcomes

    At the end of this chapter you will be able to do the following:

    Define divorce
    Analyze divorce trends
    Define marital entropy
    Apply Social Exchange Theory to divorce choices
    Explain Levinger’s Model of Rational Choice for Divorce
    Recall actions that minimize the risk of divorce

    Definitions

    In the United States, marriage is the legal union of a man and a woman. Outside of the U.S., most societies define marriage between a man and a woman or between a man and women (for example, polygamy among a variety of religious and tribal cultures throughout the world).

    Same-sex marriage is the legal union of two people of the same sex. Since 2001 when the Netherlands granted same-sex marriage rights to its citizens, about six other Western nations have granted same-sex marriage rights. Many countries refuse to give same-sex marriage rights to its citizens. Notice that in modern societies, the state government claims the authority to grant marriage rights. This has not always been true for Western societies. A few centuries ago, tribal or clan leaders, a father, or elderly members of small groups could grant marriages.

    To legally marry in the United States today, one simply goes to the local county or state office and applies for a state marriage license. The state also claims authority in granting divorce rights to couples. Divorce is the legal dissolution of a previously granted marriage.

    Most marriages still endure, and the odds are that divorce won’t happen to most marriages.

    It is a myth that one in two marriages eventually ends in divorce. There are a few myths about U.S. divorce trends that will be dispelled in this chapter. You might have heard the myth of the Seven-Year Itch where divorce happens prior to or shortly after the 7th year. Current government estimates indicate that about 75% of couples make their ten-year anniversary in their first marriage.1 The myths are false, but divorce does happen more today than it did 50 years ago and more people today are currently divorced than were currently divorced 50 years ago.

    We’ll discuss these trends in divorce rates below, but first we must define cohort. A cohort is a group of people who share some demographic characteristic, typically a year such as their birth year or marriage year. The Baby Boom is a cohort of those born between 1946 and 1964 and represented a never before nor never repeated high period of birth rates that yielded about 70 million living Baby Boomers today.

    There are few different rates for measuring divorce. The most common divorce rate used by the U.S. Census Bureau is the number of divorces/1,000 population. Another divorce rate is the number of divorces/1,000 married women. The divorce rate that most hear about is the predictive divorce rate which is the percent of people who had married in a given year who will divorce at some point before death. The National Center for Health Statistics reported that in 2001, 43% of marriages break up within the first 15 years of marriage.2 That was the highest official scientifically-based divorce risks estimate ever reported. So for example of those who married in the year 2001, about 43% are predicted to divorce at some point before their 15th anniversary. It is estimated that close to half of them will divorce before one of them dies.

    Figure 1 shows the United States marriage and divorce rates/1,000 population from 1900 to 2006. Notice that divorce rates have always been much lower than marriage rates in the U.S. Also notice that marriage and divorce rates moved in very similar directions over the last century. A slight rise is visible after both WWI and WWII ended (1919 and 1946). A slight decline is visible during the Depression (1930s) and turbulent 1960s. Most importantly notice that both marriage and divorce rates have been declining in the 1990s and 2000s. Younger people today are waiting to marry until their late twenties (delayed marriage) while cohabiting has increased in the U.S.

    Figure 1 also shows the trends in ratio of divorces to marriages for the U.S. In 1900 there was 1 divorce per 13 marriages that year or 1:13; in 1930, 1:6; in 1950, 1:4; in 1970, 1:3; 1980, 1:2; 1990, 1:2; and 2006, 1:2. Today, that means that every year there are two state-sanctioned legal marriages with only one state-sanctioned legal dissolution of a marriage. For the last 12 months ending in December 2008 there was a marriage rate of 7.1 marriages for every 1,000 population and a divorce rate of 3.5 divorces for every 1,000 population. That translates to over 2.1 million marriages and about 1 million divorces in 2008.

    Figure 2 shows a more detailed description of U.S. divorce rates since 1940 and some of the factors that contributed to them. As you already noticed in Figure 1, divorce rates were relatively low prior to 1940. But, in the 1940s WWII was ongoing and divorce rates moved upward with a spike in 1946. Keep in mind that 1946 was the United States’ most unusual year for family-related rates. Divorce rates, marriage rates, birth rates, and remarriage rates surged during this year while couples married at their lowest median age in U.S. history.

    After 1946, divorce rates fell to steady low levels and remained there until the 1960s when they slowly began to rise. The Baby Boomers directly and indirectly influenced the rise of divorce rates. In 1964 the first among the Baby Boomers became 18 and entered the prime marriage market years. For the next two decades Baby Boomers added about four million men and women to the marriage market each year. Thus, Baby Boomers raised the numbers of married people and thereby the numbers at risk of divorcing.

    image

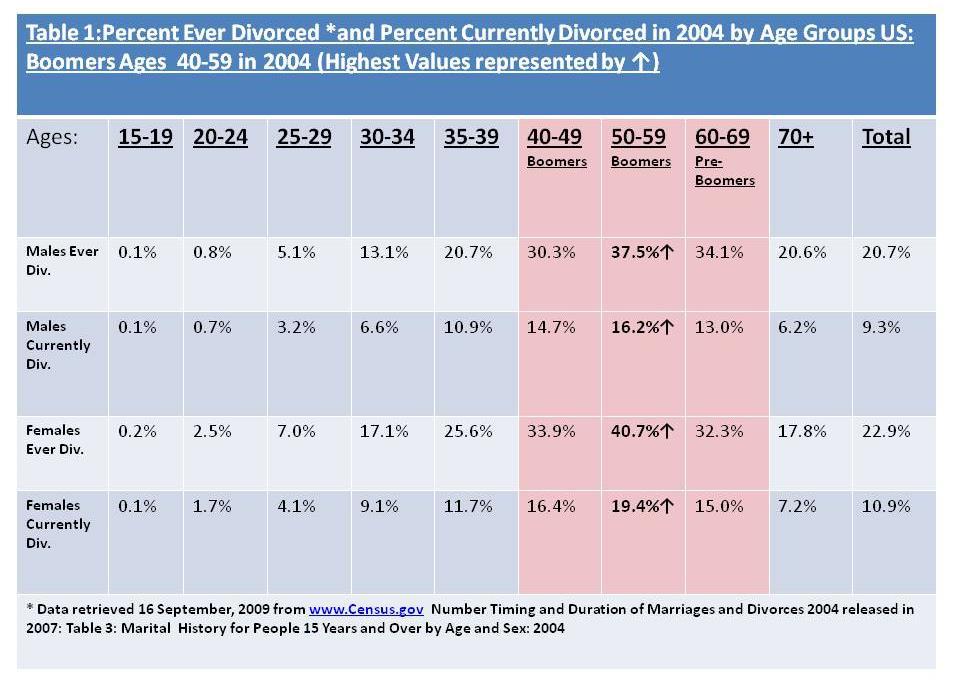
    Directly, Baby Boomers contributed to the divorce rate. Baby Boomers and those immediately preceding them (born 1936-1945) have very high rates of divorce. Table 1 shows that the experience of ever having divorced is not directly related to age. In other words, the oldest members of society have not divorced the most. In fact, it is the Baby Boomers and Pre-Baby Boomers who divorced the most followed by the oldest and then the younger cohorts. The imagesymbol in Table 1 signifies the highest ever divorced rates. This is in the 50-59 year old cohort (these are Baby Boomers born 1946-1955). The highest currently divorced rates also found among the women and men of the 50-59 cohort. The Baby Boomers 1946-1955 still hold the highest divorce rates by any cohort in U.S. history. Their unprecedented high divorce rates raised the overall divorce rates for the entire nation.

    image

    Measuring Divorce Rates

    When scientists and government researchers predict the risk you might have of divorcing they use the experiences of currently married people who have and have not divorced— therein lies part of the complication of deriving an “odds or risks of divorce” that we can have confidence in enough to offer advice to the soon-to-be-married. The U.S. has had its worst divorcing cohort ever and some of them will likely divorce again before their death. The trend among younger marrieds is to remain married longer and divorce less, but what if they collectively have an increase in their marital dissolution experiences? What if all of a sudden, millions of currently married couples flock to the courthouse to file for divorce?

    First, that scenario isn’t likely to happen because today’s married couples tend to remain married. Second, and this is more important, the national risk of divorce is different from your personal risk of divorce in one crucial factor—you have a great deal of influence in your own marriage quality and outcome. You and your spouse have much control over your marital experience, how you enhance it, how you protect it from stressors that can undermine it, and finally how you maintain it.

    Every year states grant marriages and divorces in a ratio that adds up to 3. In other words, about 2 marriages are granted by the state for every 1 divorce, even though in 2008 there were over 2.1 million marriages and about 1 million divorces (retrieved 17 September, 2009 from National Center for Health Statistics. Table A2. Provisional Vital Statistics for the US, Dec 2008; National vital Statistics Report Vol 57, Number 19). Thus, the ratio of 3 breaks down to 2:1 marriages: divorces.

    image
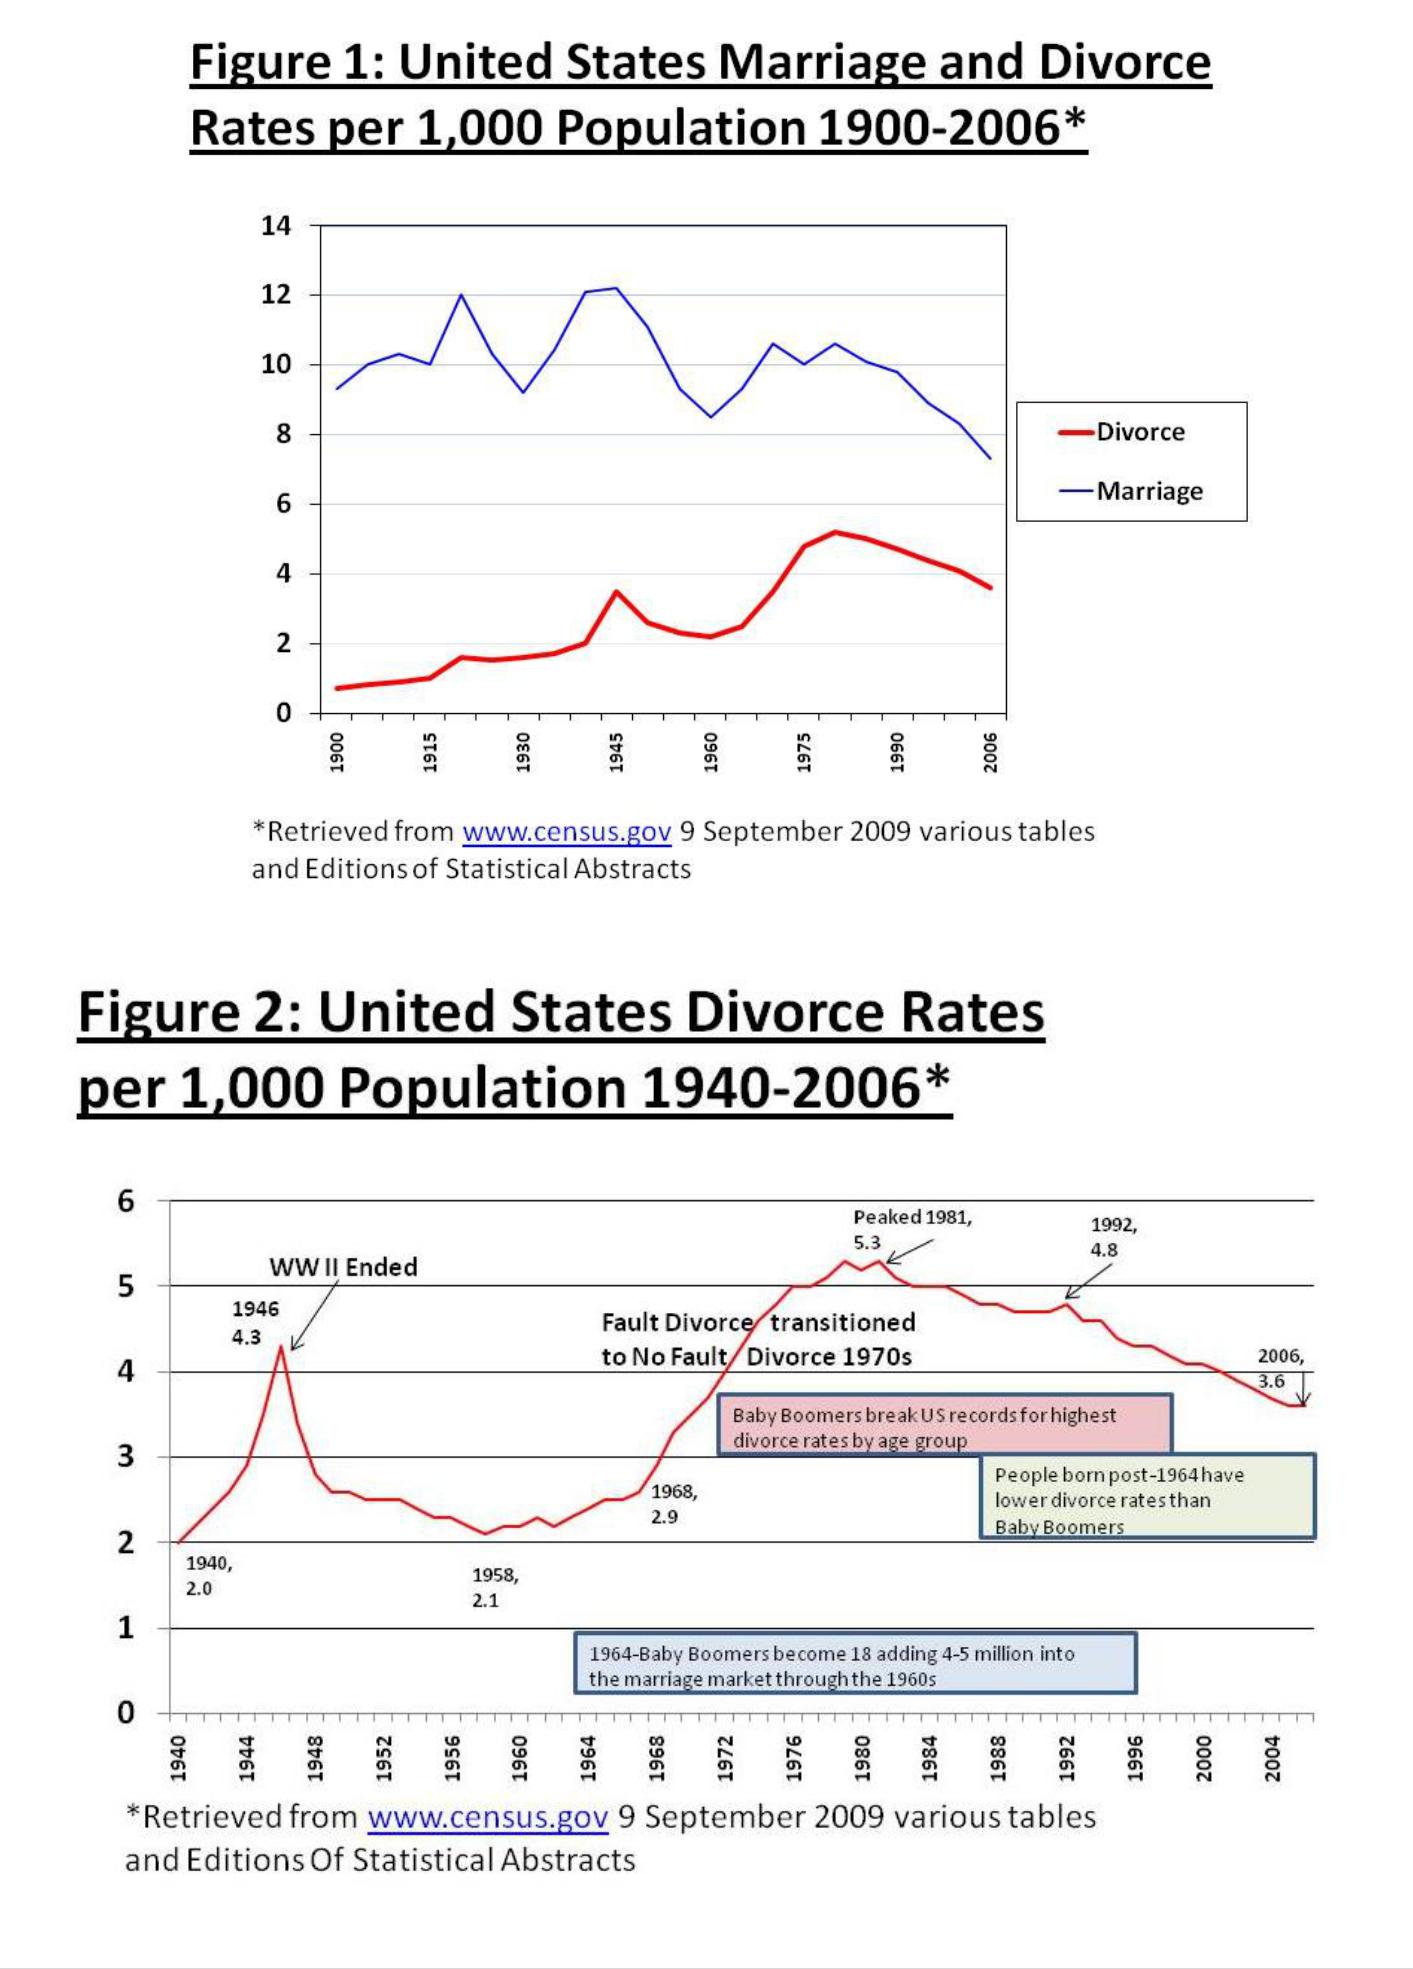
    Marriage and Divorce Rates in the U.S. 1990-2007: This graph illustrates marriage and divorce rates in the U.S. 1990-2007. Source: Statistical Abstract, 2009.

    Most marriages still endure and the odds are that divorce won't happen to most marriages.

    It is a myth that 1 in 2 marriages eventually ends in divorce. There are a few myths about US divorce trends that will be dispelled in this chapter. You might have heard the myth of the “Seven-year itch” where divorce happens prior to or shortly after the 7th year.

    Current government estimates indicate that about 75 percent of couples make their ten-year anniversary in their first marriage(see US Census Bureau, 2004 Detailed Tables-Number, Timing and Duration of Marriages and Divorces: 2004; Table 2 Percent Reaching Stated Anniversary, By Marriage Cohort and Sex, and Sex for first and Second Marriages, Retrieved 9 Sept 2009 from www.census.gov). The myths are false, but divorce does happen more in our day than it did 50 years ago and more people today are currently divorced than were currently divorced 50 years ago.

    Figure 4 shows a list of more and less commonly used divorce rates. We have already discussed the Crude Divorce rate, Refined Divorce Rate, Proportion Divorced, and Percent Ever Divorced. The adult Divorce rate is much less commonly used because in the United States, most who marry are already 18 and older. The ratio approach to measuring divorce and marriage can be expressed as actual numbers (in 2008 there were over 2.1 million marriages and about 1 million divorces in the US) or as a ratio of 1 divorce/2 marriages in the US in 2006.

    Figure 4 Annual Divorce Rates Used by Statisticians for Given Population (e.g. the United States)

    More Commonly Used

    1. Crude Divorce Rate: # of divorces per 1,000 population
    2. Refined Divorce Rate: # of divorces per 1,000 married women
    3. Proportion Divorced: % of population currently divorced
    4. Percent Ever Divorced: answer to a survey question about marital history

    Less Commonly Used

    1. Adult Divorce Rate: # of divorcees per 1,000 adults (18 years and older)
    2. Divorce Ration: # of divorces per # of marriages in a given year

    Effect of Baby Boomers on the Divorce Rate

    We'll discuss these trends in divorce rates below, but first we must define cohort. A cohort is a group of people who have some demographic characteristic, typically associated with their birth year or group of birth years. The Baby Boom is a cohort of those born between 1946 and 1964 and represented a never before nor never after repeated high period of birth rates that yielded about 70 million living Baby Boomers today (i.e., 1946-1964).

    There are few different rates for measuring divorce. The most common divorce rate used by the US Census Bureau is the number of divorces/1,000 population, called the crude divorce rate. Another divorce rate is the number of divorces/1,000 married women, called the refined divorce rate.

    Look at Figure 1 below to see the United States marriage and divorce rates/1,000 population from 1900 to 2006. Notice that divorce rates have always been much lower than marriage rates in the US. Also notice that marriage and divorce rates moved in very similar directions over the last century. A slight rise is visible for both after WWI and WWII ended (1919 and 1946). A slight decline is visible during the Depression (1930s) and turbulent 1960s. Most importantly notice that both marriage and divorce rates have been declining in the 1990s and 2000s. Younger people today wait to marry until their late twenties (Delayed Marriage) while other family forms such as single parenting, cohabiting, and three-generational families have increased in the US.

    Figure 1 also shows the trends in ratio of divorces to marriages for the US. In 1900 there was 1 divorce per 13 marriages that year or 1:13, in 1930 1:6, in 1950 1:4, in 1970 1:3, 1980 1:2, 1990 1:2, and 2006 1:2. Today, that means that every year there are to state-sanctioned legal marriages with only 1 state-sanctioned legal dissolution of a marriage.

    One plus two equals three. For the last 12 months ending in December 2008 there was a marriage rate of 7.1 marriages for every 1,000 population and a divorce rate of 3.5 divorces for every 1,000 population. As mentioned above, that translates to over 2.1 million marriages and about 1 million divorces in 2008.

    Divorce rate increases from 1900, marriage rate constant with decrease atfter 1975.

    Figure \(\PageIndex{1}\). United States Marriage and Divorce Rates per 1,000 Population 1900-2006. www.census.gov/prod/2005pubs/p70-97.pdf.

    The National center for Health Statistics reported May 24 2001 that 43 percent of current marriages break up within the first 15 years of marriage (see Center of Disease Control and Prevention). That was in 2001 and not today. It was the highest official scientifically-based divorce risks estimate given which was a full 7 percentage points shy of the 50/50 figure carelessly thrown around in the media and classrooms.

    Figure \(\PageIndex{2}\) shows a more detail description of US divorce rates since 1940 and some of the factors that contributed to them. As you already noticed in Figure \(\PageIndex{1}\), divorce rates were relatively low prior to 1940. But, in the 1940s WWII was ongoing and divorce rates moved upward with a one-year spike in 1946. As a reminder, keep in mind that 1946 was the United States' most unusual year for family-related rates. Divorce rates, marriage rates, birth rates and remarriage rates surged during this year while couples married at their lowest median age in US history. Remember that the Baby Boom began in 1946.

    divorce rate throughout history

    Figure \(\PageIndex{2}\). United States Divorce Rates per 1,000 Population 1900-2006
    Table \(\PageIndex{1}\): Percent Ever Divorced *and Percent Currently Divorced in 2004 by Age Groups US: Boomers Ages 40-59 in 2004
    Ages 15-19 20-24 25-29 30-34 35-39 40-49 Boomers 50-59 Boomers 60-69 Pre-Boomers 70+ Total
    Males Ever Div. 0.1% 0.8% 5.1% 13.1% 20.7% 30.3% 37.5% 34.1% 20.6% 20.7%
    Males Currently Div. 0.1% 0.7% 3.2% 6.6% 10.9% 14.7% 16.2% 13.0% 6.2% 9.3%
    Females Ever Div. 0.2% 2.5% 7.0% 17.1% 25.6% 33.9% 40.7% 32.3% 17.8% 22.9%
    Females Currently Div. 0.1% 1.7% 4.1% 9.1% 11.7% 16.4% 19.4% 15.0% 7.2% 10.9%

    *Data retrieved 16 September, 2009 from www.Census.gov Number Timing and Duration of Marriages and Divorce 2004 released in 2007: Table 3. Marital History for People 15 Years and Over by Age and Sex: 2004

    When scientists and government researchers predict the risks you might have of divorce they use the experiences of currently married people who have and have not divorced-therein lies part of the complication of deriving an “odds or risks of divorce” that we can have confidence in enough to offer advice to the soon-to-be-married. The US has had its worst divorcing cohort ever and some of them will likely divorce again before their death. The trend among younger marrieds is to remain married longer and divorce less…but, what if they collectively have an increase in their marital dissolution experiences?

    What if all of the sudden, millions and millions of currently married couples flock to the courthouse to file for divorce?
     

    Key Points

    • Marriage is a legal union; divorce is its legal dissolution.

    • Cohorts (like Baby Boomers) help track divorce trends over time.

    • The idea that half of marriages end in divorce is a myth; about 75% of first marriages reach the 10-year mark.

    • Divorce and marriage rates generally rise and fall together and have declined since the 1990s.

    • Baby Boomers have the highest divorce rates in U.S. history and heavily influenced national divorce trends.

    • Divorce is measured using several indicators, including the crude divorce rate, refined divorce rate, proportion divorced, and percent ever divorced.

    • In 2001, the highest reliable estimate showed 43% of marriages end within 15 years—still below 50%.

    • The U.S. typically sees about 2 marriages for every 1 divorce.

    • National divorce statistics do not determine individual outcomes; couples have control over their own marital stability.


    This page titled 12: Separation and Divorce is shared under a CC BY 3.0 license and was authored, remixed, and/or curated by Ron J. Hammond via source content that was edited to the style and standards of the LibreTexts platform.