Social Sci LibreTexts

7.2: History and Demographics

  • Page ID
    196236
  • \( \newcommand{\vecs}[1]{\overset { \scriptstyle \rightharpoonup} {\mathbf{#1}} } \)

    \( \newcommand{\vecd}[1]{\overset{-\!-\!\rightharpoonup}{\vphantom{a}\smash {#1}}} \)

    \( \newcommand{\id}{\mathrm{id}}\) \( \newcommand{\Span}{\mathrm{span}}\)

    ( \newcommand{\kernel}{\mathrm{null}\,}\) \( \newcommand{\range}{\mathrm{range}\,}\)

    \( \newcommand{\RealPart}{\mathrm{Re}}\) \( \newcommand{\ImaginaryPart}{\mathrm{Im}}\)

    \( \newcommand{\Argument}{\mathrm{Arg}}\) \( \newcommand{\norm}[1]{\| #1 \|}\)

    \( \newcommand{\inner}[2]{\langle #1, #2 \rangle}\)

    \( \newcommand{\Span}{\mathrm{span}}\)

    \( \newcommand{\id}{\mathrm{id}}\)

    \( \newcommand{\Span}{\mathrm{span}}\)

    \( \newcommand{\kernel}{\mathrm{null}\,}\)

    \( \newcommand{\range}{\mathrm{range}\,}\)

    \( \newcommand{\RealPart}{\mathrm{Re}}\)

    \( \newcommand{\ImaginaryPart}{\mathrm{Im}}\)

    \( \newcommand{\Argument}{\mathrm{Arg}}\)

    \( \newcommand{\norm}[1]{\| #1 \|}\)

    \( \newcommand{\inner}[2]{\langle #1, #2 \rangle}\)

    \( \newcommand{\Span}{\mathrm{span}}\) \( \newcommand{\AA}{\unicode[.8,0]{x212B}}\)

    \( \newcommand{\vectorA}[1]{\vec{#1}}      % arrow\)

    \( \newcommand{\vectorAt}[1]{\vec{\text{#1}}}      % arrow\)

    \( \newcommand{\vectorB}[1]{\overset { \scriptstyle \rightharpoonup} {\mathbf{#1}} } \)

    \( \newcommand{\vectorC}[1]{\textbf{#1}} \)

    \( \newcommand{\vectorD}[1]{\overrightarrow{#1}} \)

    \( \newcommand{\vectorDt}[1]{\overrightarrow{\text{#1}}} \)

    \( \newcommand{\vectE}[1]{\overset{-\!-\!\rightharpoonup}{\vphantom{a}\smash{\mathbf {#1}}}} \)

    \( \newcommand{\vecs}[1]{\overset { \scriptstyle \rightharpoonup} {\mathbf{#1}} } \)

    \( \newcommand{\vecd}[1]{\overset{-\!-\!\rightharpoonup}{\vphantom{a}\smash {#1}}} \)

    Latinx Subgroups

    Mexican Americans form the largest subgroup and also the oldest of Latinx subgroups. Prior to the annexation of Texas and the Mexican-American War, the Southwest portion of the United States was Mexican and Spanish territory. As the United States began to expand westward under the guise of "Manifest Destiny" and the conquest of Indigenous ancestral lands, there were political, economic, and ideological pressures to acquire Mexican territories. With the Battle of San Jacinto in 1836, the Mexican-American War of 1846 and the Gadsen Purchase of 1853, the U.S. succeeded in acquiring most of the Southwest from Mexico. The Treaty of Guadalupe Hidalgo, signed at the end of the war between Mexico and the U.S., guaranteed specific rights to all people of Mexican origin living in the U.S. including full American citizenship, retention of Spanish as a legitimate language, political rights, and the retention of land ownership. These rights were not honored by the U.S. and the Mexicans subsequently experienced a significant loss of land, social status, culture and language. They were treated as second-class citizens and a source of expendable labor.

    Mexican migration to the United States increased in the early 1900s in response to the need for agricultural labor. Mexican migration during this period was often circular; workers would stay for a few years and then go back to Mexico with more money than they could have made in their country of origin. The length of Mexico’s shared border with the United States has made immigration easier than for many other immigrant groups. There were also periods of anti-immigrant sentiment culminating in deportations and repatriations, such as during the Great Depression in the 1930's and Operation Wetback during the 1950's. After the passage of the Immigration and Nationality Act of 1965, which removed national-origins quotas and allowed for family reunification, the percentage of immigrants from Mexico grew considerably.

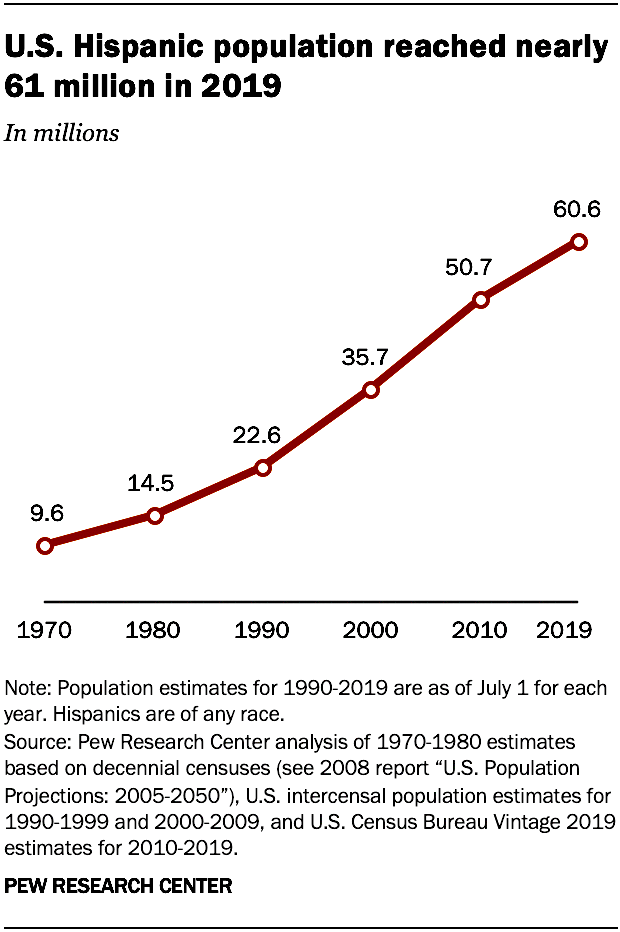
    U.S. Hispanic population reached nearly 61 million in 2019
    Figure \(\PageIndex{1}\): U.S. Hispanic population reached nearly 61 million in 2019. (Used with permission; U.S. Hispanic population surpassed 60 million in 2019, but growth has slowed. Pew Research Center, Washington, D.C. (2020))

    The socio-historical forces that forged the Puerto Rican population in the United States are different than those that created the Mexican-American community but were also influenced by U.S. imperialism and expansion. The end of the Spanish-American War of 1898 brought U.S. citizenship to Puerto Ricans and the Jones Act of 1917 allowed them open access to the U.S. mainland prior to the island becoming a commonwealth in 1952. These changes in concert with neo-liberal policies such as Operation Bootstrap created economic conditions that pushed Puerto Ricans onto the mainland. By the 1940s, 70,000 Puerto Ricans had settled on the mainland and by the 1950s, nearly 20 percent of the Puerto Rican population now resided on the mainland. By 1970, the number had grown to 800,000 and to 2.4 million in the early 1990's. Today, there approximately 5.1 million Latinx of Puerto Rican descent living in the United States, representing the second-largest Latinx subgroup. About 30% of them were born in Puerto Rico. More recently, there has been an increase in migration to the state of Florida. According to the Pew Research Center, since the aftermath of Hurricane María, the Puerto Rican population in Florida has increased to one million, and 29% of mainland Puerto Ricans now live in Florida.

    Cuban Americans are the third-largest Latinx subgroup, and their history is quite different from that of Mexican Americans. The main wave of Cuban immigration to the United States started after Fidel Castro came to power in 1959 and reached its crest with the Mariel boatlift in 1980. Castro’s Cuban Revolution ushered in an era of communism that continues to this day. To avoid having their assets seized by the government, many wealthy and educated Cubans migrated north, generally to the Miami area. Prior to the revolution, fewer than 50,000 Cubans lived in the United States. By 1973, the numbers grew to 500,000 and 1 million by 1993. Today, there are approximately 2.3 million Latinx of Cuban origin in the United States and mostly concentrated in Florida (66%). There are important factors that have differentiated the Cuban experience from that of other Latinx groups. For instance, most Cubans came to the U.S. as political refugees and have received a positive reception from the U.S. government with the passage of the Cuban Adjustment Act of 1966 and the "Wet-foot, dry-foot" policy modification passed in the 1990s (later rescinded by President Obama in 2017). Second, the majority of first wave Cuban refugees were from the middle and upper classes, displaced by the Cuban revolution. With the support and aid provided by the U.S. government, many were able to apply their business skills and educational training in the United States. In Southern Florida, a much larger percentage of businesses and banks are owned by Cubans compared to other Latinx communities.

    The Latinx population reached 60.6 million in 2019, up from 50.7 million in 2010, accounting for 52% of the overall U.S. population growth over this period. However, the population growth rate of the Latinx population has slowed consistently over time. For example, between 1995 and 2000, the population growth was 4.8% while between 2015-2019 the population growth was 1.9%.

    The Latinx population also has the lowest median age among the four major racial/ethnic groups. The median age is 30 while median age for whites is 44, 38 for Asian Americans, and 35 for African Americans. The younger age composition has important sociological ramifications such as representation in the educational system, the composition and percentage of new voters, and future demographic growth.

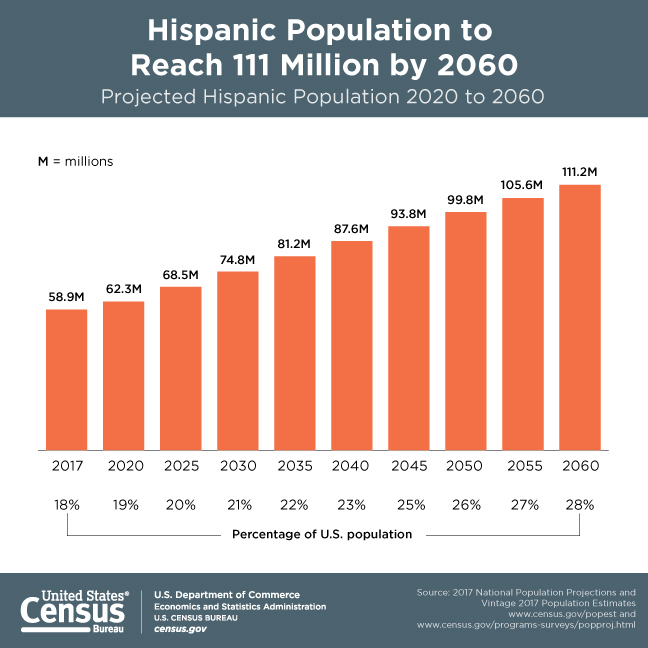
    The Hispanic Population will reach 111 million by 2060.
    Figure \(\PageIndex{2}\): Projected Hispanic Population Growth in the United States. (CC PDM 1.0; via U.S. Census Bureau)

    Country of Origin

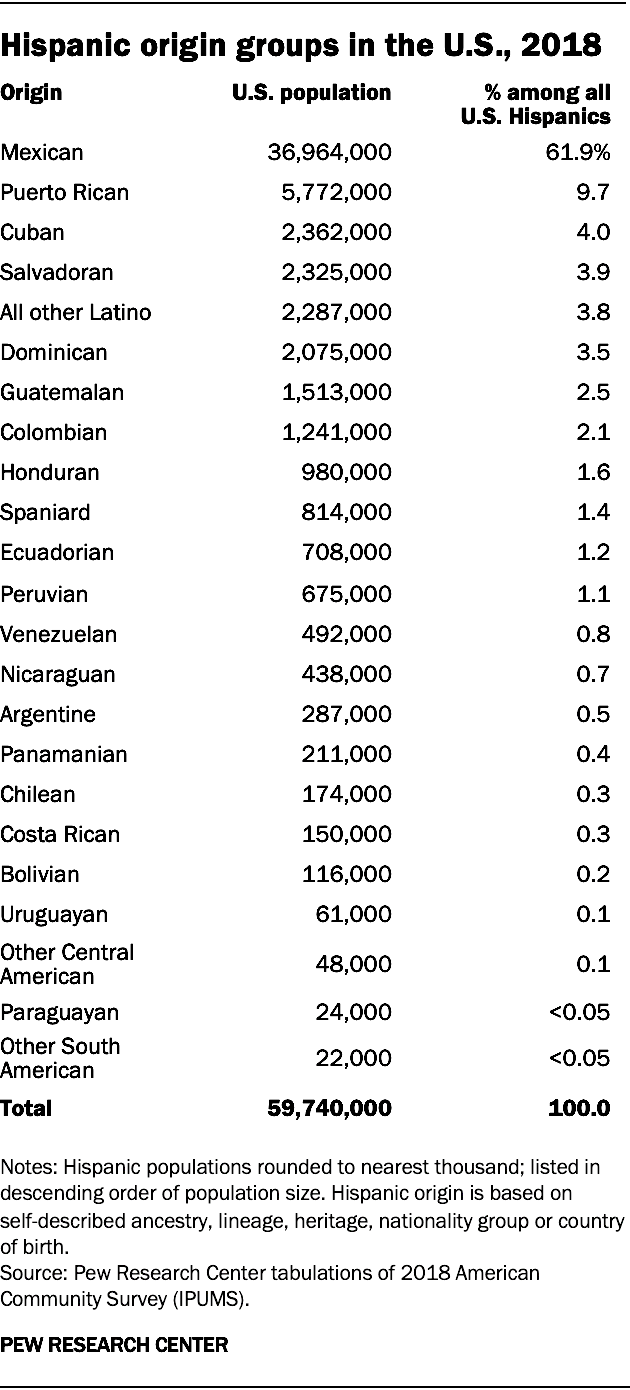
    According to the Pew Research Center, figure 8.1.3 shows that in 2018 the Mexican-origin population accounted for 62% of the overall Latinx population in the United States. The second largest group, Puerto Ricans, has seen an increase in migration from the island to the mainland in the last few years and made up 9.7% of the U.S. Latinx population. The third-largest group is the Cuban-origin population, made up 4% of the U.S. Latinx population and the Salvadoran-origin population is close behind with 3.9%. The South American subgroup with the highest percentage is Colombian, making up 2.1% of the total Latinx population. The remainder of Central and South Americans countries on the list each make up less than 2 percent of the total population but represent a wide array of rich regional traditions and cultures.

    Figure \(\PageIndex{3}\): Hispanic origin groups in the U.S., 2018. (Used with permission; Pew Research Center, Washington, D.C. (2020))Hispanic origin groups in the U.S., 2018

    Immigration Status and Citizenship

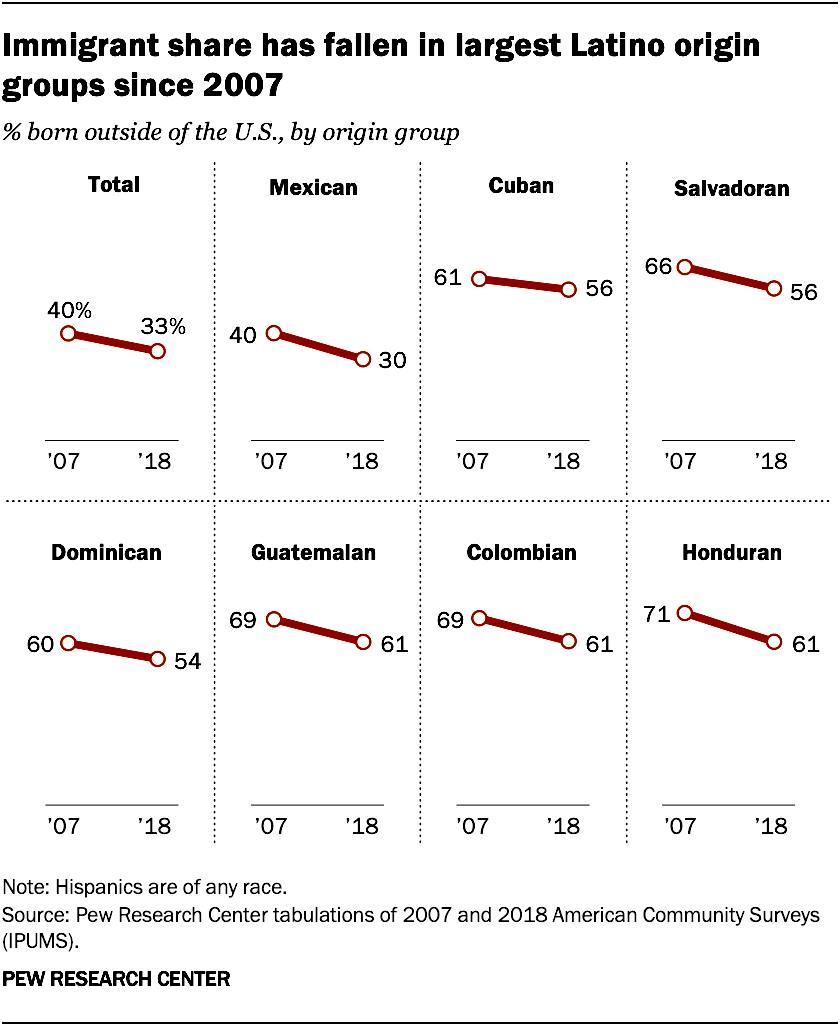
    Overall, in 2018 approximately 80% of the Latinx population are U.S. citizens, including those living in Puerto Rico. Due to their unique historical colonial experience, virtually all Puerto Ricans are U.S. citizens. Panamanians (89%) and Mexicans (80%) have among the highest citizenship rates, which Hondurans (53%) and Venezuelans (51%) have the lowest citizenship rates. According to Figure 8.1.4, the overall share of Latinx immigrants has dropped since 2007 and immigrants now make up 33% of the total Latinx population. As the largest group by far, the Mexican population is close to the mean and approximately 30% of its population are immigrants. Similarly, all other groups have experienced a drop in percentage of foreign-born in their respective groups. Cubans, Salvadorans, and Dominicans have a similar percentage of foreign-born with 56%, 56%, and 54%, respectively. Guatemalans, Colombians, and Hondurans all have a foreign-born rate of 61%.

    Immigrant share has fallen in largest Latino origin groups since 2007
    Figure \(\PageIndex{4}\): Immigration share has fallen in larges Latino origin groups since 2007. (Used with permission; Pew Research Center, Washington, D.C. (2020))

    Identity and labels

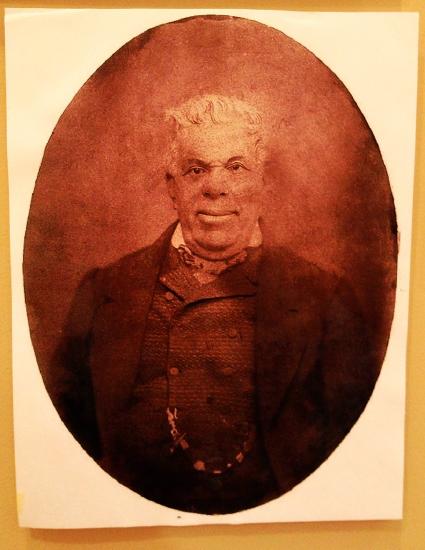
    The labels that people of Latinx heritage use depends on the historical, regional, cultural, and political context. Labels can also be self-imposed, such as Chicano or Chicana, or imposed from without, such as Hispanic. Some ethnic labels, such as Californio, are specific to a region (California) and historical context (1800's). For example, Pío Pico was the last Mexican Governor of California and was part of the Californios, a term referring to the political, economic, and cultural elites of Mexican heritage living in California in the 19th century.

    We will cover identity and labels in 7.6 and 7.7.

    Picture of Pio Pico (May 5, 1801 – September 11, 1894)
    Figure \(\PageIndex{5}\): Pío Pico (1801 - 1894): The last Mexican Governor of California. (CC BY-NC-SA 2.0; Joe Mud via Flickr)
    Our Local Stories: Mexican Immigration in the Central Valley

    "We didn't cross a border. The border crossed us"

    Latinos have come to be part of the United States through many different avenues: immigrants seeking a better life, refugees driven by war and those who did not move at all, but who found themselves on the other side of redefined borders as the United States expanded. Mexicans have been and continue to be a large presence in the Central Valley and Fresno County history and culture. From the 19th century till today successive waves of Mexican immigration have added to the rich ethnic diversity that is now Fresno County.

    The Fresno County Historical Society has been able to collect the personal stories and memories from many local Mexican Americans who immigrated to Fresno County in the early 20th century. Their stories were recorded in the 1970s, over 50 years ago. These stories are now available for you to listen to and learn from. Audio recordings and typed transcripts are included on the Fresno County Historical Society website.

    Contributors and Attributions

    Works Cited

    • Cohn, N. (2014, May 21). More Hispanics declaring themselves White. NY Times.
    • Chavez-Dueñas, N.Y., Adames, H.Y., & Organista, K.C. (2014). Skin-Color Prejudice and Within-Group Racial Discrimination: Historical and Current Impact on Latino/a Populations. Hispanic Journal of Behavioral Sciences. Vol. 36(1), pp. 3-26.
    • Gonzalez-Barrera, A. & Krogstad, J.M. (2019 June, 2019). What we know about [undocumented] immigration from Mexico. Pew Research Center.
    • Gutierrez, R. & Almaguer, T. (2016). Race, racializations, and Latino popuations in the United States in Gutierrez, R. and Almaguer, T. (Eds.) The New Latino Studies Reader: A 21st Century Perspective. Oakland, Ca: UC Press
    • Lopez, M. (2013). Hispanic Identity. Pew Research Center. October 22, 2013
    • Mora C. (2019). Making Hispanics: How activists, bureaucrats, and media Ccnstructed a new American. University of Chicago Press.
    • Noriega, C., Avila, E., Davalos, K., Sandoval, C., & Perez-Torres, R. (2010). The Chicano Studies Reader: An Anthology of Aztlan, 1970 - 2000. Los Angeles: UCLA Chicano Studies Research Center Press
    • Noe-Bustamante, L., Lopez, M.H., & Krogstad, J.M. (2020, July 27) U.S. Hispanic population surpassed 60 million in 2019, but growth has slowed. Pew Research Center.
    • Noe-Bustamane, L., Mora, L, & Lopez, M. (2020). About One-in-Four U.S. Hispanics Have Heard of Latinx, but Just 3% use it. Pew Research Center, August 11, 2020
    • Parker, K., Horowitz, J., Morin, R. & Lopez, M. (2015) Chapter 7: The Many Dimensions of Hispanic Racial Identity. Pew Research Center: Multiracial in America, June 11, 2015.
    • Schelenz, R. & Freeling, N. (2019, October 10). What's in a name? How the concepts of Hispanic and Latino identity emerged. UC News.