
2.3: Research Methods in Psychology
- Last updated
- Save as PDF
- Page ID
- 69354
There are many research methods available to psychologists in their efforts to understand, describe, and explain behavior and the that underlie it. Some methods rely on observational techniques. Other approaches involve interactions between the researcher and the individuals who are being studied—ranging from a series of simple questions to extensive, in-depth interviews—to well-controlled experiments. We'll begin our exploration of the research methods used in the study of lifespan development by considering the methods used by psychologists more generally.
Each of these research methods has unique strengths and weaknesses, and each method may only be appropriate for certain types of research questions. For example, studies that rely primarily on observation produce incredible amounts of information, but the ability to apply this information to the larger population is somewhat limited because of small sample sizes. Survey research, on the other hand, allows researchers to easily collect data from relatively large samples. While this allows for results to be generalized to the larger population more easily, the information that can be collected on any given survey is somewhat limited and subject to problems associated with any type of self-reported data. Some researchers conduct archival research by using existing records. While this can be a fairly inexpensive way to collect data that can provide insight into a number of research questions, researchers using this approach have no control on how or what kind of data was collected. Observational and descriptive methods are correlational in nature. This means that researchers can speak to important relationships that might exist between two or more variables of interest. However, correlational data cannot be used conclude that a causal connection exists.
An experiment is the only method that can confirm that a relationship between variables is due to a cause and effect connection. In experimental research, which will be discussed later in this chapter, there is a tremendous amount of control over the variables of interest. While this is a powerful approach, experiments are often conducted in very artificial settings. This calls into question the validity of experimental findings with regard to how they would apply in real-world settings. If an experiment is "valid", that means it is measuring what it is designed to measure. In addition, many of the questions that psychologists would like to answer cannot be pursued through experimental research because of ethical concerns.
Case Studies
In 2011, the New York Times published a feature story on Krista and Tatiana Hogan, Canadian twin girls. These particular twins are unique because Krista and Tatiana are conjoined twins, connected at the head. There is evidence that the two girls are connected in a part of the brain called the thalamus, which is a major sensory relay center. Most incoming sensory information is sent through the thalamus before reaching higher regions of the cerebral cortex for processing.
The implications of this potential connection mean that it might be possible for one twin to experience the sensations of the other twin. For instance, if Krista is watching a particularly funny television program, Tatiana might smile or laugh even if she is not watching the program. This particular possibility has piqued the interest of many neuroscientists who seek to understand how the brain uses sensory information.
These twins represent an enormous resource in the study of the brain, and since their condition is very rare, it is likely that as long as their family agrees, scientists will follow these girls very closely throughout their lives to gain as much information as possible (Dominus, 2011).
In observational research, scientists would be conducting a case study if they were to focus on one person or just a few individuals. Indeed, some scientists spend their entire careers studying just 10−20 individuals. Why would they do this? Obviously, when they focus their attention on a very small number of people, they can gain a tremendous amount of insight into those cases. The richness of information that is collected in clinical or case studies is unmatched by any other single research method. This allows the researcher to have a very deep understanding of the individuals and the particular phenomenon being studied.
If case studies provide so much information, why are they not more frequent among researchers? As it turns out, the major benefit of this particular approach is also a weakness. As mentioned earlier, this approach is often used when studying individuals who are interesting to researchers because they have a rare characteristic. Therefore, the individuals who serve as the focus of case studies are not like most other people. If scientists ultimately want to explain all behavior, focusing attention on such a special group of people can make it difficult to generalize any observations to the larger population as a whole. Generalizing refers to the ability to apply the findings of a particular research project to larger segments of society. Again, case studies provide enormous amounts of information, but since the cases are so specific, the potential to apply what’s learned to the average person may be very limited.
Naturalistic Observation
If you want to understand how behavior occurs, one of the best ways to gain information is to simply observe the behavior in its natural context. However, people might change their behavior in unexpected ways if they know they are being observed. How do researchers obtain accurate information when people tend to hide their natural behavior? As an example, imagine that your professor asks everyone in your class to raise their hand if they always wash their hands after using the restroom. Chances are that almost everyone in the classroom will raise their hand, but do you think hand washing after every trip to the restroom is really that universal?
This is very similar to the phenomenon mentioned earlier in this chapter: many individuals do not feel comfortable answering a question honestly. But if we are committed to finding out the facts about hand washing, we have other options available to us.
Suppose we send a classmate into the restroom to actually watch whether everyone washes their hands after using the restroom. Will our observer blend into the restroom environment by wearing a white lab coat, sitting with a clipboard, and staring at the sinks? We want our researcher to be inconspicuous—perhaps standing at one of the sinks pretending to put in contact lenses while secretly recording the relevant information. This type of observational study is called naturalistic observation: observing behavior in its natural setting. To better understand peer exclusion, Suzanne Fanger collaborated with colleagues at the University of Texas to observe the behavior of preschool children on a playground. How did the observers remain inconspicuous over the duration of the study? They equipped a few of the children with wireless microphones (which the children quickly forgot about) and observed while taking notes from a distance. Also, the children in that particular preschool (a “laboratory preschool”) were accustomed to having observers on the playground (Fanger, Frankel, & Hazen, 2012).
It is critical that the observer be as unobtrusive and as inconspicuous as possible: when people know they are being watched, they are less likely to behave naturally. If you have any doubt about this, ask yourself how your driving behavior might differ in two situations: In the first situation, you are driving down a deserted highway during the middle of the day; in the second situation, you are being followed by a police car down the same deserted highway.

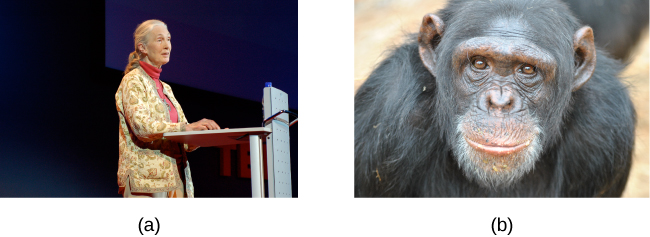
It should be pointed out that naturalistic observation is not limited to research involving humans. Indeed, some of the best-known examples of naturalistic observation involve researchers going into the field to observe various kinds of animals in their own environments. As with human studies, the researchers maintain their distance and avoid interfering with the animal subjects so as not to influence their natural behaviors. Scientists have used this technique to study social hierarchies and interactions among animals ranging from ground squirrels to gorillas. The information provided by these studies is invaluable in understanding how those animals organize socially and communicate with one another. The anthropologist Jane Goodall, for example, spent nearly five decades observing the behavior of chimpanzees in Africa. As an illustration of the types of concerns that a researcher might encounter in naturalistic observation, some scientists criticized Goodall for giving the chimps names instead of referring to them by numbers—using names was thought to undermine the emotional detachment required for the objectivity of the study (McKie, 2010).
The greatest benefit of naturalistic observation is the validity, or accuracy, of information (also referred to as data) collected without interference in a natural setting. Having individuals behave as they normally would in a given situation means that we have a higher degree of ecological validity, or realism, than we might achieve with other research approaches. Therefore, our ability to generalize the findings of the research to real-world situations is enhanced. If done correctly, we need not worry about people or animals modifying their behavior simply because they are being observed. Sometimes, people may assume that reality programs give us a glimpse into authentic human behavior. However, the principle of inconspicuous observation is violated as reality stars are followed by camera crews and are interviewed on camera for personal confessionals. Given that environment, we must doubt how natural and realistic their behaviors are.
The major downside of naturalistic observation is that they are often difficult to set up and control. In our restroom study, what if you stood in the restroom all day prepared to record people’s hand washing behavior and no one came in? Or, what if you have been closely observing a troop of gorillas for weeks only to find that they migrated to a new place while you were sleeping in your tent? The benefit of realistic data comes at a cost. As a researcher you have no control of when (or if) you have behavior to observe. In addition, this type of observational research often requires significant investments of time, money, and a good dose of luck.
Sometimes studies involve structured observation. In these cases, people are observed while engaging in set, specific tasks. An excellent example of structured observation comes from Strange Situation by Mary Ainsworth (you will read more about this later). The Strange Situation is a procedure used to evaluate attachment styles that exist between an infant and caregiver. In this scenario, caregivers bring their infants into a room filled with toys. The Strange Situation involves a number of phases, including a stranger coming into the room, the caregiver leaving the room, and the caregiver’s return to the room. The infant’s behavior is closely monitored at each phase, but it is the behavior of the infant upon being reunited with the caregiver that is most telling in terms of characterizing the infant’s attachment style with the caregiver.
Another potential problem in observational research is observer bias. Generally, people who act as observers are closely involved in the research project and may unconsciously skew their observations to fit their research goals or expectations. To protect against this type of bias, researchers should have clear criteria established for the types of behaviors recorded and how those behaviors should be classified. In addition, researchers often compare observations of the same event by multiple observers, in order to test inter-rater reliability: a measure of reliability that assesses the consistency of observations by different observers.
Surveys
Often, psychologists develop surveys as a means of gathering data. Surveys are lists of questions to be answered by research participants, and can be delivered as paper-and-pencil questionnaires, administered electronically, or conducted verbally. Generally, the survey itself can be completed in a short time, and the ease of administering a survey makes it easy to collect data from a large number of people.
Surveys allow researchers to gather data from larger samples than may be afforded by other research methods. A sample is a subset of individuals selected from a population, which is the overall group of individuals that the researchers are interested in. Researchers study the sample and seek to generalize their findings to the population.
There is both strength and weakness of the survey in comparison to case studies. By using surveys, we can collect information from a larger sample of people. A larger sample is better able to reflect the actual diversity of the population, thus allowing better generalizability. Therefore, if our sample is sufficiently large and diverse, we can assume that the data we collect from the survey can be generalized to the larger population with more certainty than the information collected through a case study. However, given the greater number of people involved, we are not able to collect the same depth of information on each person that would be collected in a case study.
Another potential weakness of surveys is something we touched on earlier in this chapter: People don't always give accurate responses. They may lie, misremember, or answer questions in a way that they think makes them look good. For example, people may report drinking less alcohol than is actually the case.
Any number of research questions can be answered through the use of surveys. One real-world example is the research conducted by Jenkins, Ruppel, Kizer, Yehl, and Griffin (2012) about the backlash against the US Arab-American community following the terrorist attacks of September 11, 2001. Jenkins and colleagues wanted to determine to what extent these negative attitudes toward Arab-Americans still existed nearly a decade after the attacks occurred. In one study, 140 research participants filled out a survey with 10 questions, including questions asking directly about the participant’s overt prejudicial attitudes toward people of various ethnicities. The survey also asked indirect questions about how likely the participant would be to interact with a person of a given ethnicity in a variety of settings (such as, “How likely do you think it is that you would introduce yourself to a person of Arab-American descent?”). The results of the research suggested that participants were unwilling to report prejudicial attitudes toward any ethnic group. However, there were significant differences between their pattern of responses to questions about social interaction with Arab-Americans compared to other ethnic groups: they indicated less willingness for social interaction with Arab-Americans compared to the other ethnic groups. This suggested that the participants harbored subtle forms of prejudice against Arab-Americans, despite their assertions that this was not the case (Jenkins et al., 2012).
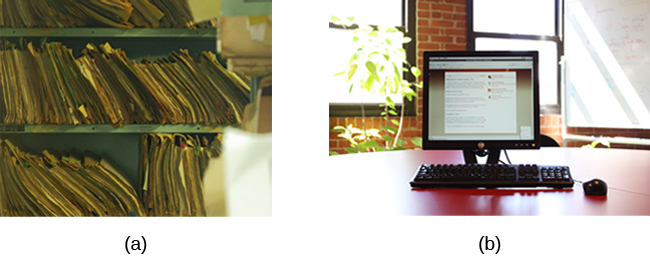
Archival Research
Some researchers gain access to large amounts of data without interacting with a single research participant. Instead, they use existing records to answer various research questions. This type of research approach is known as archival research. Archival research relies on looking at past records or data sets to look for interesting patterns or relationships.
For example, a researcher might access the academic records of all individuals who enrolled in college within the past ten years and calculate how long it took them to complete their degrees, as well as course loads, grades, and extracurricular involvement. Archival research could provide important information about who is most likely to complete their education, and it could help identify important risk factors for struggling students.
In comparing archival research to other research methods, there are several important distinctions. For one, the researcher employing archival research never directly interacts with research participants. Therefore, the investment of time and money to collect data is considerably less with archival research. Additionally, researchers have no control over what information was originally collected. Therefore, research questions have to be tailored so they can be answered within the structure of the existing data sets. There is also no guarantee of consistency between the records from one source to another, which might make comparing and contrasting different data sets problematic.
Did you know that as sales in ice cream increase, so does the overall rate of crime? Is it possible that indulging in your favorite flavor of ice cream could send you on a crime spree? Or, after committing crime do you think you might decide to treat yourself to a cone? There is no question that a relationship exists between ice cream and crime (e.g., Harper, 2013), but it would be pretty foolish to decide that one thing actually caused the other to occur.
It is much more likely that both ice cream sales and crime rates are related to the temperature outside. When the temperature is warm, there are lots of people out of their houses, interacting with each other, getting annoyed with one another, and sometimes committing crimes. Also, when it is warm outside, we are more likely to seek a cool treat like ice cream. How do we determine if there is indeed a relationship between two things? And when there is a relationship, how can we discern whether it is attributable to coincidence or causation?
Correlational Research
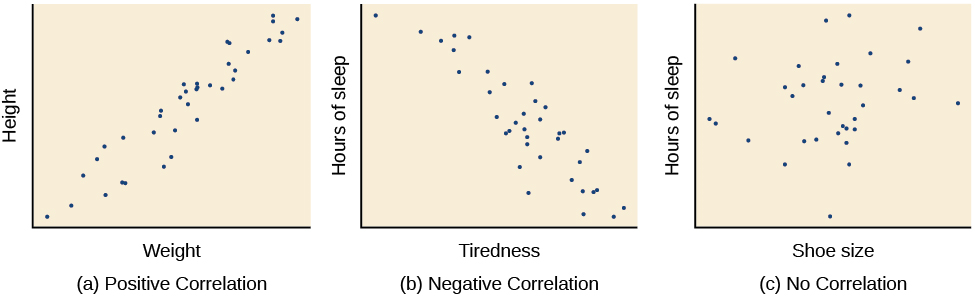
Correlation means that there is a relationship between two or more variables (such as ice cream consumption and crime), but this relationship does not necessarily imply cause and effect. When two variables are correlated, it simply means that as one variable changes, so does the other. We can measure correlation by calculating a statistic known as a correlation coefficient. A correlation coefficient is a number from −1 to +1 that indicates the strength and direction of the relationship between variables. The correlation coefficient is usually represented by the letter r.
The number portion of the correlation coefficient indicates the strength of the relationship. The closer the number is to 1 (be it negative or positive), the more strongly related the variables are, and the more predictable changes in one variable will be as the other variable changes. The closer the number is to zero, the weaker the relationship, and the less predictable the relationships between the variables becomes. For instance, a correlation coefficient of 0.9 indicates a far stronger relationship than a correlation coefficient of 0.3. If the variables are not related to one another at all, the correlation coefficient is 0. The example above about ice cream and crime is an example of two variables that we might expect to have no relationship to each other.
The sign—positive or negative—of the correlation coefficient indicates the direction of the relationship. A positive correlation means that the variables move in the same direction. Put another way, it means that as one variable increases so does the other, and conversely, when one variable decreases so does the other. A negative correlation means that the variables move in opposite directions. If two variables are negatively correlated, a decrease in one variable is associated with an increase in the other and vice versa.
The example of ice cream and crime rates is a positive correlation because both variables increase when temperatures are warmer. Other examples of positive correlations are the relationship between an individual’s height and weight or the relationship between a person’s age and number of wrinkles. One might expect a negative correlation to exist between someone’s tiredness during the day and the number of hours they slept the previous night: the amount of sleep decreases as the feelings of tiredness increase. In a real-world example of negative correlation, student researchers at the University of Minnesota found a weak negative correlation (r = -0.29) between the average number of days per week that students got fewer than 5 hours of sleep and their GPA (Lowry, Dean, & Manders, 2010). Keep in mind that a negative correlation is not the same as no correlation. For example, we would probably find no correlation between hours of sleep and shoe size.
As mentioned earlier, correlations have predictive value. Imagine that you are on the admissions committee of a major university. You are faced with a huge number of applications, but you are able to accommodate only a small percentage of the applicant pool. How might you decide who should be admitted? You might try to correlate your current students’ college GPA with their scores on standardized tests like the SAT or ACT. By observing which correlations were strongest for your current students, you could use this information to predict relative success of those students who have applied for admission into the university.
Correlation Does Not Indicate Causation
Correlational research is useful because it allows us to discover the strength and direction of relationships that exist between two variables. However, correlation is limited because establishing the existence of a relationship tells us little about cause and effect. While variables are sometimes correlated because one does cause the other, it could also be that some other factor, a confounding variable, is actually causing the systematic movement in our variables of interest. In the ice cream/crime rate example mentioned earlier, temperature is a confounding variable that could account for the relationship between the two variables.
Even when we cannot point to clear confounding variables, we should not assume that a correlation between two variables implies that one variable causes changes in another. This can be frustrating when a cause-and-effect relationship seems clear and intuitive. Think back to our discussion of the research done by the American Cancer Society and how their research projects were some of the first demonstrations of the link between smoking and cancer. It seems reasonable to assume that smoking causes cancer, but if we were limited to correlational research, we would be overstepping our bounds by making this assumption.
Unfortunately, people mistakenly make claims of causation as a function of correlations all the time. Such claims are especially common in advertisements and news stories. For example, recent research found that people who eat cereal on a regular basis achieve healthier weights than those who rarely eat cereal (Frantzen, Treviño, Echon, Garcia-Dominic, & DiMarco, 2013; Barton et al., 2005). Guess how the cereal companies report this finding. Does eating cereal really cause an individual to maintain a healthy weight, or are there other possible explanations, such as, someone at a healthy weight is more likely to regularly eat a healthy breakfast than someone who is obese or someone who avoids meals in an attempt to diet? While correlational research is invaluable in identifying relationships among variables, a major limitation is the inability to establish causality. Psychologists want to make statements about cause and effect, but the only way to do that is to conduct an experiment to answer a research question. The next section describes how scientific experiments incorporate methods that eliminate, or control for, alternative explanations, which allow researchers to explore how changes in one variable cause changes in another variable.

Illusory Correlations
The temptation to make erroneous cause-and-effect statements based on correlational research is not the only way we tend to misinterpret data. We also tend to make the mistake of illusory correlations, especially with unsystematic observations. Illusory correlations, or false correlations, occur when people believe that relationships exist between two things when no such relationship exists. One well-known illusory correlation is the supposed effect that the moon’s phases have on human behavior. Many people passionately assert that human behavior is affected by the phase of the moon, and specifically, that people act strangely when the moon is full.

There is no denying that the moon exerts a powerful influence on our planet. The ebb and flow of the ocean’s tides are tightly tied to the gravitational forces of the moon. Many people believe, therefore, that it is logical that we are affected by the moon as well. After all, our bodies are largely made up of water. A meta-analysis of nearly 40 studies consistently demonstrated, however, that the relationship between the moon and our behavior does not exist (Rotton & Kelly, 1985). While we may pay more attention to odd behavior during the full phase of the moon, the rates of odd behavior remain constant throughout the lunar cycle.
Why are we so apt to believe in illusory correlations like this? Often we read or hear about them and simply accept the information as valid. Or, we have a hunch about how something works and then look for evidence to support that hunch, ignoring evidence that would tell us our hunch is false; this is known as confirmation bias. Other times, we find illusory correlations based on the information that comes most easily to mind, even if that information is severely limited. And while we may feel confident that we can use these relationships to better understand and predict the world around us, illusory correlations can have significant drawbacks. For example, research suggests that illusory correlations—in which certain behaviors are inaccurately attributed to certain groups—are involved in the formation of prejudicial attitudes that can ultimately lead to discriminatory behavior (Fiedler, 2004).