Learning Objectives
- Understand the status of the nuclear family and other family ideals from a historical perspective.
- Describe the diversity of family forms today, including variation by social location.
- Summarize how the three major sociological perspectives and other theoretical perspectives frame family problems.
- Describe problems and consequences of divorce, family violence, the division of labor, and belonging.
- Connect these problems to larger social inequalities and cultural ideals.
- List strategies to address social problems of the institution of family.
When you think of family, what comes to mind? It may be the family you grew up in. It may be the family group you formed in college or with friends. It may be the family you are in now with a partner. Or it may be the favorite family you watch in movies or TV. We experience a wide range of families throughout our life.
As usual, sociologists are more specific. We have the definition of the US census, “A family is a group of two people or more (one of whom is the householder) related by birth, marriage, or adoption and residing together” (US Census 2021). We have the definition based on our “ideal” family, the nuclear family, the mom, the dad, two children, a dog, and a white picket fence. However, the lived experience of family is often different than both of those definitions.
Many sociologists consider family as a group of two or more people who are related by blood, marriage, adoption, or a mutual commitment of care. Defined in this way, the family is universal or nearly universal: Some form of the family has existed in every society, or nearly every society, that we know about (Starbuck 2010). Yet it is also true that many types of families have existed, and the cross-cultural and historical record indicates that these different forms of the family have benefits: They provide practical and emotional support for their members and they socialize their children.
It is important to keep this last statement in mind, because Americans until the last few decades thought of only one type of family the nuclear family mentioned above: A married heterosexual couple and their young children living by themselves under one roof. An extended family, which consists of parents, children, and other relatives, has a nuclear family at its core. Many one-parent families begin as nuclear families that dissolve upon divorce or separation or, more rarely, parental death.
Historically many children lived with only one parent rather than in a nuclear family (pictured here) because adults died earlier and many babies were born to unmarried parents.
Wikimedia Commons – CC BY 2.0
Although some prehistoric societies featured nuclear families, other societies studied by anthropologists have not had them. For instance, in some cultures, a father does not live with a woman after she births his child and sees them either irregularly or not at all. Despite the absence of a father and the lack of a nuclear family, this type of family arrangement has worked well in these societies. In particular, children are cared for and grow up to be productive members of these societies (Smith 1996).
These examples indicate that the functions of the nuclear family can be achieved through other family arrangements. If that is true, perhaps the oft-cited concern over the “breakdown” of the 1950s-style nuclear family in modern America is at least somewhat undeserved. As indicated by the examples just given, children can and do thrive without two parents. In short, the nuclear family is not the only viable form of family organization (Seccombe 2012).
In fact, although nuclear families are idealized in many societies, in practice they are something of a historical rarity: Until about a century ago, many spouses died by their mid-forties, and many babies were born outside of marriage. In medieval Europe, for example, people died early from disease, malnutrition, and other problems. One consequence of early mortality was that many children could expect to outlive at least one of their parents and thus essentially were raised in one-parent families or in stepfamilies (Gottlieb 1993).
During the American colonial period, different family types abounded, and the nuclear family was by no means the only type (Coontz 1995). Nomadic Native American groups often had relatively small nuclear families, while non-nomadic groups often had larger extended families. Because nuclear families among enslaved people were difficult to achieve due to social control at the hands of white landowners, enslaved people adapted by developing extended families, adopting orphans, and taking in other people not related by blood or marriage. Many European parents of colonial children died because average life expectancy was only 45 years. The one-third to one-half of children who outlived at least one of their parents lived in stepfamilies or with just their surviving parent. Mothers were so busy working the land and doing other tasks that they devoted relatively little time to child care, which instead was entrusted to older children or servants.
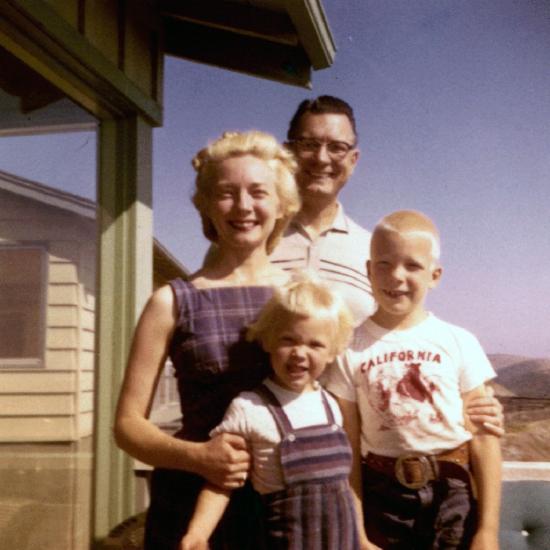
Moving much forward in US history, an important change in American families occurred during the 1940s after World War II ended. As men came home after serving in the military in Europe and Japan, books, magazines, and newspapers exhorted couples to have babies, and babies they did have: People got married at younger ages and the birth rate soared, resulting in the now famous baby boom generation. Meanwhile, the divorce rate dropped after having risen steadily earlier in the century. The national economy thrived as auto and other factory jobs multiplied, and many families for the first time could dream of owning their own homes (at least if they were white). Suburbs sprang up, and many families moved to them. Some families during the 1950s did indeed fit the Leave It to Beaver image of the breadwinner/homemaker model, in which the father/husband went out of the home for paid work and the mother/wife remained in the home doing unpaid domestic work.
Even so, less than 60% of American children during the 1950s lived in breadwinner-homemaker nuclear families. Moreover, many lived in poverty, as the poverty rate then was almost twice as high as it is today. Teenage pregnancy rates were about twice as high as today. Although not publicized back then, alcoholism, misuse of other drugs, and violence in families were common. Historians have found that many women in this era were unhappy with their homemaker roles, Mrs. Cleaver (Beaver’s mother) to the contrary, suffering from what Betty Friedan (1963) famously called the “feminine mystique.”
During the 1960s and 1970s, women began to enter the labor force (particularly white middle-class women, as other women were already working). They did so to increase their families’ incomes and to achieve greater self-fulfillment. More than 60% of married women with children under six years of age are now in the labor force (Bureau of Labor Statistics 2025), compared to less than 19% in 1960. At about the same time, divorce rates increased for several reasons that we examine later in this chapter.
Thus, the claim that US society was structured around a 'traditional family' and the idealization of that family form is somewhat misleading or misconstrued as US families have always been in flux and the nuclear family never represented all family forms (Coontz 1995).
Your own family may be just you and your kids right now. It may be that you live in an extended family, with parents and grandparents, a cousin and the baby, who is your niece but sometimes feels like your daughter. Some of your family may live here in the US, and some of your family lives elsewhere. It could be that the very word 'family' makes you a little sick to your stomach. Perhaps a parent disappeared from your life when you were young or kicked you out because you are LGBTQ+. Families are diverse themselves as are our experiences with them.
This chapter focuses on a variety of social problems related to family. We cover problems that typical textbooks may cover such as disparate outcomes for children and adults of different family structures. However, we also ask the question, “Who belongs?” We will consider who gets to decide what family is. We will look specifically at ethnicity and power, particularly in how definitions of citizenship and belonging have changed over time. We will also look at how LGBTQ+ families are changing definitions of belonging for themselves and others. We begin with a general discussion of families in the US today.
Contemporary Families
When sociologists examine the ways in which people live together and form families, they notice that diversity in family forms is increasing, although families have always been in flux. In this section we will introduce patterns and trends of contemporary US families, including marriage, cohabitation, and divorce, contexts for children and grandparents, and variation by social location.
This student-created ancillary involves interviews with individuals on their perceptions of family.
In this video, we asked people in downtown Grand Rapids what family means to them. We received some heartfelt answers. Everyone shared a different perspective, from the value of everlasting relationships to dependable support systems. We explored how traditional family roles have changed over time and what has remained the same, including how society’s expectations influence family life. Finally, we touched on what changes could make family life easier. Everyone’s perspective demonstrates that while families differ from one another, strong relationships and support systems are what hold families together.
Image credits: Untitled by Syadza Salsabyla, Untitled by Michael Ali, Untitled by Damla Özkan, Untitled by Newlife Church, and Untitled by Ravi Sharma via Unsplash are licensed under the standard Unsplash License
How Do People Really View Family? by Lexy Bening, Jenni Morales-Sandoval, Bri Vanderveen, Jordyn Harrington, and Kyle Pierpont is licensed under CC BY-NC 4.0
Marriage
Marriage rates have fallen in the United States. According to the US Census, in 2024 less than half of the population aged 15 years or older were married and not separated (47.9%), over one-third had never married (34.8%), slightly over 10% were divorced, over 5% were widowed, and less than 2% were separated while married (Census 2024).
In the figure below, we see that the adjusted marriage rate for women (the number of marriages in the past year per 1,000 women) has fallen substantially from 1970. The rate was 76.5 that year, then reached a low of 28.0 in 2021 during the COVID pandemic, before rising again to pre-pandemic levels (Loo 2023).
Although there has been a 'decline of marriage' in the US, its symbolic significance remains strong. In a recent PEW study, among young adults (aged 18 to 34) who had never married, 69% reported that they want to marry one day, whereas less than a quarter (23%) said that they aren't sure and 8% said that they don’t want to marry (Aragão 2024). As a culture, marriage continues to be strongly valued as it has benefits such as for health and finances, formalizes intimacy and love, and is seen as a status symbol (Cherlin 2004). As one sociologist has said, “Getting married is a way to show family and friends that you have a successful personal life. It’s like the ultimate merit badge” (Luscombe 2010).
In several ways, the US differs from other Western democracies in its view of marriage and in its behavior involving marriage and other intimate relationships (Cherlin 2010; Hull, Meier, & Ortyl 2012). First, Americans place more emphasis than their Western counterparts on the ideal of romantic love as a basis for marriage and other intimate relationships and on the cultural importance of marriage. Second, the US has higher rates of marriage than other Western nations such as the United Kingdom, Denmark and Poland. Third, the US also has higher rates of divorce than other Western nations. Fourth, Americans are more likely than other Westerners to remarry once they are divorced, to cohabit in short-term relationships, and in general, to move from one monogamous intimate relationship to another, a practice called serial monogamy.

Americans place more emphasis than Europeans on the ideal of romantic love as the basis for marriage. This emphasis helps account for why the US has a higher divorce rate than many European nations.
© Thinkstock
The US emphasis on romantic love helps account for its high rates of marriage, divorce, and serial monogamy. It leads people to want to be in an intimate relationship, marital or cohabiting. Then when couples get married, many find that passionate romantic love can quickly fade; because their expectations of romantic love were so high, they become more disenchanted once this happens and unhappy in their marriage. As sociologist Andrew J. Cherlin (2010: 4) observes, “Americans are conflicted about lifelong marriage: they value the stability and security of marriage, but they tend to believe that individuals who are unhappy with their marriages should be allowed to end them.” Still, the ideal of romantic love persists even after divorce, leading to remarriage and/or other intimate relationships.
Cohabitation
Cohabitation refers to when partners live together but are not married. Cohabitation was once stigmatized as US culture strongly idealized the nuclear family, though the culture has warmed up to the practice over the past several decades.
The census reports that about 8% of the household population, that is 26 million, lived in cohabiting-couple households in 2020. About 25 million or 95% lived in opposite-sex cohabiting-couple households, while about 1 million were in same-sex households. Cohabiting families are the most common living arrangement among persons. The average cohabitation lasts less than two years but research now shows that percentage of cohabiting unmarried unions lasting at least 5 years has increased to over 40 percent (Lamidi et al. 2019). Cohabitation ends when the couple either separates or gets married – about half of cohabiting couples marry and half split up. More than half of people in their twenties and thirties have cohabited, and roughly one-fourth of this age group is currently cohabiting (Brown, 2005). Roughly 55% of cohabiting couples have no biological children, about 45% live with a biological child of one of the partners, and 21% live with their own biological child. (These figures add to more than 100% because many couples live with their own child and a child of a partner.)
Cohabiters have a variety of reasons for choosing cohabitation over marriage. Some consider cohabitation a 'trial marriage,' seeking to learn whether they are suitable partners. Some enter into cohabitation due to financial insecurity, as living with a partner is more cost saving than living alone. Others may feel that they are not yet ready to marry but are ready to live together.
Divorce
The US divorce rate has risen since the early 1900s, with several peaks and valleys, and is now among the highest in the industrial world. It rose sharply during the Great Depression and World War II, probably because of the economic distress of the former and the family disruption caused by the latter, and fell sharply after the war as the economy thrived and as marriage and family were proclaimed as patriotic ideals. It dropped a bit more during the 1950s before rising sharply through the 1960s and 1970s (Cherlin 2009). The divorce rate has since declined somewhat since the 1980s and today is only slightly higher than its peak at the end of World War II.
We cannot be certain about why the divorce rate rose so much during the 1960s and 1970s, but we can rule out two oft-cited causes. First, there is little reason to believe that marriages became any less happy during this period. We do not have good data to compare marriages then and now, but the best guess is that marital satisfaction did not decline after the 1950s ended. What did change was that people after the 1950s became more willing to seek divorces in marriages that were already unhappy.
Second, although the women’s movement is sometimes blamed for the divorce rate by making women think marriage is an oppressive institution, trends suggest this blame is misplaced. The women’s movement emerged in the late 1960s and was capturing headlines by the early 1970s. Although the divorce rate obviously rose after that time, it also started rising several years before the women’s movement emerged and captured headlines. If the divorce rate began rising before the women’s movement started, it is illogical to blame the women’s movement. Instead, other structural and cultural forces must have been at work, just as they were at other times in the last century, as just noted, when the divorce rate rose and fell.
Research indicates that in 1900, there were 4.1 divorces for every 1,000 married women; by 2022, that number had nearly quadrupled to 14.6. In general rates of divorce declined after reaching its peak of 22.6 in 1980. The first chart below (on the left) indicates the rates of divorce for women from the 1900s to 2022. The second (on the right) shows that in 1900 less than 1% of women who had ever been married were currently separated or divorced; by 2022 that number had increased to 20% (Loo 2024).

Contrary to popular belief, the divorce rate has not been rising in recent decades; however, it did rise over the 1900s until around 1980 and the proportion of divorced and separated people increased over that period.
Source: Loo 2024, National Center for Family & Marriage Research (NCFMR) at Bowling Green University
Why, then, did divorce increase during the 1960s and 1970s? One reason is the increasing economic independence of women. As women entered the labor force in the 1960s and 1970s, they became more economically independent of their husbands, even if their jobs typically paid less than their husbands’ jobs. When women in unhappy marriages do become more economically independent, they are more able to afford to get divorced than when they have to rely entirely on their husbands’ earnings (Hiedemann, Suhomlinova, & O’Rand 1998). When both spouses work outside the home, moreover, it is more difficult to juggle the many demands of family life, and family life can be more stressful. Such stress can reduce marital happiness and make divorce more likely. Spouses may also have less time for each other when both are working outside the home, making it more difficult to deal with problems they may be having.
It is also true that disapproval of divorce has declined since the 1950s, even if negative views of it still remain (Cherlin 2009). Not too long ago, divorce was strongly stigmatized; now it is considered a normal part of life. Many no longer feel that a bad marriage should continue for the sake of the children. When New York Governor Nelson Rockefeller ran for president in the early 1960s, the fact that he had been divorced hurt his popularity, but when California Governor Ronald Reagan ran for president less than two decades later, the fact that he had been divorced was hardly noted. Many presidential candidates and other politicians today have been divorced. But is the growing acceptability of divorce a cause of the rising divorce rate, or is it the result of the rising divorce rate? Or is it both a cause and a result? This important causal order question is difficult to resolve.

Disapproval of divorce has declined since the 1950s, and divorce is now considered a normal part of life.
© Thinkstock
Another reason divorce rose during the 1960s and 1970s may be that divorces became easier to obtain legally. In the past, most states required couples to prove that one or both had committed actions such as mental cruelty, adultery, or other such behaviors in order to get divorced. Today almost all states have no-fault divorce laws that allow a couple to divorce if they say their marriage has failed from irreconcilable differences. Because divorce has become easier and less expensive to obtain, more divorces occur. But are no-fault divorce laws a cause or result of the post-1950s rise in the divorce rate? The divorce rate increase preceded the establishment of most states’ no-fault laws, but it is probably also true that the laws helped make additional divorces more possible. Thus no-fault divorce laws are likely one of several reasons for the rising divorce rate after the 1950s (Kneip & Bauer 2009).
We have looked at possible reasons for divorce rate trends, but we can also examine the reasons why certain marriages are more or less likely to end in divorce within a given time period. Although, as noted earlier, many new marriages will probably end in divorce, it is also true that some marriages are more likely to end than others. Family scholars identify several correlates of divorce (Clarke-Stewart & Brentano 2006; Wilcox 2010). An important one is age at marriage: Teenagers who marry are much more likely to get divorced than people who marry well into their twenties or beyond, partly because they have financial difficulties and are not yet emotionally mature. A second correlate of divorce is social class: People who are poor and have less formal education at the time of their marriage are much more likely to get divorced than people who begin their marriages in economic comfort and with higher levels of education.
Children
In 2023, over 70% of children lived with two parents, 21% lived with only their mother, over 4% lived with only their father, and the rest lived in other households (Census 2023). For married opposite-sex and same-sex households, children under the age of 18 were present in 37.6% and 17.3% of households, respectively. For cohabiting households, the figures are 33.8% and 9.5%, respectively (Hernandez 2024).
As with other family changes, children's living arrangements have changed over the past 60+ years. When you examine the graph in the figure below you might notice that in 1960 the most common context for children to be raised was in households with two parents in their first marriage. In 2014 on the other hand, approximately 45% of these families were two-parent first marriages, down from 70%. We see the growth of children living in single-parent families and in cohabiting-parent families.

This chart displays changing living arrangements for children, including the rise of children in cohabiting families. What family form does your family fit?
See image credit above
It is worth noting that children, despite all the joy and fulfillment they so often bring to parents, also tend to reduce parents’ emotional well-being. As a recent review summarized the evidence, “Parents in the United States experience depression and emotional distress more often than their childless adult counterparts. Parents of young children report far more depression, emotional distress and other negative emotions than non-parents, and parents of grown children have no better well-being than adults who never had children” (Simon 2008: 41). We might be more likely to think of parents' impact on children when discussing family problems, though children can impact parents' well-being as well.
Children have these effects because raising them can be stressful and expensive. Depending on household income, the average child costs parents between $134,000 and $270,000 from birth until age 18. College education obviously can cost tens of thousands of dollars beyond that. Robin W. Simon (2008) argues that American parents’ stress would be reduced if the government provided better and more affordable day care and after-school options, flexible work schedules, and tax credits for various parenting costs. She also thinks that the expectations Americans have of the joy of parenthood are unrealistically positive and that parental stress would be reduced if expectations became more realistic.
Multigenerational Families
In the US, the number of people living in multigenerational households is increasing. Multigenerational families include those families with two or more adult generations and families with grandchildren under age 25 and grandparents living together.

The number of Americans who live in multigenerational households has increased since the 1970s.
See image credit above
People living in multigenerational households say they save money by living together. Some people say that caring for an elderly adult or young children is a reason to live together (Mitchell 2022). Currently, in the United States, Asian, Hispanic, and Black families are more likely to live in multigenerational households than white families. (Mitchell 2022) However, this family form was also common for white families before the 1950s (Shayesteh 2023). Before the 1950s and the rise of suburban architecture, the extended or multigenerational household was the most common family form.
Extended families are common in collectivist societies. A collectivist society focuses on meeting the needs and goals of all members of a group rather than focusing on individual successes. Interconnected relationships with families and communities are important, and form a key part of an indicollectivistntity (Cherry 2022). In collectivist societies, your family might help you pick your partner, in part based on whether they got along with your relatives (Bejanyan, Marshall, & Ferenczi 2015).
In contrast, the ideal of the nuclear family is common in individualist societies. An individualistic society emphasizes the needs and success of the individual over the needs of the whole community. People attribute success to the hard work of the individual person (Cherry 2023). People more often pick their partners based on romantic love or at least individual choice (Bejanyan et al. 2014). Laws, policies and practices in the US often assume that the nuclear family is the best family form, which marginalizes multigenerational families as well as all other non-nuclear families.
Social Location
Family structures and experiences in the US today vary by social location such as by social class, race/ethnicity, social class, sexuality, and nationality or immigrant status. Here we will provide some examples of that variation.
Social Class. Education – a marker of social class – greatly affects whether we marry and stay married, and marriage is less common among people without a college degree. Additionally, while marriage rates have fallen overall, the drop is largest among low-income people. Though this may be related to education as education and income are connected; however, another reason is fewer job prospects for low-income men, which reduce the economic benefits of marriage (Ahn & Winters 2025). Researchers Chambers, Goldman, & Winkelmann (2025) found that the education gap in marriage when specifically comparing college-educated and non-college-educated women is more than 50% smaller in geographic locations where men have the lowest rates of joblessness and incarceration. The data "show that lagging male college enrollment has primarily harmed the marriage prospects of non-college women" (2025: 1).
This difference in marriage rates perpetuates economic inequalities. As one observer noted, “As marriage increasingly becomes a phenomenon of the better-off and better-educated, the incomes of two-earner married couples diverge more from those of struggling single adults” (Marcus 2011). One of the many consequences of this education gap in marriage is that the children of one-parent households are less likely than those of two-parent households to graduate high school and to attend college.
Race/Ethnicity. Families in the US exhibit a fair amount of racial/ethnic diversity. For instance, Black and Native American families are less likely to be married than other racial groups, especially Asian and white (Census 2024). Black, Latinx, and Native American children and families are more likely to live in poverty than white or Asian families, and as a result are at a greater risk for the problems that children in poverty experience. Children are also more likely to live with only one parent among Latinx and especially Black families than among white and Asian families. Among households with children under age 18, 45% of Black households in 2023 were two-parent families compared to 67% for Latinx households, 76% for white households, and 88% for Asian households (Census 2023).

This chart displays family structure by race/ethnicity. We see that the most common family structure overall is married opposite-sex couple households, though they comprise less than half of Black households, and that Black households are more likely than others to have other relatives in the home.
Source: Census 2023
The status of Black families in particular has been the source of controversy, in part due to the large number of Black children living in single-parent households. Many scholars attribute the high number of 'fatherless' Black families to the forcible separation of families during slavery and to the fact that so many young Black men today are hyper-criminalized (as we discussed in the prior chapter), unemployed, or are facing other problems, often due to structural causes (Patterson 1998). Some observers say this high number of fatherless families in turn contributes to poverty, crime, and other problems among Black Americans (Haskins 2009), but other observers argue that this blame is misplaced. Extended families and strong women-headed households in the Black community have compensated for the absence of fathers (Willie & Reddick 2010). The problems Black Americans face, they add, stem to a large degree from their experience of racism, the impacts of segregated neighborhoods, the lack of job opportunities, and other structural difficulties (Sampson 2009). It's also important to keep in mind that many Black fathers are present and central in their children's lives.
Beyond these facts lie other racial differences in family life (Wright, Mindel, Tran, & Habenstein 2012). Studies of Latinx and Asian families find they have especially strong family bonds and loyalty. Extended families in those groups and among Native Americans are common, and these extended families have proven a valuable shield against the social problems that all three groups face due to structural discrimination and poverty.
Gender and Sexuality. It is difficult to quantify how many people in the US are in LGBTQ+ families and the number who are parenting. Census data give us some idea, although the numbers are likely underreported. The Census counted approximately 10.7 million adults who identify as LGBTQ+ and 1.4 million adults who identify specifically as transgender. Approximately 1.1 million are in same-gender marriages, and 1.2 million are part of an unmarried same-gender relationship.
The number of same-gender family households have been increasing in recent years. In the image below, the Pew Research Center uses Census data to display how in the short period between 2015 (when same-sex marriage was legalized) and 2023, the number of married same-gender households rose from from 425,357 to 774,553 and the number of cohabiting same-gender households rose from 433,539 to 536,894.

Same-gender family households are increasing steadily, in part due to cultural shifts in the acceptance of LGBTQ+ people and families.
Source: Hays & Minkin 2025, Pew Research Center
Same-gender families are less likely to be raising children than opposite-gender families, though many same-gender families do have children. As shown in the chart below, 31% of same-gender couples, both married and partnered, are raising children, somewhat lower from the 43% of opposite-gender couples raising children (US Census 2022). Of LGBTQ+ people, approximately 48% of women and 20% of men under age fifty are raising children (data on nonbinary parents are not available). LGBTQ+ couples are more likely to adopt or foster children or to be stepparents (US Census Bureau 2022). Approximately 3.7 million children in the US have a parent who is LGBTQ+.
Same-Gender Marriages and Relationships
| |
Same-Gender Marriages |
Unmarried Same-Gender Relationships |
Opposite-Gender Couples |
| Number of People |
1.1 million |
1.2 million |
– |
| Percent Raising Children |
31% |
31% |
43% |
The numbers of LGBTQ+ and heterosexual cisgender families who are parenting are becoming more equal. Older LGBTQ+ people are less likely to have children, while younger LGBTQ+ people are more likely to have children, so we expect that the numbers will equalize in the future. What social factors can explain this trend?
“Same Sex Marriages and Relationships” by Heidi Esbensen, Sociology of Gender: An Equity Lens is licensed under CC BY 4.0
Much of the literature on same-gender relationship quality focuses on comparing their relationships to opposite-gender relationships. This work has repeatedly found that LGBTQ+ relationships experience the same satisfaction level compared to non-LGBTQ+ relationships and that LGBTQ+ relationships are just as well adjusted as their heterosexual cisgender counterparts and experience similar stressors. With marriage equality, the recognition of same-gender marriage as a human and civil right, as well as recognition by law and support of societal institutions, LGBTQ+ families now face less legal discrimination. Furthermore, in an analysis of 81 parenting studies, sociologists found no quantifiable data to support the notion that opposite-gender parenting is superior to same-gender parenting. Children of lesbian couples, however, were shown to have slightly lower rates of behavioral problems and higher rates of self-esteem (Biblarz and Stacey 2010).
However, gender and sexuality is not limited to LGBTQ+ people, as heterosexual cisgender partners often take on gender roles dictated by the culture. Opposite-gender couples may struggle with how to equitably divide housework and childcare, as cultural norms dictate that women should take on more of that burden – and they do, even among couples that have egalitarian values. Interestingly, gender roles are also present in some same-gender families in which partners have varying gender expressions, with the more feminine-presenting partner taking on more of the domestic work than the more masculine-presenting partner (Carrington 1999).
Applying Social Research
How Well Do Children of Same-Gender Couples Fare?
Many opponents of same-gender marriage claimed that children are better off if they are raised by both a mother and a father and that children of same-gender couples fare worse as a result. As the National Organization for Marriage (2011) stated, “Two men might each be a good father, but neither can be a mom. The ideal for children is the love of their own mom and dad. No same-sex couple can provide that.”
Addressing this contention, social scientists have studied the children of same-gender parents and compared them to the children of opposite-gender parents. Although it is difficult to have random, representative samples of same-gender couples’ children, a growing number of studies find that these children fare similarly psychologically and in other respects as opposite-gender couples’ children.
Perhaps the most notable published paper in this area appeared in 2001 in the American Sociological Review, the preeminent sociology journal. The authors, Judith Stacey and Timothy J. Biblarz, reviewed almost two dozen studies that had been done of same-gender couples’ children. All these studies yielded the central conclusion that the psychological well-being of these children is no worse than that of opposite-gender couples’ children. As the authors summarized this conclusion and its policy implications, “Because every relevant study to date shows that parental sexual orientation per se has no measurable effect on the quality of parent-child relationships or on children’s mental health or social adjustment, there is no evidentiary basis for considering parental sexual orientation in decisions about children’s ‘best interest.’”
Biblarz and Stacey returned to this issue in a 2010 article in the Journal of Marriage and the Family, the preeminent journal in its field. This time they reviewed almost three dozen studies published since 1990 that compared the children of same-gender couples (most of them lesbian parents) to those of opposite-gender couples. They again found that the psychological well-being and social adjustment of same-gender couples’ children was at least as high as those of opposite-gender couples’ children, and they even found some evidence that children of lesbian couples fare better in some respects than those of opposite-gender couples. Although the authors acknowledged that two parents are generally better for children than one parent, they concluded that the sexual orientation of the parents makes no difference overall. As they summarized the body of research on this issue: “Research consistently has demonstrated that despite prejudice and discrimination children raised by lesbians develop as well as their peers. Across the standard panoply of measures, studies find far more similarities than differences among children with lesbian and heterosexual parents, and the rare differences mainly favor the former.”
This body of research, then, contributes in important ways to national debates on the rights of LGBTQ+ families. If children of same-gender couples indeed fare well, as the evidence indicates, concern about these children’s welfare should play no part in these debates.
Belonging
One social problem that we will discuss related to the institution of family is belonging. All of us want to belong. Social scientists say that everyone needs to feel connected in some way. Throughout this book, we highlight how we are all interconnected. Why are we talking about the social problem of belonging?
First, we talk about belonging because lack of belonging is a cause and consequence of many social problems. Belonging is a feeling of deep connection with social groups, physical places, and individual and collective experiences. It is a fundamental human need that predicts numerous mental, physical, social, economic, and behavioral outcomes (Allen et al. 2021). One of the smallest social groups we might belong to is a family. Families themselves also belong in communities and wider society. Though, some families are treated as if they belong and some aren't. Thus, belonging is tied to social inequality.
We will focus on belonging related to ethnicity and being LGBTQ+ or queer, which we spend time on here because they are complex concepts. For instance, Jewish, Irish, and Latinx have in common not that they are each tied to a specific nation, religion, nor racial group, but that each of these groups shares a cultural background, including cultural traditions and values. People who identify as Jewish may practice the Jewish religion. According to devout Jewish beliefs, children are Jewish if their mothers are Jewish. Almost 30% of Jewish people in the US identify as Jewish but don’t practice Judaism as a religion (Pew Research Center 2021). They may still enjoy latkes as holiday food but not celebrate Shabbat regularly.

Being Jewish is both a religion and ethnicity. Some people who identify as Jewish don’t practice the related religion, whereas others do. In the photo to the left, Jewish advocates Bel Kaufman, Rachel Cohen Gerrol, and Rachel Sklar are being honored for their social justice work. In the photo to the right, Jewish individuals are praying at the Western Wall in Jerusalem.
“Event honorees – Rachel Sklar, Bel Kaufman, Rachel Cohen Gerrol” by Jewish Women’s Archive is licensed under CC BY-SA 2.0; “Western Wall, Jerusalem” by yeowatzup is licensed under CC BY 2.0
Irish is yet another ethnic group. The five million people who lived in Ireland in 2023 have an Irish ethnicity by way of culture and nationality. However, more Irish people live outside of Ireland than in the country (Haynie 2016). Their ethnicity is Irish, but not their nationality. Some people speak Irish. Others say they are Irish because their grandparents or great-grandparents emigrated from there. Still others learn Irish step dancing or storytelling or the harp and pennywhistle.
The complexity of ethnicity can also be demonstrated through language. Although the terms 'Hispanic' and 'Latino' are often used interchangeably, they are not the same, as shown in the figure below. Hispanic usually refers to native speakers of Spanish. Latino refers to people who come from, or whose ancestors came from, Latin America. Not all Hispanics are Latinos. Latinos may be of any race or ethnicity; they may be of European, African, Native American descent, or mixed ethnic background. Thus, people from Spain are Hispanic but are not Latino.

Latino refers to people whose ancestors came from Latin America and speak Spanish, Portuguese, or French. Hispanic refers to native Spanish speakers, including people from Spain but not countries like Brazil. How does this distinction highlight the complexity of ethnicity?
See photo credit above
One of the reasons some people prefer 'Latino' is that it focuses on Latin America. It excludes Spain, the country that colonized much of Latin America. Many Mesoamerican people identify with the country of origin of themselves or their families. Origin refers to the geographical location where a person was born and grew up. This includes regions of the United States, as well as other countries. In immigrant families, children may call themselves Mexican American or Puerto Rican if their families originated from those countries.
A term that has recently emerged is 'Latinx.' Latinx is used as a gender-neutral alternative to Latino or Latina. Latinx does not position men as the default category for an entire group in the way that Latino does, which marginalizes Latina women. Moreover, Latinx does not imply or impose a gender identity on people. Latinx is an invitation to LGBTQ+ people; an acknowledgment that gender non-conforming people exist. Although this term has been the subject of debate, it is commonly used as a self-referential to describe a person's own identity. To hear varying perspectives on this language, watch the short video Hispanic, Latino, Latinx: What's in a name? and a TikTok in which actor John Leguizamo discusses the term.
Fundamentally, ethnicity is tied to oppression and privilege. Let’s look at some examples: First, some ethnic groups experience violence related to their ethnicity. More than 60% of all European Jewish people were murdered during the Holocaust in World War II (The United States Holocaust Memorial Museum N.d.), a state-sanctioned form of genocide. We will discuss this concept further in the chapter on Conflict, War, and Terrorism, as well as other anti-Jewish sentiment and discrimination that continues to impact Jewish families today.
Other forms of discrimination have been prevalent in history but are less common today. For example, the advertisement in the figure below illustrates anti-Irish sentiment as it notes that "no Irish need apply." Although academics debate how many of these signs were actually posted, there was widespread anti-Irish prejudice and discrimination in the mid-19th century immigration to the United States. Irish immigrants fought to redefine these laws, policies, and practices. Now, most people of Irish ethnicity define themselves as white.

This advertisement from an 1868 Boston newspaper is advertising for a reliable woman to care for a child. It asserts, “Positively no Irish need apply.” This statement reflects discrimination, which was institutionalized within the social institution of work.
“No Irish need apply” by Unknown Author, Wikipedia is in the Public Domain
Thus, ethnicity is part of how people in power define who belongs in our society and who doesn’t. In the following page will examine the intersection of ethnicity and another area of social location, immigration. In particular we will look at Latinx immigrant family experiences. First, however, we will provide a historical background on citizenship and begin to illustrate how belonging is institutionalized.
The social institution of the state – i.e., the government – regulates who gets to belong in a country, state, or community. They decide who gets to be a citizen and who gets to be a family. Race determined citizenship historically, and continues to influence belonging today. For instance, enslaved people were not citizens of the new country of the United States. However, free white persons who had lived in the US for two years and were “of good character” could become citizens (Blakemore 2020). In addition, white children who were born in the US could become citizens.
This concept of birthright citizenship means that a child born in a country becomes a citizen, regardless of the citizenship of their parents. This concept was powerful for a new country, because it began to allow the formation of an American identity. Citizenship allowed people to vote and to run for public office. Citizens must pay taxes to support the government, but they also receive public benefits. Today, some of the public benefits are Social Security and Medicare. Even though birthright citizenship is a powerful concept, it didn’t apply to everyone when it was initially established.
In 1790, Black people were over 20% of the US population and over 40% of the population in Southern states (Bouton 2010). In order to maintain white supremacy, white people did not grant birthright citizenship to enslaved people. Only the Fourteenth Amendment, which was ratified after the Civil War, offered birthright citizenship to all Black people born in the US.
Today, slavery is illegal, and Black people have full citizenship, but the historical oppression that is tangled in capitalism, patriarchy, racism, and citizenship continues to harm people today. For example, Black families continue to experience more housing instability than white families, which we explored in a prior chapter. Thus, historical state regulation of who belongs continues to influence families' experiences today.
Families challenged by immigrant and ethnic prejudice are not the only kinds of families that experience inequality in the US. We will discuss inequality by way of other areas of social location, with the example of LGBTQ+ families. Approximately 3.3 million people live in same-gender marriages and partnerships, and this number is growing. However, these families experience social, economic, and legal challenges. Before we look at the experience of these families, let’s examine a unique word: Queer.
For some people, 'queer' is a bad word. For others, it is a source of power. Please take a moment to watch the video below from activist Tyler Ford about the history of the word queer. How do you understand this word?
Two authors of this textbook (Kim Puttman and Emily Pain) openly identify as queer. Queer as in different, but also as in challenging dominant ideas about what identity, sexuality, love, relationship, and family look like. For instance, Puttman's lesbian marriage expands what it means to be a “normal” and “healthy” family. Both authors embrace their queer identity as a source of power, even though it is also a source of marginalization. We stand with generations of activists before us, chanting, “We’re here, we’re queer, get used to it!”
Quote
In its simplest form, queer means upending mainstream norms about sexuality and gender (particularly the ones that say that being straight is the human default and that gender and sexuality are hardwired, binary, and fixed rather than socially constructed, infinite, and fluid). It also usually speaks to solidarity across lines of race, class, dis/ability, gender, sexuality, and other identities as part of a radical politics of transforming the status quo and working toward collective liberation.
–Alex Kapitan (2021) on the Radical Copy Editor blog
Moving forward in this chapter, we will use the term queer families as a form of empowerment and connection to social justice advocacy.
In the following page we will describe a variety of social problems related to the institution of family, such as outcomes for children and adults in different family forms, the impact of gendered roles and expectations, multiple forms of family violence, and (lack of) belonging with the examples of immigrant and queer families.

