
7.4: What Does the Public Think?
- Page ID
- 147650
While attitudes and beliefs are slow to change, ideology can be influenced by events. A student might leave college with a liberal ideology but become more conservative as she ages. A first-year teacher may view unions with suspicion based on second-hand information but change his mind after reading newsletters and attending union meetings. These shifts may change the way citizens vote and the answers they give in polls. For this reason, political scientists often study when and why such changes in ideology happen, and how they influence our opinions about government and politicians.
Experiences that Affect Public Opinion
Ideological shifts are more likely to occur if a voter’s ideology is only weakly supported by his or her beliefs. Citizens can also hold beliefs or opinions that are contrary or conflicting, especially if their knowledge of an issue or candidate is limited. And having limited information makes it easier for them to abandon an opinion. Finally, citizens’ opinions will change as they grow older and separate from family.[1]
Citizens use two methods to form an opinion about an issue or candidate.
- The first is to rely on heuristics, shortcuts or rules of thumb (cues) for decision making. Political party membership is one of the most common heuristics in voting. Many voters join a political party whose platform aligns most closely with their political beliefs, and voting for a candidate from that party simply makes sense. Studies have shown that up to half of voters make decisions using their political party identification, or party ID, especially in races where information about candidates is scarce.[2]
- The second method is to do research, learning background information before making a decision. Candidates, parties, and campaigns put out a large array of information to sway potential voters, and the media provide wide coverage, all of which is readily available online and elsewhere. But many voters are unwilling to spend the necessary time to research and instead vote with incomplete information.[3]
Gender, race, socio-economic status, and interest-group affiliation also serve as heuristics for decision making. Voters may assume female candidates have a stronger understanding about social issues relevant to women. Business owners may prefer to vote for a candidate with a college degree who has worked in business rather than a career politician.
Opinions based on heuristics rather than research are more likely to change when the cue changes. If a voter begins listening to a new source of information or moves to a new town, the influences and cues he or she meets will change. Even if the voter is diligently looking for information to make an informed decision, demographic cues matter. Age, gender, race, and socio-economic status will shape our opinions because they are a part of our everyday reality, and they become part of our barometer on whether a leader or government is performing well.
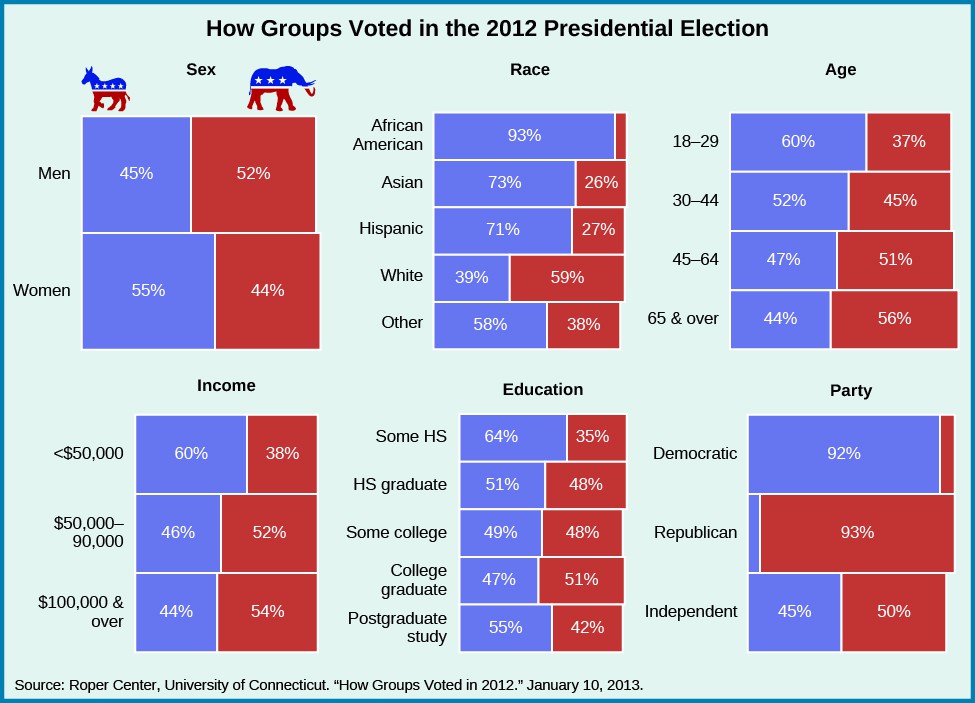
Similar demographic effects were seen in the 2016 presidential election. For instance, 54 percent of women voted for the Democratic candidate, Hillary Clinton, and 52 percent of men voted for the Republican candidate, Donald Trump. If considering age and race, Trump garnered percentages similar to Mitt Romney in these categories as well. And, as in 2012, households with incomes below $50,000 heavily favored the Democratic candidate, while those households in the $50,000–90,000 bracket slightly favored the Republican.[5]
The political culture of a state can also have an effect on ideology and opinion. In the 1960s, researcher Daniel Elazar determined that states had unique cultures and that different state governments instilled different attitudes and beliefs in their citizens, creating political cultures. Some states value tradition and their laws try to maintain longstanding beliefs. Other states believe government should help people and therefore create large bureaucracies that provide benefits to assist citizens. Some political cultures stress citizen involvement whereas others try to exclude participation by the masses.
State political cultures can affect the ideology and opinions of those who live in or move to them. For example, opinions about gun ownership and rights vary from state to state. Polls show that 61 percent of all Californians, regardless of ideology or political party, stated there should be more controls on who owns guns.[6] In contrast, in Texas, support for the right to carry a weapon is high. Fifty percent of self-identified Democrats—who typically prefer more controls on guns rather than fewer—said Texans should be allowed to carry a concealed weapon if they have a permit.[7] In this case, state culture may have affected citizens’ feelings about the Second Amendment and moved them away from the expected ideological beliefs.
Workplace groups such as professional organizations or unions can also influence opinions. These organizations provide members with specific information about issues important to them and lobby on their behalf in an effort to better work environments, increase pay, or enhance shared governance. They may also pressure members to vote for particular candidates or initiatives they believe will help promote the organization’s goals. For example, teachers’ unions often support the Democratic Party because it has historically supported increased funding to public schools and universities.
Important political opinion leaders, or political elites, shape public opinion, usually by serving as short-term cues that help voters pay closer attention to a political debate and make decisions about it. Through a talk program or opinion column, the elite commentator tells people when and how to react to a current problem or issue. Millennials and members of Generation X (currently ages 38–53) long used Jon Stewart of The Daily Show and later Stephen Colbert of The Colbert Report as shortcuts to becoming informed about current events. In the same way, older generations trusted Tom Brokaw and 60 Minutes.
Public Opinion and Political Institutions
Public opinion about American institutions is measured in public approval ratings rather than in questions of choice between positions or candidates. The congressional and executive branches of government are the subject of much scrutiny and discussed daily in the media. Polling companies take daily approval polls of these two branches. The Supreme Court makes the news less frequently, and approval polls are more likely after the court has released major opinions. All three branches, however, are susceptible to swings in public approval in response to their actions and to national events. Approval ratings are generally not stable for any of the three.
The president is the most visible member of the U.S. government and a lightning rod for disagreement. Presidents are often blamed for the decisions of their administrations and political parties, and are held accountable for economic and foreign policy downturns. For these reasons, they can expect their approval ratings to slowly decline over time, increasing or decreasing slightly with specific events. Former President Trump experienced significantly lower approval ratings than average, taking the oath of office with an approval rating of 45 percent, which declined to a low of 34 percent in 2021.[24]
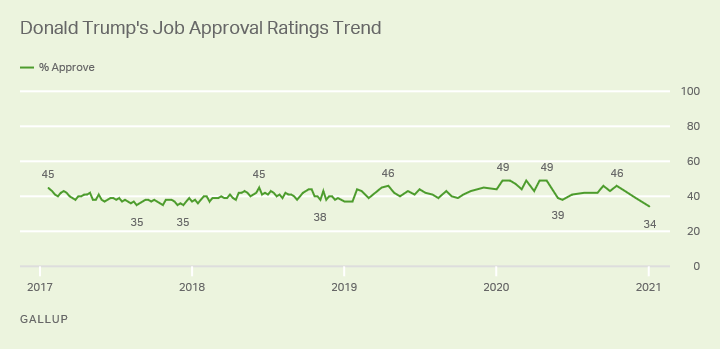
Figure 2. The approval ratings reported here are based on Gallup Daily tracking averages for President Donald Trump in 2017 and 2018, and periodic multiday polls for Trump starting in 2019
Some presidents have had higher or lower public approval than others, though ratings are difficult to compare, because national and world events that affect presidential ratings are outside a president’s control. Several chief executives presided over failing economies or wars, whereas others had the benefit of strong economies and peace.
Gallup polling has tracked approval ratings for all presidents since Harry Truman. The Presidential Job Approval Center allows you to compare weekly approval ratings for all tracked presidents, as well as their average approval ratings.
Public Mood and Watershed Moments
Polling is one area of U.S. politics in which political practitioners and political science scholars interact. Each election cycle, political scientists help media outlets interpret polling, statistical data, and election forecasts. One particular watershed moment in this regard occurred when Professor James Stimson, of the University of North Carolina at Chapel Hill, developed his aggregated measure of public mood. This measure takes a variety of issue positions and combines them to form a general ideology about the government. According to Professor Stimson, the American electorate became more conservative in the 1970s and again in the 1990s, as demonstrated by Republican gains in Congress. With this public mood measure in mind, political scientists can explain why and when Americans allowed major policy shifts. For example, the Great Society’s expansion of welfare and social benefits occurred during the height of liberalism in the mid-1960s, while the welfare cuts and reforms of the 1990s occurred during the nation’s move toward conservatism. Tracking conservative and liberal shifts in the public’s ideology allows policy analysts to predict whether voters are likely to accept or reject major policies.
What other means of measuring the public mood do you think might be effective and reliable? How would you implement them? Do you agree that watershed moments in history signal public mood changes? If so, give some examples. If not, why not?
Congress as an institution has historically received lower approval ratings than presidents, a striking result because individual senators and representatives are generally viewed favorably by their constituents. While congressional representatives almost always win reelection and are liked by their constituents back home, the institution itself is often vilified as representing everything that is wrong with politics and partisanship.
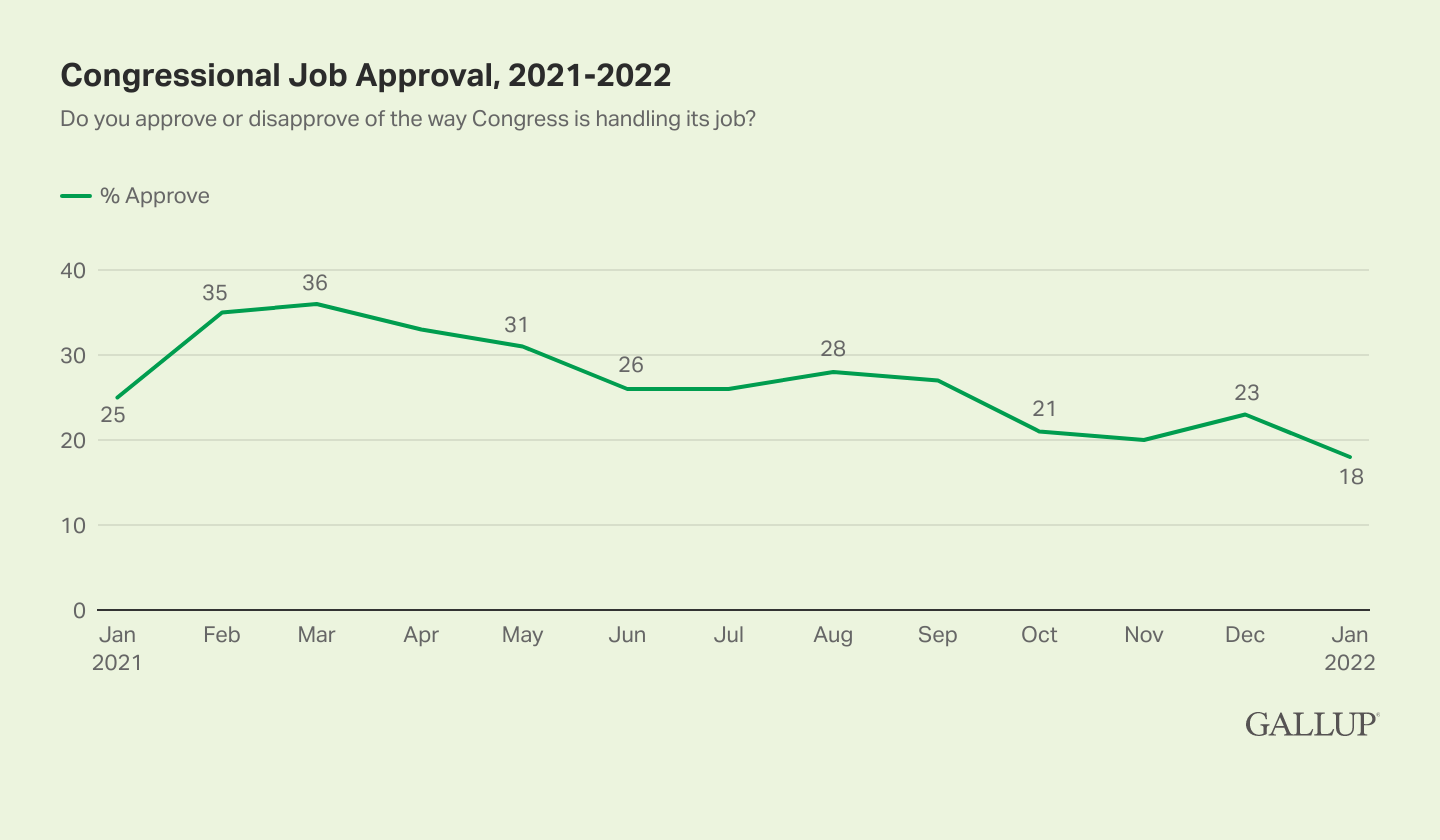
While presidents are affected by foreign and domestic events, congressional approval is mainly affected by domestic events. When the economy rebounds or gas prices drop, public approval of Congress tends to go up. But when party politics within Congress becomes a domestic event, public approval falls. The passage of revenue bills has become an example of such an event, because deficits require Congress to make policy decisions before changing the budget.
The Supreme Court generally enjoys less visibility than the other two branches of government, which leads to more stable but also less frequent polling results. The court is protected by the justices’ non-elected, non-political positions, which gives them the appearance of integrity and helps the Supreme Court earn higher public approval ratings than presidents and Congress.
Summary
When citizens change their sources of information, their opinions may change. The influence of elites and workplaces, life experiences, and state political culture can all help change our opinions. Economic and social policies are likely to cause controversy if the government has to serve the needs of many different groups or balance rights and liberties, all with limited resources.
- Michael S. Lewis-Beck, William G. Jacoby, Helmut Norpoth, and Herbert F. Weisberg. 2008. American Vote Revisited. Ann Arbor: University of Michigan Press. ↵
- Samuel Popkin. 2008. The Reasoning Voter: Communication and Persuasion in Presidential Campaigns. Chicago: University Of Chicago Press. Michael S. Lewis-Beck, William G. Jacoby, Helmut Norpoth, and Herbert F. Weisberg. 2008. American Vote Revisited. Ann Arbor: University of Michigan Press. ↵
- Scott Ashworth, and Ethan Bueno De Mesquita. 2014. "Is Voter Competence Good for Voters? Information, Rationality, and Democratic Performance." American Political Science Review 108 (3): 565–587. ↵
- Gallup. 2015. "U.S. Presidential Election Center." Gallup. June 6, 2015. http://www.gallup.com/poll/154559/US-Presidential-Election-Center.aspx (February 18, 2016). ↵
- "How Groups Voted 2016." 10 January 2019. Roper Center for Public Opinion Research at Cornell University. https://ropercenter.cornell.edu/polls/us-elections/how-groups-voted/groups-voted-2016/. ↵
- Josh Richman, "Field Poll: California Voters Favor Gun Controls Over Protecting Second Amendment Rights," San Jose Mercury News, 26 February 2013. ↵
- UT Austin. 2015. "Agreement with Concealed Carry Laws." UT Austin Texas Politics Project. February 2015. http://texaspolitics.utexas.edu/set/agreement-concealed-carry-laws-february-2015#party-id (February 18, 2016). ↵
- Gallup interactive Presidential Job Approval Center. https://news.gallup.com/interactives/185273/r.aspx?g_source=WWWV7HP&g_medium=topic&g_campaign=tiles. ↵
- Bush v. Gore, 531 U.S. 98 (2000). ↵
- National Federation of Independent Business v. Sebelius, 567 U.S. ___ (2012); Andrew Dugan. 2014. "Americans’ Approval of Supreme Court New All-Time Low." Gallup. July 19, 2014. http://www.gallup.com/poll/163586/americans-approval-supreme-court-near-time-low.aspx (February 18, 2016). ↵
- King v. Burwell, 576 U.S. ___ (2015); Gallup Polling. 2015. "Supreme Court." Gallup Polling. http://www.gallup.com/poll/4732/supreme-court.aspx (February 18, 2016). ↵
- American Government 2e. Authored by: OpenStax. Located at: https://cnx.org/contents/nY32AU8S@5.1:xJJkKaSK@5/Preface. License: CC BY: Attribution. License Terms: Download for free at http://cnx.org/contents/9d8df601-4f1...50bf739e5f@5.1