
7.3: How Is Public Opinion Measured?
- Page ID
- 147649
History of Polling
Polling has changed over the years. The first opinion poll was taken in 1824; it asked voters how they voted as they left their polling places. Informal polls are called straw polls, and they informally collect opinions of a non-random population or group. Newspapers and social media continue the tradition of unofficial polls, mainly because interested readers want to know how elections will end. These informal, pop-up quizzes ask a single question about politics or an event, and are intended to provide a general idea of what the readership thinks.
Modern public opinion polling is relatively new, only eighty years old. These polls are far more sophisticated than straw polls and are carefully designed to probe what we think, want, and value. The information they gather may be relayed to politicians or newspapers, and is analyzed by statisticians and social scientists. As the media and politicians pay more attention to the polls, an increasing number are put in the field every week.
Taking a Poll
Most public opinion polls aim to be accurate, but this is not an easy task. Political polling is a science. From design to implementation, polls are complex and require careful planning and care.
A number of criteria must be met if a poll is to be completed scientifically. First, the methodologists identify the desired population, or group, of respondents they want to interview. For example, if the goal is to project who will win the presidency, citizens from across the United States should be interviewed. If we wish to understand how voters in Colorado will vote on a proposition, the population of respondents should only be Colorado residents. When surveying on elections or policy matters, many polling houses will interview only respondents who have a history of voting in previous elections, because these voters are more likely to go to the polls on Election Day. Politicians are more likely to be influenced by the opinions of proven voters than of everyday citizens. Once the desired population has been identified, the researchers will begin to build a sample that is both random and representative.
A random sample consists of a limited number of people from the overall population, selected in such a way that each has an equal chance of being chosen. In the early years of polling, telephone numbers of potential respondents were arbitrarily selected from various areas to avoid regional bias. While landline phones allow polls to try to ensure randomness, the increasing use of cell phones makes this process difficult. Cell phones, and their numbers, are portable and move with the owner. To prevent errors, polls that include known cellular numbers may screen for zip codes and other geographic indicators to prevent regional bias.
A representative sample consists of a group whose demographic distribution is similar to that of the overall population. For example, nearly 51 percent of the U.S. population is female.[2] To match this demographic distribution of women, any poll intended to measure what most Americans think about an issue should survey a sample containing slightly more women than men.
Pollsters try to interview a set number of citizens to create a reasonable sample of the population. This sample size will vary based on the size of the population being interviewed and the level of accuracy the pollster wishes to reach. If the poll is trying to reveal the opinion of a state or group, such as the opinion of Wisconsin voters about changes to the education system, the sample size may vary from five hundred to one thousand respondents and produce results with relatively low error. For a poll to predict what Americans think nationally, such as about the White House’s policy on greenhouse gases, the sample size should be larger.
Generally, a larger sample makes a poll more accurate, because it will have relatively fewer unusual responses and be more representative of the actual population. Pollsters do not interview more respondents than necessary. Increasing the number of respondents will increase the accuracy of the poll, but once the poll has enough respondents to be representative, increases in accuracy become minor and are not cost-effective.[5]
When the sample represents the actual population, the poll’s accuracy will be reflected in a lower margin of error. The margin of error is a number that states how far the poll results may be from the actual opinion of the total population of citizens. The lower the margin of error, the more predictive the poll. Large margins of error are problematic. For example, if a poll that claims Hillary Clinton is likely to win 30 percent of the vote in the 2016 New York Democratic primary has a margin of error of +/-6, it tells us that Clinton may receive as little as 24 percent of the vote (30 – 6) or as much as 36 percent (30 + 6). A lower of margin of error is clearly desirable because it gives us the most precise picture of what people actually think or will do.
With many polls out there, how do you know whether a poll is a good poll and accurately predicts what a group believes? First, look for the numbers. Polling companies include the margin of error, polling dates, number of respondents, and population sampled to show their scientific reliability. Was the poll recently taken? Is the question clear and unbiased? Was the number of respondents high enough to predict the population? Is the margin of error small? It is worth looking for this valuable information when you interpret poll results. While most polling agencies strive to create quality polls, other organizations want fast results and may prioritize immediate numbers over random and representative samples. For example, instant polling is often used by news networks to quickly assess how well candidates are performing in a debate.
Technology and Polling
The days of randomly walking neighborhoods and phone book cold-calling to interview random citizens are gone. Scientific polling has made interviewing more deliberate. Historically, many polls were conducted in person, yet this was expensive and yielded problematic results.
In some situations and countries, face-to-face interviewing still exists. Exit polls, focus groups, and some public opinion polls occur in which the interviewer and respondents communicate in person. Exit polls are conducted in person, with an interviewer standing near a polling location and requesting information as voters leave the polls. Focus groups often select random respondents from local shopping places or pre-select respondents from Internet or phone surveys. The respondents show up to observe or discuss topics and are then surveyed.
Most polling now occurs over the phone or through the Internet. Some companies, like Harris Interactive, maintain directories that include registered voters, consumers, or previously interviewed respondents. If pollsters need to interview a particular population, such as political party members or retirees of a specific pension fund, the company may purchase or access a list of phone numbers for that group.
Other organizations, like Gallup, use random-digit-dialing (RDD), in which a computer randomly generates phone numbers with desired area codes. Using RDD allows the pollsters to include respondents who may have unlisted and cellular numbers.[8] Questions about ZIP code or demographics may be asked early in the poll to allow the pollsters to determine which interviews to continue and which to end early.
The interviewing process is also partly computerized. Many polls are now administered through computer-assisted telephone interviewing (CATI) or through robo-polls. A CATI system calls random telephone numbers until it reaches a live person and then connects the potential respondent with a trained interviewer. As the respondent provides answers, the interviewer enters them directly into the computer program. These polls may have some errors if the interviewer enters an incorrect answer. The polls may also have reliability issues if the interviewer goes off the script or answers respondents’ questions.
Robo-polls are entirely computerized. A computer dials random or pre-programmed numbers and a prerecorded electronic voice administers the survey. The respondent listens to the question and possible answers and then presses numbers on the phone to enter responses. Proponents argue that respondents are more honest without an interviewer. However, these polls can suffer from error if the respondent does not use the correct keypad number to answer a question or misunderstands the question. Robo-polls may also have lower response rates, because there is no live person to persuade the respondent to answer. There is also no way to prevent children from answering the survey. Lastly, the Telephone Consumer Protection Act (1991) made automated calls to cell phones illegal, which leaves a large population of potential respondents inaccessible to robo-polls.[9]
The latest challenges in telephone polling come from the shift in phone usage. A growing number of citizens, especially younger citizens, use only cell phones, and their phone numbers are no longer based on geographic areas. The Millennial generation (currently aged 21–37) is also more likely to text than to answer an unknown call, so it is harder to interview this demographic group. Polling companies now must reach out to potential respondents using email and social media to ensure they have a representative group of respondents.
Yet, the technology required to move to the Internet and handheld devices presents further problems. Web surveys must be designed to run on a varied number of browsers and handheld devices. Online polls cannot detect whether a person with multiple email accounts or social media profiles answers the same poll multiple times, nor can they tell when a respondent misrepresents demographics in the poll or on a social media profile used in a poll. These factors also make it more difficult to calculate response rates or achieve a representative sample. Yet, many companies are working with these difficulties, because it is necessary to reach younger demographics in order to provide accurate data.[10]
Problems in Polling
For a number of reasons, polls may not produce accurate results. Two important factors a polling company faces are timing and human nature. Unless you conduct an exit poll during an election and interviewers stand at the polling places on Election Day to ask voters how they voted, there is always the possibility the poll results will be wrong. The simplest reason is that if there is time between the poll and Election Day, a citizen might change his or her mind, lie, or choose not to vote at all. Timing is very important during elections, because surprise events can shift enough opinions to change an election result. Of course, there are many other reasons why polls, even those not time-bound by elections or events, may be inaccurate.
Polls begin with a list of carefully written questions. The questions need to be free of framing, meaning they should not be worded to lead respondents to a particular answer. For example, take two questions about presidential approval. Question 1 might ask, “Given the high unemployment rate, do you approve of the job President Trump is doing?” Question 2 might ask, “Do you approve of the job President Trump is doing?” Both questions want to know how respondents perceive the president’s success, but the first question sets up a frame for the respondent to believe the economy is doing poorly before answering. This is likely to make the respondent’s answer more negative. Similarly, the way we refer to an issue or concept can affect the way listeners perceive it. The phrase “estate tax” did not rally voters to protest the inheritance tax, but the phrase “death tax” sparked debate about whether taxing estates imposed a double tax on income.[11]
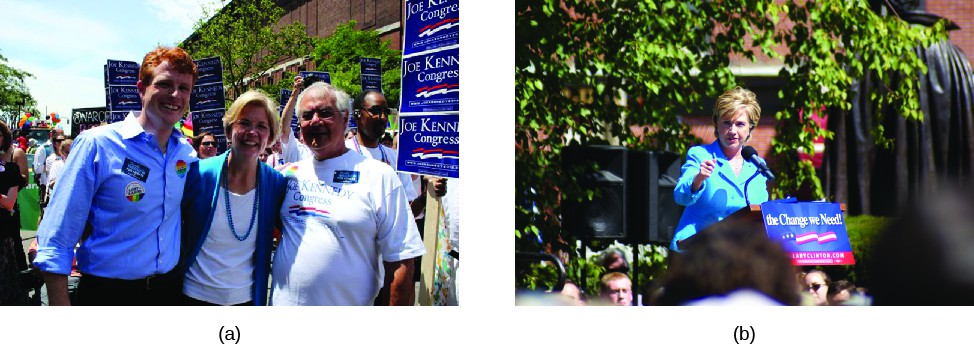
Many polling companies try to avoid leading questions, which lead respondents to select a predetermined answer, because they want to know what people really think. Some polls, however, have a different goal. Their questions are written to guarantee a specific outcome, perhaps to help a candidate get press coverage or gain momentum. These are called push polls. In the 2016 presidential primary race, MoveOn tried to encourage Senator Elizabeth Warren (D-MA) to enter the race for the Democratic nomination. Its poll used leading questions for what it termed an “informed ballot,” and, to show that Warren would do better than Hillary Clinton, it included ten positive statements about Warren before asking whether the respondent would vote for Clinton or Warren.[12] The poll results were blasted by some in the media for being fake.
Sometimes lack of knowledge affects the results of a poll. Respondents may not know that much about the polling topic but are unwilling to say, “I don’t know.” For this reason, surveys may contain a quiz with questions that determine whether the respondent knows enough about the situation to answer survey questions accurately. A poll to discover whether citizens support changes to the Affordable Care Act or Medicaid might first ask who these programs serve and how they are funded. Polls about territory seizure by the Islamic State (or ISIS) or Russia’s aid to rebels in Ukraine may include a set of questions to determine whether the respondent reads or hears any international news. Respondents who cannot answer correctly may be excluded from the poll, or their answers may be separated from the others.
People may also feel social pressure to answer questions in accordance with the norms of their area or peers.[13] If they are embarrassed to admit how they would vote, they may lie to the interviewer. In the 1982 governor’s race in California, Tom Bradley was far ahead in the polls, yet on Election Day he lost. This result was nicknamed the Bradley effect, voters who answered the poll were afraid to admit they would not vote for a black man because it would appear politically incorrect and racist. In the 2016 presidential election, the level of support for Republican nominee Donald Trump may have been artificially low in the polls due to the fact that some respondents did not want to admit they were voting for Trump.
In 2010, Proposition 19, which would have legalized and taxed marijuana in California, met with a new version of the Bradley effect. Nate Silver, a political blogger, noticed that polls on the marijuana proposition were inconsistent, sometimes showing the proposition would pass and other times showing it would fail. Silver compared the polls and the way they were administered. Some polling companies used an interviewer and others used robo-calling. He proposed that voters speaking with a live interviewer gave the socially acceptable answer that they would vote against Proposition 19, while voters interviewed by a computer felt free to be honest.[14] While this theory has not been proven, it is consistent with other findings that interviewer demographics can affect respondents’ answers. African Americans, for example, may give different responses to interviewers who are white than to interviewers who are black.[15]
Push Polls
One of the newer byproducts of polling is the creation of push polls, which consist of political campaign information presented as polls. A respondent is called and asked a series of questions about his or her position or candidate selections. If the respondent’s answers are for the wrong candidate, the next questions will give negative information about the candidate in an effort to change the voter’s mind.
In 2014, a fracking ban was placed on the ballot in a town in Texas. Fracking, which includes injecting pressurized water into drilled wells, helps energy companies collect additional gas from the earth. It is controversial, with opponents arguing it causes water pollution, sound pollution, and earthquakes. During the campaign, a number of local voters received a call that polled them on how they planned to vote on the proposed fracking ban.[16] If the respondent was unsure about or planned to vote for the ban, the questions shifted to provide negative information about the organizations proposing the ban. One question asked, “If you knew the following, would it change your vote . . . two Texas railroad commissioners, the state agency that oversees oil and gas in Texas, have raised concerns about Russia’s involvement in the anti-fracking efforts in the U.S.?” The question played upon voter fears about Russia and international instability in order to convince them to vote against the fracking ban.
These techniques are not limited to issue votes; candidates have used them to attack their opponents. The hope is that voters will think the poll is legitimate and believe the negative information provided by a “neutral” source.
- Arthur Evans, "Predict Landon Electoral Vote to be 315 to 350," Chicago Tribune, 18 October 1936. ↵
- United States Census Bureau. 2012. "Age and Sex Composition in the United States: 2012." United States Census Bureau. http://www.census.gov/population/age/data/2012comp.html (February 17, 2016). ↵
- Rasmussen Reports. 2015. "Daily Presidential Tracking Poll." Rasmussen Reports. September 27, 2015. http://www.rasmussenreports.com/public_content/politics/obama_administration/daily_presidential_tracking_poll (February 17, 2016); Pew Research Center. 2015. "Sampling." Pew Research Center. http://www.pewresearch.org/methodology/u-s-survey-research/sampling/ (February 17, 2016). ↵
- American National Election Studies Data Center. 2016. http://electionstudies.org/studypages/download/datacenter_all_NoData.php (February 17, 2016). ↵
- Michael W. Link and Robert W. Oldendick. 1997. "Good" Polls / "Bad" Polls—How Can You Tell? Ten Tips for Consumers of Survey Research." South Carolina Policy Forum. http://www.ipspr.sc.edu/publication/Link.htm (February 17, 2016); Pew Research Center. 2015. "Sampling." Pew Research Center. http://www.pewresearch.org/methodology/u-s-survey-research/sampling/ (February 17, 2016). ↵
- "Roper Center. 2015. "Polling Fundamentals – Sampling." Roper. http://www.ropercenter.uconn.edu/support/polling-fundamentals-sampling/ (February 17, 2016). ↵
- Gallup. 2015. "How Does the Gallup World Poll Work?" Gallup. http://www.gallup.com/178667/gallup-world-poll-work.aspx (February 17, 2016). ↵
- Gallup. 2015. "Does Gallup Call Cellphones?" Gallup. http://www.gallup.com/poll/110383/does-gallup-call-cell-phones.aspx (February 17, 2016). ↵
- Mark Blumenthal, "The Case for Robo-Pollsters: Automated Interviewers Have Their Drawbacks, But Fewer Than Their Critics Suggest," National Journal, 14 September 2009. ↵
- Mark Blumenthal, "Is Polling As We Know It Doomed?" National Journal, 10 August 2009. ↵
- Frank Luntz. 2007. Words That Work: It’s Not What You Say, It’s What People Hear. New York: Hyperion. ↵
- Aaron Blake, "This terrible polls shows Elizabeth Warren beating Hillary Clinton," Washington Post, 11 February 2015. ↵
- Nate Silver. 2010. "The Broadus Effect? Social Desirability Bias and California Proposition 19." FiveThirtyEightPolitics. July 27, 2010. http://fivethirtyeight.com/features/broadus-effect-social-desirability-bias/ (February 18, 2016). ↵
- Nate Silver. 2010. "The Broadus Effect? Social Desirability Bias and California Proposition 19." FiveThirtyEightPolitics. July 27, 2010. http://fivethirtyeight.com/features/broadus-effect-social-desirability-bias/ (February 18, 2016). ↵
- D. Davis. 1997. "The Direction of Race of Interviewer Effects among African-Americans: Donning the Black Mask." American Journal of Political Science 41 (1): 309–322. ↵
- Kate Sheppard, "Top Texas Regulator: Could Russia be Behind City’s Proposed Fracking Ban?" Huffington Post, 16 July 2014. http://www.huffingtonpost.com/2014/07/16/fracking-ban-denton-russia_n_5592661.html (February 18, 2016). ↵
- American Government 2e. Authored by: OpenStax. Located at: https://cnx.org/contents/nY32AU8S@5.1:xJJkKaSK@5/Preface. License: CC BY: Attribution. License Terms: Download for free at http://cnx.org/contents/9d8df601-4f1...50bf739e5f@5.1