
11.2: Operational definitions
- Page ID
- 135144

Learning Objectives
Learners will be able to…
- Define and give an example of indicators and attributes for a variable
- Apply the three components of an operational definition to a variable
- Distinguish between levels of measurement for a variable and how those differences relate to measurement
- Describe the purpose of composite measures like scales and indices
Conceptual definitions are like dictionary definitions. They tell you what a concept means by defining it using other concepts. In this section we will move from the abstract realm (theory) to the real world (measurement). Operationalization is the process by which researchers spell out precisely how a concept will be measured in their study. It involves identifying the specific research procedures we will use to gather data about our concepts. If conceptually defining your terms means looking at theory, how do you operationally define your terms? By looking for indicators of when your variable is present or not, more or less intense, and so forth. Operationalization is probably the most challenging part of quantitative research, but once it’s done, the design and implementation of your study will be straightforward.

Indicators
Operationalization works by identifying specific indicators that will be taken to represent the ideas we are interested in studying. If we are interested in studying masculinity, then the indicators for that concept might include some of the social roles prescribed to men in society such as breadwinning or fatherhood. Being a breadwinner or a father might therefore be considered indicators of a person’s masculinity. The extent to which a man fulfills either, or both, of these roles might be understood as clues (or indicators) about the extent to which he is viewed as masculine.
Let’s look at another example of indicators. Each day, Gallup researchers poll 1,000 randomly selected Americans to ask them about their well-being. To measure well-being, Gallup asks these people to respond to questions covering six broad areas: physical health, emotional health, work environment, life evaluation, healthy behaviors, and access to basic necessities. Gallup uses these six factors as indicators of the concept that they are really interested in, which is well-being.
Identifying indicators can be even simpler than the examples described thus far. Political party affiliation is another relatively easy concept for which to identify indicators. If you asked a person what party they voted for in the last national election (or gained access to their voting records), you would get a good indication of their party affiliation. Of course, some voters split tickets between multiple parties when they vote and others swing from party to party each election, so our indicator is not perfect. Indeed, if our study were about political identity as a key concept, operationalizing it solely in terms of who they voted for in the previous election leaves out a lot of information about identity that is relevant to that concept. Nevertheless, it’s a pretty good indicator of political party affiliation.
Choosing indicators is not an arbitrary process. As described earlier, utilizing prior theoretical and empirical work in your area of interest is a great way to identify indicators in a scholarly manner. And you conceptual definitions will point you in the direction of relevant indicators. Empirical work will give you some very specific examples of how the important concepts in an area have been measured in the past and what sorts of indicators have been used. Often, it makes sense to use the same indicators as previous researchers; however, you may find that some previous measures have potential weaknesses that your own study will improve upon.
All of the examples in this chapter have dealt with questions you might ask a research participant on a survey or in a quantitative interview. If you plan to collect data from other sources, such as through direct observation or the analysis of available records, think practically about what the design of your study might look like and how you can collect data on various indicators feasibly. If your study asks about whether the participant regularly changes the oil in their car, you will likely not observe them directly doing so. Instead, you will likely need to rely on a survey question that asks them the frequency with which they change their oil or ask to see their car maintenance records.
Exercises
- What indicators are commonly used to measure the variables in your research question?
- How can you feasibly collect data on these indicators?
- Are you planning to collect your own data using a questionnaire or interview? Or are you planning to analyze available data like client files or raw data shared from another researcher’s project?
Remember, you need raw data. You research project cannot rely solely on the results reported by other researchers or the arguments you read in the literature. A literature review is only the first part of a research project, and your review of the literature should inform the indicators you end up choosing when you measure the variables in your research question.
Unlike conceptual definitions which contain other concepts, operational definition consists of the following components: (1) the variable being measured and its attributes, (2) the measure you will use, (3) how you plan to interpret the data collected from that measure to draw conclusions about the variable you are measuring.
Step 1: Specifying variables and attributes
The first component, the variable, should be the easiest part. At this point in quantitative research, you should have a research question that has at least one independent and at least one dependent variable. Remember that variables must be able to vary. For example, the United States is not a variable. Country of residence is a variable, as is patriotism. Similarly, if your sample only includes men, gender is a constant in your study, not a variable. A constant is a characteristic that does not change in your study.
When social scientists measure concepts, they sometimes use the language of variables and attributes. A variableno post refers to a quality or quantity that varies across people or situations. Attributes are the characteristics that make up a variable. For example, the variable hair color would contain attributes like blonde, brown, black, red, gray, etc. A variable’s attributes determine its level of measurement. There are four possible levels of measurement: nominal, ordinal, interval, and ratio. The first two levels of measurement are categorical, meaning their attributes are categories rather than numbers. The latter two levels of measurement are continuous, meaning their attributes are numbers.

I exist to frustrate researchers’ categorizations.
Levels of measurement
Hair color is an example of a nominal level of measurement. Nominal measures are categorical, and those categories cannot be mathematically ranked. As a brown-haired person (with some gray), I can’t say for sure that brown-haired people are better than blonde-haired people. As with all nominal levels of measurement, there is no ranking order between hair colors; they are simply different. That is what constitutes a nominal level of gender and race are also measured at the nominal level.
What attributes are contained in the variable hair color? While blonde, brown, black, and red are common colors, some people may not fit into these categories if we only list these attributes. My wife, who currently has purple hair, wouldn’t fit anywhere. This means that our attributes were not exhaustive. Exhaustiveness means that all possible attributes are listed. We may have to list a lot of colors before we can meet the criteria of exhaustiveness. Clearly, there is a point at which exhaustiveness has been reasonably met. If a person insists that their hair color is light burnt sienna, it is not your responsibility to list that as an option. Rather, that person would reasonably be described as brown-haired. Perhaps listing a category for other color would suffice to make our list of colors exhaustive.
What about a person who has multiple hair colors at the same time, such as red and black? They would fall into multiple attributes. This violates the rule of mutual exclusivity, in which a person cannot fall into two different attributes. Instead of listing all of the possible combinations of colors, perhaps you might include a multi-color attribute to describe people with more than one hair color.
Making sure researchers provide mutually exclusive and exhaustive is about making sure all people are represented in the data record. For many years, the attributes for gender were only male or female. Now, our understanding of gender has evolved to encompass more attributes that better reflect the diversity in the world. Children of parents from different races were often classified as one race or another, even if they identified with both cultures. The option for bi-racial or multi-racial on a survey not only more accurately reflects the racial diversity in the real world but validates and acknowledges people who identify in that manner. If we did not measure race in this way, we would leave empty the data record for people who identify as biracial or multiracial, impairing our search for truth.
Unlike nominal-level measures, attributes at the ordinal level can be rank ordered. For example, someone’s degree of satisfaction in their romantic relationship can be ordered by rank. That is, you could say you are not at all satisfied, a little satisfied, moderately satisfied, or highly satisfied. Note that even though these have a rank order to them (not at all satisfied is certainly worse than highly satisfied), we cannot calculate a mathematical distance between those attributes. We can simply say that one attribute of an ordinal-level variable is more or less than another attribute.
This can get a little confusing when using rating scales. If you have ever taken a customer satisfaction survey or completed a course evaluation for school, you are familiar with rating scales. “On a scale of 1-5, with 1 being the lowest and 5 being the highest, how likely are you to recommend our company to other people?” That surely sounds familiar. Rating scales use numbers, but only as a shorthand, to indicate what attribute (highly likely, somewhat likely, etc.) the person feels describes them best. You wouldn’t say you are “2” likely to recommend the company, but you would say you are not very likely to recommend the company. Ordinal-level attributes must also be exhaustive and mutually exclusive, as with nominal-level variables.
At the interval level, attributes must also be exhaustive and mutually exclusive and there is equal distance between attributes. Interval measures are also continuous, meaning their attributes are numbers, rather than categories. IQ scores are interval level, as are temperatures in Fahrenheit and Celsius. Their defining characteristic is that we can say how much more or less one attribute differs from another. We cannot, however, say with certainty what the ratio of one attribute is in comparison to another. For example, it would not make sense to say that a person with an IQ score of 140 has twice the IQ of a person with a score of 70. However, the difference between IQ scores of 80 and 100 is the same as the difference between IQ scores of 120 and 140.
While we cannot say that someone with an IQ of 140 is twice as intelligent as someone with an IQ of 70 because IQ is measured at the interval level, we can say that someone with six siblings has twice as many as someone with three because number of siblings is measured at the ratio level. Finally, at the ratio level, attributes are mutually exclusive and exhaustive, attributes can be rank ordered, the distance between attributes is equal, and attributes have a true zero point. Thus, with these variables, we can say what the ratio of one attribute is in comparison to another. Examples of ratio-level variables include age and years of education. We know that a person who is 12 years old is twice as old as someone who is 6 years old. Height measured in meters and weight measured in kilograms are good examples. So are counts of discrete objects or events such as the number of siblings one has or the number of questions a student answers correctly on an exam. The differences between each level of measurement are visualized in Table 11.1.
Table 11.1 Criteria for Different Levels of Measurement
| Nominal | Ordinal | Interval | Ratio | |
| Exhaustive | X | X | X | X |
| Mutually exclusive | X | X | X | X |
| Rank-ordered | X | X | X | |
| Equal distance between attributes | X | X | ||
| True zero point | X |
Levels of measurement=levels of specificity
We have spent time learning how to determine our data’s level of measurement. Now what? How could we use this information to help us as we measure concepts and develop measurement tools? First, the types of statistical tests that we are able to use are dependent on our data’s level of measurement. With nominal-level measurement, for example, the only available measure of central tendency is the mode. With ordinal-level measurement, the median or mode can be used as indicators of central tendency. Interval and ratio-level measurement are typically considered the most desirable because they permit for any indicators of central tendency to be computed (i.e., mean, median, or mode). Also, ratio-level measurement is the only level that allows meaningful statements about ratios of scores. The higher the level of measurement, the more complex statistical tests we are able to conduct. This knowledge may help us decide what kind of data we need to gather, and how.
That said, we have to balance this knowledge with the understanding that sometimes, collecting data at a higher level of measurement could negatively impact our studies. For instance, sometimes providing answers in ranges may make prospective participants feel more comfortable responding to sensitive items. Imagine that you were interested in collecting information on topics such as income, number of sexual partners, number of times someone used illicit drugs, etc. You would have to think about the sensitivity of these items and determine if it would make more sense to collect some data at a lower level of measurement (e.g., asking if they are sexually active or not (nominal) versus their total number of sexual partners (ratio).
Finally, sometimes when analyzing data, researchers find a need to change a data’s level of measurement. For example, a few years ago, a student was interested in studying the relationship between mental health and life satisfaction. This student used a variety of measures. One item asked about the number of mental health symptoms, reported as the actual number. When analyzing data, my student examined the mental health symptom variable and noticed that she had two groups, those with none or one symptoms and those with many symptoms. Instead of using the ratio level data (actual number of mental health symptoms), she collapsed her cases into two categories, few and many. She decided to use this variable in her analyses. It is important to note that you can move a higher level of data to a lower level of data; however, you are unable to move a lower level to a higher level.
Exercises
- Check that the variables in your research question can vary…and that they are not constants or one of many potential attributes of a variable.
- Think about the attributes your variables have. Are they categorical or continuous? What level of measurement seems most appropriate?

Step 2: Specifying measures for each variable
Let’s pick a social work research question and walk through the process of operationalizing variables to see how specific we need to get. I’m going to hypothesize that residents of a psychiatric unit who are more depressed are less likely to be satisfied with care. Remember, this would be a inverse relationship—as depression increases, satisfaction decreases. In this question, depression is my independent variable (the cause) and satisfaction with care is my dependent variable (the effect). Now we have identified our variables, their attributes, and levels of measurement, we move onto the second component: the measure itself.
So, how would you measure my key variables: depression and satisfaction? What indicators would you look for? Some students might say that depression could be measured by observing a participant’s body language. They may also say that a depressed person will often express feelings of sadness or hopelessness. In addition, a satisfied person might be happy around service providers and often express gratitude. While these factors may indicate that the variables are present, they lack coherence. Unfortunately, what this “measure” is actually saying is that “I know depression and satisfaction when I see them.” While you are likely a decent judge of depression and satisfaction, you need to provide more information in a research study for how you plan to measure your variables. Your judgment is subjective, based on your own idiosyncratic experiences with depression and satisfaction. They couldn’t be replicated by another researcher. They also can’t be done consistently for a large group of people. Operationalization requires that you come up with a specific and rigorous measure for seeing who is depressed or satisfied.
Finding a good measure for your variable depends on the kind of variable it is. Variables that are directly observable don’t come up very often in my students’ classroom projects, but they might include things like taking someone’s blood pressure, marking attendance or participation in a group, and so forth. To measure an indirectly observable variable like age, you would probably put a question on a survey that asked, “How old are you?” Measuring a variable like income might require some more thought, though. Are you interested in this person’s individual income or the income of their family unit? This might matter if your participant does not work or is dependent on other family members for income. Do you count income from social welfare programs? Are you interested in their income per month or per year? Even though indirect observables are relatively easy to measure, the measures you use must be clear in what they are asking, and operationalization is all about figuring out the specifics of what you want to know. For more complicated constructs, you will need compound measures (that use multiple indicators to measure a single variable).
How you plan to collect your data also influences how you will measure your variables. For social work researchers using secondary data like client records as a data source, you are limited by what information is in the data sources you can access. If your organization uses a given measurement for a mental health outcome, that is the one you will use in your study. Similarly, if you plan to study how long a client was housed after an intervention using client visit records, you are limited by how their caseworker recorded their housing status in the chart. One of the benefits of collecting your own data is being able to select the measures you feel best exemplify your understanding of the topic.
Measuring unidimensional concepts
The previous section mentioned two important considerations: how complicated the variable is and how you plan to collect your data. With these in hand, we can use the level of measurement to further specify how you will measure your variables and consider specialized rating scales developed by social science researchers.
Measurement at each level
Nominal measures assess categorical variables. These measures are used for variables or indicators that have mutually exclusive attributes, but that cannot be rank-ordered. Nominal measures ask about the variable and provide names or labels for different attribute values like social work, counseling, and nursing for the variable profession. Nominal measures are relatively straightforward.
Ordinal measures often use a rating scale. It is an ordered set of responses that participants must choose from. Figure 11.1 shows several examples. The number of response options on a typical rating scale is usualy five or seven, though it can range from three to 11. Five-point scales are best for unipolar scales where only one construct is tested, such as frequency (Never, Rarely, Sometimes, Often, Always). Seven-point scales are best for bipolar scales where there is a dichotomous spectrum, such as liking (Like very much, Like somewhat, Like slightly, Neither like nor dislike, Dislike slightly, Dislike somewhat, Dislike very much). For bipolar questions, it is useful to offer an earlier question that branches them into an area of the scale; if asking about liking ice cream, first ask “Do you generally like or dislike ice cream?” Once the respondent chooses like or dislike, refine it by offering them relevant choices from the seven-point scale. Branching improves both reliability and validity (Krosnick & Berent, 1993).[9] Although you often see scales with numerical labels, it is best to only present verbal labels to the respondents but convert them to numerical values in the analyses. Avoid partial labels or length or overly specific labels. In some cases, the verbal labels can be supplemented with (or even replaced by) meaningful graphics. The last rating scale shown in Figure 11.1 is a visual-analog scale, on which participants make a mark somewhere along the horizontal line to indicate the magnitude of their response.
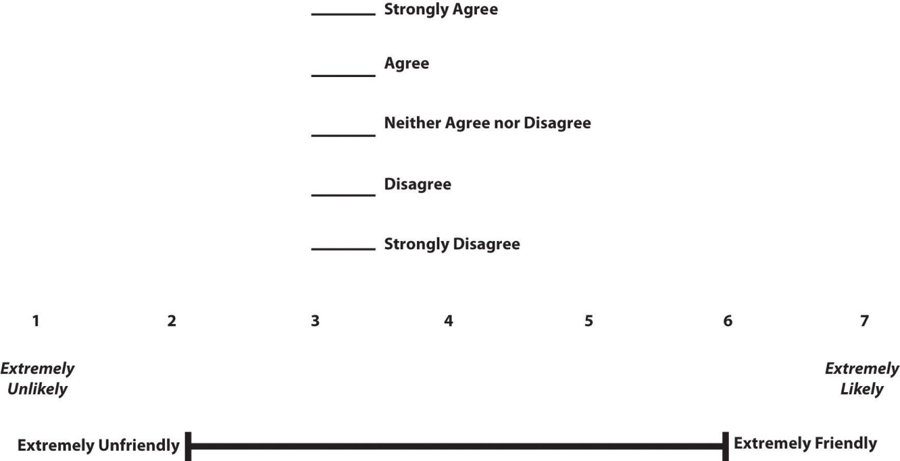
Figure 11.1 Example rating scales for closed-ended questionnaire items
Interval measures are those where the values measured are not only rank-ordered, but are also equidistant from adjacent attributes. For example, the temperature scale (in Fahrenheit or Celsius), where the difference between 30 and 40 degree Fahrenheit is the same as that between 80 and 90 degree Fahrenheit. Likewise, if you have a scale that asks respondents’ annual income using the following attributes (ranges): $0 to 10,000, $10,000 to 20,000, $20,000 to 30,000, and so forth, this is also an interval measure, because the mid-point of each range (i.e., $5,000, $15,000, $25,000, etc.) are equidistant from each other. The intelligence quotient (IQ) scale is also an interval measure, because the measure is designed such that the difference between IQ scores 100 and 110 is supposed to be the same as between 110 and 120 (although we do not really know whether that is truly the case). Interval measures allow us to examine “how much more” is one attribute when compared to another, which is not possible with nominal or ordinal measures. You may find researchers who “pretend” (incorrectly) that ordinal rating scales are actually interval measures so that we can use different statistical techniques for analyzing them. As we will discuss in the latter part of the chapter, this is a mistake because there is no way to know whether the difference between a 3 and a 4 on a rating scale is the same as the difference between a 2 and a 3. Those numbers are just placeholders for categories.
Ratio measures are those that have all the qualities of nominal, ordinal, and interval scales, and in addition, also have a “true zero” point (where the value zero implies lack or non-availability of the underlying construct). Think about how to measure the number of people working in human resources at a social work agency. It could be one, several, or none (if the company contracts out for those services). Measuring interval and ratio data is relatively easy, as people either select or input a number for their answer. If you ask a person how many eggs they purchased last week, they can simply tell you they purchased `a dozen eggs at the store, two at breakfast on Wednesday, or none at all.
Commonly used rating scales in questionnaires
The level of measurement will give you the basic information you need, but social scientists have developed specialized instruments for use in questionnaires, a common tool used in quantitative research. As we mentioned before, if you plan to source your data from client files or previously published results
Although Likert scale is a term colloquially used to refer to almost any rating scale (e.g., a 0-to-10 life satisfaction scale), it has a much more precise meaning. In the 1930s, researcher Rensis Likert (pronounced LICK-ert) created a new approach for measuring people’s attitudes (Likert, 1932).[10] It involves presenting people with several statements—including both favorable and unfavorable statements—about some person, group, or idea. Respondents then express their agreement or disagreement with each statement on a 5-point scale: Strongly Agree, Agree, Neither Agree nor Disagree, Disagree, Strongly Disagree. Numbers are assigned to each response and then summed across all items to produce a score representing the attitude toward the person, group, or idea. For items that are phrased in an opposite direction (e.g., negatively worded statements instead of positively worded statements), reverse coding is used so that the numerical scoring of statements also runs in the opposite direction. The entire set of items came to be called a Likert scale, as indicated in Table 11.2 below.
Unless you are measuring people’s attitude toward something by assessing their level of agreement with several statements about it, it is best to avoid calling it a Likert scale. You are probably just using a rating scale. Likert scales allow for more granularity (more finely tuned response) than yes/no items, including whether respondents are neutral to the statement. Below is an example of how we might use a Likert scale to assess your attitudes about research as you work your way through this textbook.
Table 11.2 Likert scale
| Strongly agree | Agree | Neutral | Disagree | Strongly disagree | |
| I like research more now than when I started reading this book. | |||||
| This textbook is easy to use. | |||||
| I feel confident about how well I understand levels of measurement. | |||||
| This textbook is helping me plan my research proposal. |
Semantic differential scales are composite (multi-item) scales in which respondents are asked to indicate their opinions or feelings toward a single statement using different pairs of adjectives framed as polar opposites. Whereas in the above Likert scale, the participant is asked how much they agree or disagree with a statement, in a semantic differential scale the participant is asked to indicate how they feel about a specific item. This makes the semantic differential scale an excellent technique for measuring people’s attitudes or feelings toward objects, events, or behaviors. Table 11.3 is an example of a semantic differential scale that was created to assess participants’ feelings about this textbook.
Table 11.3. A semantic differential scale for measuring attitudes towards a textbook
| 1) How would you rate your opinions toward this textbook? | ||||||
| Very much | Somewhat | Neither | Somewhat | Very much | ||
| Boring | Exciting | |||||
| Useless | Useful | |||||
| Hard | Easy | |||||
| Irrelevant | Applicable | |||||
Notice that on a Likert scale, each item is different but the choices for the scale are the same (e.g., strongly agree, agree, etc.). However, for a semantic differential scale, the thing that you are reviewing, in this case, beliefs about research content, remains the same. It is the choices that change. Semantic differential is believed to be an excellent technique for measuring people’s attitude or feelings toward objects, events, or behaviors.
This composite scale was designed by Louis Guttman and uses a series of items arranged in increasing order of intensity (least intense to most intense) of the concept. This type of scale allows us to understand the intensity of beliefs or feelings. Each item in the above Guttman scale has a weight (this is not indicated on the tool) which varies with the intensity of that item, and the weighted combination of each response is used as an aggregate measure of an observation.
|
Example Guttman Scale Items
|
Notice how the items move from lower intensity to higher intensity. A researcher reviews the yes answers and creates a score for each participant.
For more complicated measures, researchers use scales and indices (sometimes called indexes) to measure their variables because they assess multiple indicators to develop a composite (or total) score. Composite scores provide a much greater understanding of concepts than a single item could. Although we won’t delve too deeply into the process of scale development, we will cover some important topics for you to understand how scales and indices developed by other researchers can be used in your project.
Although they exhibit differences (which will later be discussed) the two have in common various factors.
- Both are ordinal measures of variables.
- Both can order the units of analysis in terms of specific variables.
- Both are composite measures.
Scales
The previous section discussed how to measure respondents’ responses to predesigned items or indicators belonging to an underlying construct. But how do we create the indicators themselves? The process of creating the indicators is called scaling. More formally, scaling is a branch of measurement that involves the construction of measures by associating qualitative judgments about unobservable constructs with quantitative, measurable metric units. Stevens (1946)\(^{11}\) said, “Scaling is the assignment of objects to numbers according to a rule.” This process of measuring abstract concepts in concrete terms remains one of the most difficult tasks in empirical social science research.
The outcome of a scaling process is a scale, which is an empirical structure for measuring items or indicators of a given construct. Understand that multidimensional “scales”, as discussed in this section, are a little different from “rating scales” discussed in the previous section. A rating scale is used to capture the respondents’ reactions to a given item on a questionnaire. For example, an ordinally scaled item captures a value between “strongly disagree” to “strongly agree.” Attaching a rating scale to a statement or instrument is not scaling. Rather, scaling is the formal process of developing scale items, before rating scales can be attached to those items.
If creating your own scale sounds painful, don’t worry! For most multidimensional variables, you would likely be duplicating work that has already been done by other researchers. Specifically, this is a branch of science called psychometrics. You do not need to create a scale for depression because scales such as the Patient Health Questionnaire (PHQ-9), the Center for Epidemiologic Studies Depression Scale (CES-D), and Beck’s Depression Inventory (BDI) have been developed and refined over dozens of years to measure variables like depression. Similarly, scales such as the Patient Satisfaction Questionnaire (PSQ-18) have been developed to measure satisfaction with medical care. As we will discuss in the next section, these scales have been shown to be reliable and valid. While you could create a new scale to measure depression or satisfaction, a study with rigor would pilot test and refine that new scale over time to make sure it measures the concept accurately and consistently. This high level of rigor is often unachievable in student research projects because of the cost and time involved in pilot testing and validating, so using existing scales is recommended.
Unfortunately, there is no good one-stop=shop for psychometric scales. The Mental Measurements Yearbook provides a searchable database of measures for social science variables, though it woefully incomplete and often does not contain the full documentation for scales in its database. You can access it from a university library’s list of databases. If you can’t find anything in there, your next stop should be the methods section of the articles in your literature review. The methods section of each article will detail how the researchers measured their variables, and often the results section is instructive for understanding more about measures. In a quantitative study, researchers may have used a scale to measure key variables and will provide a brief description of that scale, its names, and maybe a few example questions. If you need more information, look at the results section and tables discussing the scale to get a better idea of how the measure works. Looking beyond the articles in your literature review, searching Google Scholar using queries like “depression scale” or “satisfaction scale” should also provide some relevant results. For example, searching for documentation for the Rosenberg Self-Esteem Scale (which we will discuss in the next section), I found this report from researchers investigating acceptance and commitment therapy which details this scale and many others used to assess mental health outcomes. If you find the name of the scale somewhere but cannot find the documentation (all questions and answers plus how to interpret the scale), a general web search with the name of the scale and “.pdf” may bring you to what you need. Or, to get professional help with finding information, always ask a librarian!
Unfortunately, these approaches do not guarantee that you will be able to view the scale itself or get information on how it is interpreted. Many scales cost money to use and may require training to properly administer. You may also find scales that are related to your variable but would need to be slightly modified to match your study’s needs. You could adapt a scale to fit your study, however changing even small parts of a scale can influence its accuracy and consistency. While it is perfectly acceptable in student projects to adapt a scale without testing it first (time may not allow you to do so), pilot testing is always recommended for adapted scales, and researchers seeking to draw valid conclusions and publish their results must take this additional step.
Indices
An index is a composite score derived from aggregating measures of multiple concepts (called components) using a set of rules and formulas. It is different from a scale. Scales also aggregate measures; however, these measures examine different dimensions or the same dimension of a single construct. A well-known example of an index is the consumer price index (CPI), which is computed every month by the Bureau of Labor Statistics of the U.S. Department of Labor. The CPI is a measure of how much consumers have to pay for goods and services (in general) and is divided into eight major categories (food and beverages, housing, apparel, transportation, healthcare, recreation, education and communication, and “other goods and services”), which are further subdivided into more than 200 smaller items. Each month, government employees call all over the country to get the current prices of more than 80,000 items. Using a complicated weighting scheme that takes into account the location and probability of purchase for each item, analysts then combine these prices into an overall index score using a series of formulas and rules.
Another example of an index is the Duncan Socioeconomic Index (SEI). This index is used to quantify a person’s socioeconomic status (SES) and is a combination of three concepts: income, education, and occupation. Income is measured in dollars, education in years or degrees achieved, and occupation is classified into categories or levels by status. These very different measures are combined to create an overall SES index score. However, SES index measurement has generated a lot of controversy and disagreement among researchers.
| Here is a resource where you can read a summary of the Socio-Economic Index debate. |
The process of creating an index is similar to that of a scale. First, conceptualize (define) the index and its constituent components. Though this appears simple, there may be a lot of disagreement on what components (concepts/constructs) should be included or excluded from an index. For instance, in the SES index, isn’t income correlated with education and occupation? And if so, should we include one component only or all three components? Reviewing the literature, using theories, and/or interviewing experts or key stakeholders may help resolve this issue. Second, operationalize and measure each component. For instance, how will you categorize occupations, particularly since some occupations may have changed with time (e.g., there were no Web developers before the Internet)? As we will see in step three below, researchers must create a rule or formula for calculating the index score. Again, this process may involve a lot of subjectivity, so validating the index score using existing or new data is important.
Scale and index development at often taught in their own course in doctoral education, so it is unreasonable for you to expect to develop a consistently accurate measure within the span of a week or two. Using available indices and scales is recommended for this reason.
Differences between scales and indices
Though indices and scales yield a single numerical score or value representing a concept of interest, they are different in many ways. First, indices often comprise components that are very different from each other (e.g., income, education, and occupation in the SES index) and are measured in different ways. Conversely, scales typically involve a set of similar items that use the same rating scale (such as a five-point Likert scale about customer satisfaction).
Second, indices often combine objectively measurable values such as prices or income, while scales are designed to assess subjective or judgmental constructs such as attitude, prejudice, or self-esteem. Some argue that the sophistication of the scaling methodology makes scales different from indexes, while others suggest that indexing methodology can be equally sophisticated. Nevertheless, indexes and scales are both essential tools in social science research.
Scales and indices seem like clean, convenient ways to measure different phenomena in social science, but just like with a lot of research, we have to be mindful of the assumptions and biases underneath. What if a scale or an index was developed using only White women as research participants? Is it going to be useful for other groups? It very well might be, but when using a scale or index on a group for whom it hasn’t been tested, it will be very important to evaluate the validity and reliability of the instrument, which we address in the rest of the chapter.
Finally, it’s important to note that while scales and indices are often made up of nominal or ordinal variables, when we analyze them into composite scores, we will treat them as interval/ratio variables.
Exercises
- Look back to your work from the previous section, are your variables unidimensional or multidimensional?
- Describe the specific measures you will use (actual questions and response options you will use with participants) for each variable in your research question.
- If you are using a measure developed by another researcher but do not have all of the questions, response options, and instructions needed to implement it, put it on your to-do list to get them.
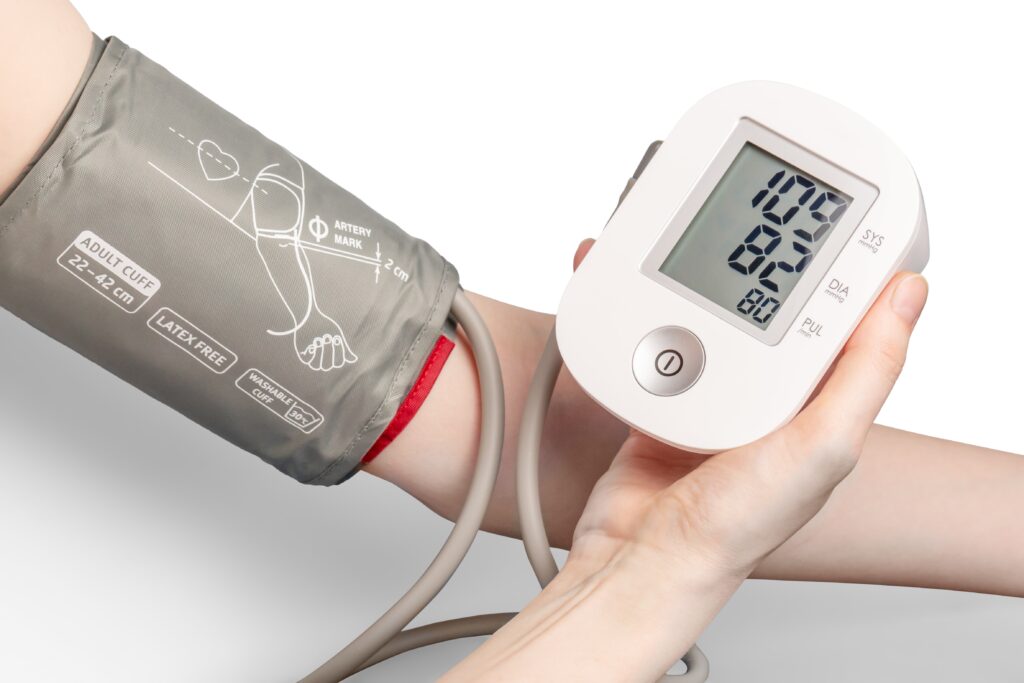
If we were operationalizing blood pressure, the cuff and reader would be the measure…but how do we interpret what is high, low, and normal blood pressure?
Step 3: How you will interpret your measures
The final stage of operationalization involves setting the rules for how the measure works and how the researcher should interpret the results. Sometimes, interpreting a measure can be incredibly easy. If you ask someone their age, you’ll probably interpret the results by noting the raw number (e.g., 22) someone provides and that it is lower or higher than other people’s ages. However, you could also recode that person into age categories (e.g., under 25, 20-29-years-old, generation Z, etc.). Even scales may be simple to interpret. If there is a scale of problem behaviors, one might simply add up the number of behaviors checked off–with a range from 1-5 indicating low risk of delinquent behavior, 6-10 indicating the student is moderate risk, etc. How you choose to interpret your measures should be guided by how they were designed, how you conceptualize your variables, the data sources you used, and your plan for analyzing your data statistically. Whatever measure you use, you need a set of rules for how to take any valid answer a respondent provides to your measure and interpret it in terms of the variable being measured.
For more complicated measures like scales, refer to the information provided by the author for how to interpret the scale. If you can’t find enough information from the scale’s creator, look at how the results of that scale are reported in the results section of research articles. For example, Beck’s Depression Inventory (BDI-II) uses 21 statements to measure depression and respondents rate their level of agreement on a scale of 0-3. The results for each question are added up, and the respondent is put into one of three categories: low levels of depression (1-16), moderate levels of depression (17-30), or severe levels of depression (31 and over).
One common mistake I see often is that students will introduce another variable into their operational definition. This is incorrect. Your operational definition should mention only one variable—the variable being defined. While your study will certainly draw conclusions about the relationships between variables, that’s not what operationalization is. Operationalization specifies what instrument you will use to measure your variable and how you plan to interpret the data collected using that measure.
Operationalization is probably the trickiest component of basic research methods, so please don’t get frustrated if it takes a few drafts and a lot of feedback to get to a workable definition. At the time of this writing, I am in the process of operationalizing the concept of “attitudes towards research methods.” Originally, I thought that I could gauge students’ attitudes toward research methods by looking at their end-of-semester course evaluations. As I became aware of the potential methodological issues with student course evaluations, I opted to use focus groups of students to measure their common beliefs about research. You may recall some of these opinions from Chapter 1, such as the common beliefs that research is boring, useless, and too difficult. After the focus group, I created a scale based on the opinions I gathered, and I plan to pilot test it with another group of students. After the pilot test, I expect that I will have to revise the scale again before I can implement the measure in a real social work research project. At the time I’m writing this, I’m still not completely done operationalizing this concept.
Key Takeaways
- Operationalization involves spelling out precisely how a concept will be measured.
- Operational definitions must include the variable, the measure, and how you plan to interpret the measure.
- There are four different levels of measurement: nominal, ordinal, interval, and ratio (in increasing order of specificity).
- Scales and indices are common ways to collect information and involve using multiple indicators in measurement.
- A key difference between a scale and an index is that a scale contains multiple indicators for one concept, whereas an indicator examines multiple concepts (components).
- Using scales developed and refined by other researchers can improve the rigor of a quantitative study.
Exercises
Use the research question that you developed in the previous chapters and find a related scale or index that researchers have used. If you have trouble finding the exact phenomenon you want to study, get as close as you can.
- What is the level of measurement for each item on each tool? Take a second and think about why the tool’s creator decided to include these levels of measurement. Identify any levels of measurement you would change and why.
- If these tools don’t exist for what you are interested in studying, why do you think that is?