
11.3: Measurement quality
- Page ID
- 135145

\( \newcommand{\vecs}[1]{\overset { \scriptstyle \rightharpoonup} {\mathbf{#1}} } \)
\( \newcommand{\vecd}[1]{\overset{-\!-\!\rightharpoonup}{\vphantom{a}\smash {#1}}} \)
\( \newcommand{\id}{\mathrm{id}}\) \( \newcommand{\Span}{\mathrm{span}}\)
( \newcommand{\kernel}{\mathrm{null}\,}\) \( \newcommand{\range}{\mathrm{range}\,}\)
\( \newcommand{\RealPart}{\mathrm{Re}}\) \( \newcommand{\ImaginaryPart}{\mathrm{Im}}\)
\( \newcommand{\Argument}{\mathrm{Arg}}\) \( \newcommand{\norm}[1]{\| #1 \|}\)
\( \newcommand{\inner}[2]{\langle #1, #2 \rangle}\)
\( \newcommand{\Span}{\mathrm{span}}\)
\( \newcommand{\id}{\mathrm{id}}\)
\( \newcommand{\Span}{\mathrm{span}}\)
\( \newcommand{\kernel}{\mathrm{null}\,}\)
\( \newcommand{\range}{\mathrm{range}\,}\)
\( \newcommand{\RealPart}{\mathrm{Re}}\)
\( \newcommand{\ImaginaryPart}{\mathrm{Im}}\)
\( \newcommand{\Argument}{\mathrm{Arg}}\)
\( \newcommand{\norm}[1]{\| #1 \|}\)
\( \newcommand{\inner}[2]{\langle #1, #2 \rangle}\)
\( \newcommand{\Span}{\mathrm{span}}\) \( \newcommand{\AA}{\unicode[.8,0]{x212B}}\)
\( \newcommand{\vectorA}[1]{\vec{#1}} % arrow\)
\( \newcommand{\vectorAt}[1]{\vec{\text{#1}}} % arrow\)
\( \newcommand{\vectorB}[1]{\overset { \scriptstyle \rightharpoonup} {\mathbf{#1}} } \)
\( \newcommand{\vectorC}[1]{\textbf{#1}} \)
\( \newcommand{\vectorD}[1]{\overrightarrow{#1}} \)
\( \newcommand{\vectorDt}[1]{\overrightarrow{\text{#1}}} \)
\( \newcommand{\vectE}[1]{\overset{-\!-\!\rightharpoonup}{\vphantom{a}\smash{\mathbf {#1}}}} \)
\( \newcommand{\vecs}[1]{\overset { \scriptstyle \rightharpoonup} {\mathbf{#1}} } \)
\( \newcommand{\vecd}[1]{\overset{-\!-\!\rightharpoonup}{\vphantom{a}\smash {#1}}} \)
Learning Objectives
Learners will be able to…
- Define and describe the types of validity and reliability
- Assess for systematic error
The previous chapter provided insight into measuring concepts in social work research. We discussed the importance of identifying concepts and their corresponding indicators as a way to help us operationalize them. In essence, we now understand that when we think about our measurement process, we must be intentional and thoughtful in the choices that we make. This section is all about how to judge the quality of the measures you’ve chosen for the key variables in your research question.
Reliability
First, let’s say we’ve decided to measure alcoholism by asking people to respond to the following question: Have you ever had a problem with alcohol? If we measure alcoholism this way, then it is likely that anyone who identifies as an alcoholic would respond “yes.” This may seem like a good way to identify our group of interest, but think about how you and your peer group may respond to this question. Would participants respond differently after a wild night out, compared to any other night? Could an infrequent drinker’s current headache from last night’s glass of wine influence how they answer the question this morning? How would that same person respond to the question before consuming the wine? In each cases, the same person might respond differently to the same question at different points, so it is possible that our measure of alcoholism has a reliability problem. Reliability in measurement is about consistency.
One common problem of reliability with social scientific measures is memory. If we ask research participants to recall some aspect of their own past behavior, we should try to make the recollection process as simple and straightforward for them as possible. Sticking with the topic of alcohol intake, if we ask respondents how much wine, beer, and liquor they’ve consumed each day over the course of the past 3 months, how likely are we to get accurate responses? Unless a person keeps a journal documenting their intake, there will very likely be some inaccuracies in their responses. On the other hand, we might get more accurate responses if we ask a participant how many drinks of any kind they have consumed in the past week.
Reliability can be an issue even when we’re not reliant on others to accurately report their behaviors. Perhaps a researcher is interested in observing how alcohol intake influences interactions in public locations. They may decide to conduct observations at a local pub by noting how many drinks patrons consume and how their behavior changes as their intake changes. What if the researcher has to use the restroom, and the patron next to them takes three shots of tequila during the brief period the researcher is away from their seat? The reliability of this researcher’s measure of alcohol intake depends on their ability to physically observe every instance of patrons consuming drinks. If they are unlikely to be able to observe every such instance, then perhaps their mechanism for measuring this concept is not reliable.
The following subsections describe the types of reliability that are important for you to know about, but keep in mind that you may see other approaches to judging reliability mentioned in the empirical literature.
Test-retest reliability
When researchers measure a construct that they assume to be consistent across time, then the scores they obtain should also be consistent across time. Test-retest reliability is the extent to which this is actually the case. For example, intelligence is generally thought to be consistent across time. A person who is highly intelligent today will be highly intelligent next week. This means that any good measure of intelligence should produce roughly the same scores for this individual next week as it does today. Clearly, a measure that produces highly inconsistent scores over time cannot be a very good measure of a construct that is supposed to be consistent.
Assessing test-retest reliability requires using the measure on a group of people at one time, using it again on the same group of people at a later time. Unlike an experiment, you aren’t giving participants an intervention but trying to establish a reliable baseline of the variable you are measuring. Once you have these two measurements, you then look at the correlation between the two sets of scores. This is typically done by graphing the data in a scatterplot and computing the correlation coefficient. Figure 11.2 shows the correlation between two sets of scores of several university students on the Rosenberg Self-Esteem Scale, administered two times, a week apart. The correlation coefficient for these data is +.95. In general, a test-retest correlation of +.80 or greater is considered to indicate good reliability.
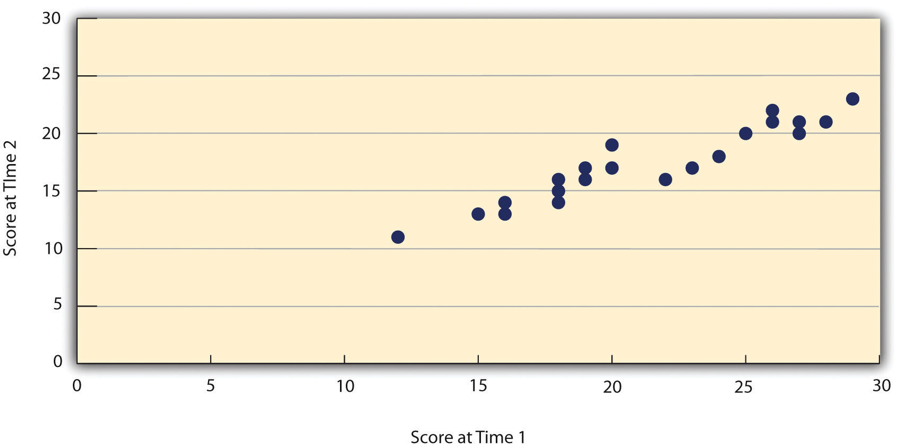
Figure 11.2 Test-retest correlation between two sets of scores of several college students on the Rosenberg Self-Esteem Scale, given two times a week apart
Again, high test-retest correlations make sense when the construct being measured is assumed to be consistent over time, which is the case for intelligence, self-esteem, and the Big Five personality dimensions. But other constructs are not assumed to be stable over time. The very nature of mood, for example, is that it changes. So a measure of mood that produced a low test-retest correlation over a period of a month would not be a cause for concern.
Internal consistency
Another kind of reliability is internal consistency, which is the consistency of people’s responses across the items on a multiple-item measure. In general, all the items on such measures are supposed to reflect the same underlying construct, so people’s scores on those items should be correlated with each other. On the Rosenberg Self-Esteem Scale, people who agree that they are a person of worth should tend to agree that they have a number of good qualities. If people’s responses to the different items are not correlated with each other, then it would no longer make sense to claim that they are all measuring the same underlying construct. This is as true for behavioral and physiological measures as for self-report measures. For example, people might make a series of bets in a simulated game of roulette as a measure of their level of risk seeking. This measure would be internally consistent to the extent that individual participants’ bets were consistently high or low across trials. A specific statistical test known as Cronbach’s Alpha provides a way to measure how well each question of a scale is related to the others.
Interrater reliability
Many behavioral measures involve significant judgment on the part of an observer or a rater. Interrater reliability is the extent to which different observers are consistent in their judgments. For example, if you were interested in measuring university students’ social skills, you could make video recordings of them as they interacted with another student whom they are meeting for the first time. Then you could have two or more observers watch the videos and rate each student’s level of social skills. To the extent that each participant does, in fact, have some level of social skills that can be detected by an attentive observer, different observers’ ratings should be highly correlated with each other.

Validity
Validity, another key element of assessing measurement quality, is the extent to which the scores from a measure represent the variable they are intended to. But how do researchers make this judgment? We have already considered one factor that they take into account—reliability. When a measure has good test-retest reliability and internal consistency, researchers should be more confident that the scores represent what they are supposed to. There has to be more to it, however, because a measure can be extremely reliable but have no validity whatsoever. As an absurd example, imagine someone who believes that people’s index finger length reflects their self-esteem and therefore tries to measure self-esteem by holding a ruler up to people’s index fingers. Although this measure would have extremely good test-retest reliability, it would have absolutely no validity. The fact that one person’s index finger is a centimeter longer than another’s would indicate nothing about which one had higher self-esteem.
Discussions of validity usually divide it into several distinct “types.” But a good way to interpret these types is that they are other kinds of evidence—in addition to reliability—that should be taken into account when judging the validity of a measure.
Face validity
Face validity is the extent to which a measurement method appears “on its face” to measure the construct of interest. Most people would expect a self-esteem questionnaire to include items about whether they see themselves as a person of worth and whether they think they have good qualities. So a questionnaire that included these kinds of items would have good face validity. The finger-length method of measuring self-esteem, on the other hand, seems to have nothing to do with self-esteem and therefore has poor face validity. Although face validity can be assessed quantitatively—for example, by having a large sample of people rate a measure in terms of whether it appears to measure what it is intended to—it is usually assessed informally.
Face validity is at best a very weak kind of evidence that a measurement method is measuring what it is supposed to. One reason is that it is based on people’s intuitions about human behavior, which are frequently wrong. It is also the case that many established measures in psychology work quite well despite lacking face validity. The Minnesota Multiphasic Personality Inventory-2 (MMPI-2) measures many personality characteristics and disorders by having people decide whether each of over 567 different statements applies to them—where many of the statements do not have any obvious relationship to the construct that they measure. For example, the items “I enjoy detective or mystery stories” and “The sight of blood doesn’t frighten me or make me sick” both measure the suppression of aggression. In this case, it is not the participants’ literal answers to these questions that are of interest, but rather whether the pattern of the participants’ responses to a series of questions matches those of individuals who tend to suppress their aggression.
Content validity
Content validity is the extent to which a measure “covers” the construct of interest. For example, if a researcher conceptually defines test anxiety as involving both sympathetic nervous system activation (leading to nervous feelings) and negative thoughts, then his measure of test anxiety should include items about both nervous feelings and negative thoughts. Or consider that attitudes are usually defined as involving thoughts, feelings, and actions toward something. By this conceptual definition, a person has a positive attitude toward exercise to the extent that they think positive thoughts about exercising, feels good about exercising, and actually exercises. So to have good content validity, a measure of people’s attitudes toward exercise would have to reflect all three of these aspects. Like face validity, content validity is not usually assessed quantitatively. Instead, it is assessed by carefully checking the measurement method against the conceptual definition of the construct.
Criterion validity
Criterion validity is the extent to which people’s scores on a measure are correlated with other variables (known as criteria) that one would expect them to be correlated with. For example, people’s scores on a new measure of test anxiety should be negatively correlated with their performance on an important school exam. If it were found that people’s scores were in fact negatively correlated with their exam performance, then this would be a piece of evidence that these scores really represent people’s test anxiety. But if it were found that people scored equally well on the exam regardless of their test anxiety scores, then this would cast doubt on the validity of the measure.
A criterion can be any variable that one has reason to think should be correlated with the construct being measured, and there will usually be many of them. For example, one would expect test anxiety scores to be negatively correlated with exam performance and course grades and positively correlated with general anxiety and with blood pressure during an exam. Or imagine that a researcher develops a new measure of physical risk taking. People’s scores on this measure should be correlated with their participation in “extreme” activities such as snowboarding and rock climbing, the number of speeding tickets they have received, and even the number of broken bones they have had over the years. When the criterion is measured at the same time as the construct, criterion validity is referred to as concurrent validity; however, when the criterion is measured at some point in the future (after the construct has been measured), it is referred to as predictive validity (because scores on the measure have “predicted” a future outcome).
Discriminant validity
Discriminant validity, on the other hand, is the extent to which scores on a measure are not correlated with measures of variables that are conceptually distinct. For example, self-esteem is a general attitude toward the self that is fairly stable over time. It is not the same as mood, which is how good or bad one happens to be feeling right now. So people’s scores on a new measure of self-esteem should not be very highly correlated with their moods. If the new measure of self-esteem were highly correlated with a measure of mood, it could be argued that the new measure is not really measuring self-esteem; it is measuring mood instead.
Increasing the reliability and validity of measures
We have reviewed the types of errors and how to evaluate our measures based on reliability and validity considerations. However, what can we do while selecting or creating our tool so that we minimize the potential of errors? Many of our options were covered in our discussion about reliability and validity. Nevertheless, the following table provides a quick summary of things that you should do when creating or selecting a measurement tool. While not all of these will be feasible in your project, it is important to include easy-to-implement measures in your research context.
Make sure that you engage in a rigorous literature review so that you understand the concept that you are studying. This means understanding the different ways that your concept may manifest itself. This review should include a search for existing instruments.\(^{12}\)
- Do you understand all the dimensions of your concept? Do you have a good understanding of the content dimensions of your concept(s)?
- What instruments exist? How many items are on the existing instruments? Are these instruments appropriate for your population?
- Are these instruments standardized? Note: If an instrument is standardized, that means it has been rigorously studied and tested.
Consult content experts to review your instrument. This is a good way to check the face validity of your items. Additionally, content experts can also help you understand the content validity. \(^{13}\)
- Do you have access to a reasonable number of content experts? If not, how can you locate them?
- Did you provide a list of critical questions for your content reviewers to use in the reviewing process?
Pilot test your instrument on a sufficient number of people and get detailed feedback. \(^{14}\) Ask your group to provide feedback on the wording and clarity of items. Keep detailed notes and make adjustments BEFORE you administer your final tool.
- How many people will you use in your pilot testing?
- How will you set up your pilot testing so that it mimics the actual process of administering your tool?
- How will you receive feedback from your pilot testing group? Have you provided a list of questions for your group to think about?
Provide training for anyone collecting data for your project. \(^{15}\) You should provide those helping you with a written research protocol that explains all of the steps of the project. You should also problem solve and answer any questions that those helping you may have. This will increase the chances that your tool will be administered in a consistent manner.
- How will you conduct your orientation/training? How long will it be? What modality?
- How will you select those who will administer your tool? What qualifications do they need?
When thinking of items, use a higher level of measurement, if possible. \(^{16}\) This will provide more information and you can always downgrade to a lower level of measurement later.
- Have you examined your items and the levels of measurement?
- Have you thought about whether you need to modify the type of data you are collecting? Specifically, are you asking for information that is too specific (at a higher level of measurement) which may reduce participants’ willingness to participate?
Use multiple indicators for a variable. \(^{17}\) Think about the number of items that you will include in your tool.
- Do you have enough items? Enough indicators? The correct indicators?
Conduct an item-by-item assessment of multiple-item measures. \(^{18}\) When you do this assessment, think about each word and how it changes the meaning of your item.
- Are there items that are redundant? Do you need to modify, delete, or add items?
Types of error
As you can see, measures never perfectly describe what exists in the real world. Good measures demonstrate validity and reliability but will always have some degree of error. Systematic error (also called bias) causes our measures to consistently output incorrect data in one direction or another on a measure, usually due to an identifiable process. Imagine you created a measure of height, but you didn’t put an option for anyone over six feet tall. If you gave that measure to your local college or university, some of the taller students might not be measured accurately. In fact, you would be under the mistaken impression that the tallest person at your school was six feet tall, when in actuality there are likely people taller than six feet at your school. This error seems innocent, but if you were using that measure to help you build a new building, those people might hit their heads!
A less innocent form of error arises when researchers word questions in a way that might cause participants to think one answer choice is preferable to another. For example, if I were to ask you “Do you think global warming is caused by human activity?” you would probably feel comfortable answering honestly. But what if I asked you “Do you agree with 99% of scientists that global warming is caused by human activity?” Would you feel comfortable saying no, if that’s what you honestly felt? I doubt it. That is an example of a leading question, a question with wording that influences how a participant responds. We’ll discuss leading questions and other problems in question wording in greater detail in Chapter 12.
In addition to error created by the researcher, your participants can cause error in measurement. Some people will respond without fully understanding a question, particularly if the question is worded in a confusing way. Let’s consider another potential source or error. If we asked people if they always washed their hands after using the bathroom, would we expect people to be perfectly honest? Polling people about whether they wash their hands after using the bathroom might only elicit what people would like others to think they do, rather than what they actually do. This is an example of social desirability bias, in which participants in a research study want to present themselves in a positive, socially desirable way to the researcher. People in your study will want to seem tolerant, open-minded, and intelligent, but their true feelings may be closed-minded, simple, and biased. Participants may lie in this situation. This occurs often in political polling, which may show greater support for a candidate from a minority race, gender, or political party than actually exists in the electorate.
A related form of bias is called acquiescence bias, also known as “yea-saying.” It occurs when people say yes to whatever the researcher asks, even when doing so contradicts previous answers. For example, a person might say yes to both “I am a confident leader in group discussions” and “I feel anxious interacting in group discussions.” Those two responses are unlikely to both be true for the same person. Why would someone do this? Similar to social desirability, people want to be agreeable and nice to the researcher asking them questions or they might ignore contradictory feelings when responding to each question. You could interpret this as someone saying “yeah, I guess.” Respondents may also act on cultural reasons, trying to “save face” for themselves or the person asking the questions. Regardless of the reason, the results of your measure don’t match what the person truly feels.
So far, we have discussed sources of error that come from choices made by respondents or researchers. Systematic errors will result in responses that are incorrect in one direction or another. For example, social desirability bias usually means that the number of people who say they will vote for a third party in an election is greater than the number of people who actually vote for that candidate. Systematic errors such as these can be reduced, but random error can never be eliminated. Unlike systematic error, which biases responses consistently in one direction or another, random error is unpredictable and does not consistently result in scores that are consistently higher or lower on a given measure. Instead, random error is more like statistical noise, which will likely average out across participants.
Random error is present in any measurement. If you’ve ever stepped on a bathroom scale twice and gotten two slightly different results, maybe a difference of a tenth of a pound, then you’ve experienced random error. Maybe you were standing slightly differently or had a fraction of your foot off of the scale the first time. If you were to take enough measures of your weight on the same scale, you’d be able to figure out your true weight. In social science, if you gave someone a scale measuring depression on a day after they lost their job, they would likely score differently than if they had just gotten a promotion and a raise. Even if the person were clinically depressed, our measure is subject to influence by the random occurrences of life. Thus, social scientists speak with humility about our measures. We are reasonably confident that what we found is true, but we must always acknowledge that our measures are only an approximation of reality.
Humility is important in scientific measurement, as errors can have real consequences. At the time I’m writing this, my wife and I are expecting our first child. Like most people, we used a pregnancy test from the pharmacy. If the test said my wife was pregnant when she was not pregnant, that would be a false positive. On the other hand, if the test indicated that she was not pregnant when she was in fact pregnant, that would be a false negative. Even if the test is 99% accurate, that means that one in a hundred women will get an erroneous result when they use a home pregnancy test. For us, a false positive would have been initially exciting, then devastating when we found out we were not having a child. A false negative would have been disappointing at first and then quite shocking when we found out we were indeed having a child. While both false positives and false negatives are not very likely for home pregnancy tests (when taken correctly), measurement error can have consequences for the people being measured.
Key Takeaways
- Reliability is a matter of consistency.
- Validity is a matter of accuracy.
- There are many types of validity and reliability.
- Systematic error may arise from the researcher, participant, or measurement instrument.
- Systematic error biases results in a particular direction, whereas random error can be in any direction.
- All measures are prone to error and should interpreted with humility.
Exercises
Use the measurement tools you located in the previous exercise. Evaluate the reliability and validity of these tools. Hint: You will need to go into the literature to “research” these tools.
- Provide a clear statement regarding the reliability and validity of these tools. What strengths did you notice? What were the limitations?
- Think about your target population. Are there changes that need to be made in order for one of these tools to be appropriate for your population?
- If you decide to create your own tool, how will you assess its validity and reliability?