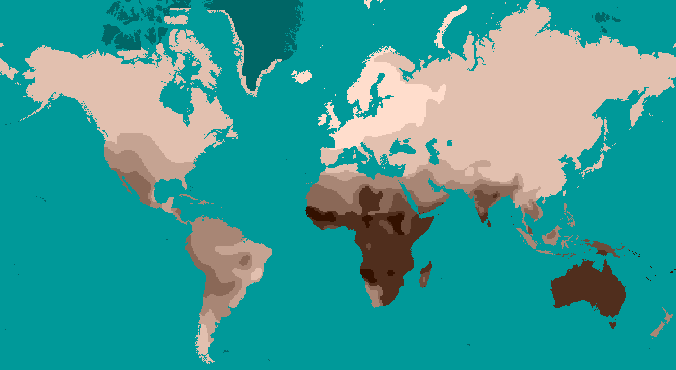
In our studies of human (genetic) variation today, we understand most human traits to be nonconcordant (Figure 13.12). “Nonconcordance” is a term used to describe how biological traits vary independent of each other—that is, they do not get inherited in a correlative manner with other genetically controlled traits. For example, if you knew an individual had genes that coded for tall height, you would not be able to predict if they are lighter-skinned or have red hair. This is different from earlier essentialist views of human variation: the idea that skin color could predict one’s brain function or even “temperament” and tendencies toward criminal behavior.
Figure 13.12: Most human biological traits are non-concordant, meaning traits vary independently and each trait has its own pattern of distribution around the world. In this image, different colors and patterns represent trait varieties. For example, the color and pattern of the head may represent hair color (dark to light), but sharing dark hair with another person does not mean you will share other traits (e.g. ability to digest lactose or ABO blood type). Credit: Nonconcordance original to Explorations: An Open Invitation to Biological Anthropology (2nd ed.) by Katie Nelson is under a CC BY-NC 4.0 License.
Human Variation Is Clinal/Continuous (Not Discrete)
Frank B. Livingstone (1928‒2005) wrote: “There are no races, only clines” (1962: 279). A cline is a gradation in the frequency of an allele/trait between populations living in different geographic regions. Human variation cannot be broken into discrete “races,” because most physical traits vary on a continuous or “clinal” basis. One obvious example of this is how human height does not only come in three values (“short,” “medium,” and “tall”) but instead varies across a spectrum of vertical heights achievable by humans all over the world. On the one hand, we can describe human height as exhibiting continuous variation, forming a continuous pattern, but height does not vary according to where people live across the globe and does not exhibit a clinal pattern. On the other hand, skin color variation between populations does show patterning that fits quite well on to how near or far they are from each other on a world map. This makes a trait like skin color clinally distributed worldwide. When large numbers of genetic loci for large numbers of samples were sampled from human populations distributed worldwide during the 1960s and 1970s, the view that certain facets of human diversity were clinally distributed was further supported by genetic data.
To study human traits that are clinally distributed, genetic tests must be performed to uncover the true frequencies of an allele or trait across a certain geographic space. One easily visible example of a clinal distribution seen worldwide is the patterning of human variation in skin color. Whether in southern Asia, sub-Saharan Africa, or Australia, dark brown skin is found. Paler skin tones are found in higher-latitude populations such as those who have lived in areas like Europe, Siberia, and Alaska for millennia. Skin color is easily observable as a phenotypic trait exhibiting continuous variation.
A clinal distribution still derives from genetic inheritance; however, clines often correspond to some gradually changing environmental factor. Clinal patterns arise when selective pressures in one geographic area differ from those in another as well as when people procreate and pass on genes together with their most immediate neighbors. There are several mechanisms, selective and neutral, that can lead to the clinal distribution of an allele or a biological trait. Natural selection is the mechanism that produced a global cline of skin color, whereby darker skin color protects equatorial populations from high amounts of UV radiation; there is a transition of lessening pigmentation in individuals that reside further and further away from the tropics (Jablonski 2004; Jablonski and Chaplin 2000; see Figure 13.13). The ability and inability to digest lactose (milk sugar) among different world communities varies according to differential practices and histories of milk and dairy-product consumption (Gerbault et al. 2011; Ingram et al. 2009). Where malaria seems to be most prevalent as a disease stressor on human populations, a clinal gradient of increasing sickle cell anemia experience toward these regions has been studied extensively by genetic anthropologists (Luzzatto 2012). Sometimes culturally defined mate selection based on some observable trait can lead to clinal variation between populations as well.
Figure 13.13: A global map of skin colors shows that dark skin pigmentation is more common in areas that receive more UV radiation (near the equator and in high altitude areas). Light skin is more common at northern and southern latitudes. It is worth bearing in mind, though, that these do not tell the full story of how human skin pigmentation varies worldwide. Each region will contain populations that exhibit a range of skin tones. In this way, this map is not perfect as an illustration of skin-color distribution. Credit: Mercator style projection map showing human skin color according to Biasutti 1940.png by Dark Tichondrias at English Wikipedia, modified (cropped) by Tuvalkin, is under a CC BY-SA 4.0 License.
Two neutral microevolutionary processes that may produce a cline in a human allele or trait are gene flow and genetic drift (see Chapter 4). The ways in which neutral processes can produce clinal distributions is seen clearly when looking at clinal maps for different blood groups in the human ABO blood group system (Figure 13.14). For instance, scientists have identified an East-to-West cline in the distribution of the blood type B allele across Eurasia. The frequency of B allele carriers decreases gradually westward when we compare the blood groups of East and Southeast Asian populations with those in Europe. This shows how populations residing nearer to one another are more likely to interbreed and share genetic material (i.e., undergo gene flow). We also see 90%‒100% of native South American individuals, as well as between 70%‒90% of Aboriginal Australian groups, carrying the O allele (Mourant, Kopeć, and Domaniewska-Sobczak 1976). These high frequencies are likely due to random genetic drift and founder effects, in which population sizes were severely reduced by the earliest O allele-carrying individuals migrating into those areas. Over time, the O blood type has remained predominant.
Genetic Variation Is Greater Within Group than Between Groups
Figure 13.15: Circles represent human genetic variation. Most variants are shared among individuals on all continents. There are more variants in Africa, some of which are not found in Europe or Asia. Credit: Human Genetic Variation original to Explorations: An Open Invitation to Biological Anthropology (2nd ed.) by Katie Nelson is under a CC BY-NC 4.0 License.
One problem with race-based classifications is they relied on an erroneous idea that individuals with particular characteristics would share more similar genes with each other within a particular “race” and share less with individuals of other “races” possessing different traits and genetic makeups. However, since around 50 years ago, scientific studies have shown that the majority of human genetic differences worldwide exist within groups (or “races”) individually rather than between groups. Indeed, most genetic variation we see occurs in Africa, and many variants are shared among individuals on all continents (Figure 13.15).
In 2002, a landmark article by Noah Rosenberg and colleagues explored worldwide human genetic variation using an even-greater genetic data set. They used 377 highly variable markers in the human genome and sampled from 1,056 individuals representative of 52 populations. The markers chosen for study were not ones that code for any expressed genes. Because these regions of the human genome were made of unexpressed genes, we may understand these markers as neutrally derived (as opposed to selectively derived) because they do not code for functional advantages or disadvantages. These neutral genetic markers likely reflect an intricate combination of regional founder effects and population histories. Analyses of these neutral markers allowed scientists to identify that 93%‒95% of global genetic differences, referred to as variance, can be accounted for by within-population differences, while only a small proportion of genetic variance (3%‒5%) can be attributed to differences among major groups (Rosenberg et al. 2002). This research supports the theory that distinct biological races do not exist, even though misguided concepts of race may still have real social and political consequences.
Biological Data Fit Isolation-By-Distance and Out-of-Africa Models
One further note is that the world’s population may be genetically divided into “groups,” “subsets,” “clumps,” or “clusters” that reflect some degree of genetic similarity. These identifiable clusters reflect genetic or geographic distances—either with gene flow facilitated by proximity between populations or impeded by obstacles like oceans or environmentally challenging habitats (Rosenberg et al. 2005). Sometimes, inferred clusters using multiple genetic loci are interpreted by nongeneticists literally as “ancestral populations.” However, it would be wrong to assume from these genetic results that highly differentiated and “pure” ancestral groups ever existed. These groupings reflect differences that have arisen over time due to clinal patterning, genetic drift, and/or restricted or unrestricted gene flow (Weiss and Long 2009). The clusters identified by scientists are arbitrary and the parameters used to split up the global population into groups is subjective and dependent on the particular questions or distinctions being brought into focus (Relethford 2009).
Additionally, research on worldwide genetic variation has shown that human variation decreases with increasing distance from sub-Saharan Africa, where there is evidence for this vast region being the geographical origin of anatomically modern humans (Liu et al. 2006; Prugnolle, Manica, and Balloux 2005; see Figures 13.16 and 13.17). Genetic differentiation decreases in human groups the further you sample data from relative to sub-Saharan Africa because of serial founder effects (Relethford 2004). Over the course of human colonization of the rest of the world outside Africa, populations broke away in expanding waves across continents into western Asia, then Europe and eastern Asia, followed by Oceania and the Americas. As a result, founder events occurred whereby genetic variation was lost, as the colonization of each new geographical region involved a smaller number of individuals moving from the original larger population to establish a new one (Relethford 2004). The most genetic variation is found across populations residing in different parts of sub-Saharan Africa, while other current populations in places like northern Europe and the southern tip of South America exhibit some of the least genetic differentiation relative to all global populations (Campbell and Tishkoff 2008).
Figure 13.17: Comparison of the genetic distance and geographical distance between populations. In the top graph, the pattern reveals that genetic variation conforms to an Out-of-Africa model, as those populations further away from Addis Ababa in Ethiopia share a smaller number of alleles; in the bottom graph, we see the populations follow an isolation-by-distance model, as pairs of populations further apart geographically seem to have greater genetic distance (Kanitz et al. 2018). Credit: Complex genetic patterns (figure 1) by Kanitz et al. (2018) is under a CC BY 4.0 License.Figure 13.18: The founder effect is a change in a small population’s gene pool due to a limited number of individuals breaking away from a parent population. Credit: Bottleneck effect by Tsaneda is under a CC BY 3.0 License.
Besides fitting nicely into the Out-of-Africa model, worldwide human genetic variation conforms to an isolation-by-distance model, which predicts that genetic similarity between groups will decrease exponentially as the geographic distance between them increases (Kanitz et al. 2018). This is because of the greater and greater restrictions to gene flow presented by geographic distance, as well as cultural and linguistic differences that occur as a result of certain degrees of isolation. Since genetic data conform to isolation-by-distance and Out-of-Africa models, these findings support the abolishment of “race” groupings. This research demonstrates that human variation is continuous and cannot be differentiated into geographically discrete categories. There are no “inherent” or “innate” differences between human groups; instead, variation derives from some degree of natural selection, as well as neutral processes like population bottle-necking (Figure 13.18), random mutations in the DNA, genetic drift, and gene flow through between-mate interbreeding.
Humans Have Higher Homogeneity Compared to Many Other Species
An important fact to bear in mind is that humans are 99.9% identical to one another. This means that the apportionments of human variation discussed above only concern that tiny 0.1% of difference that exists between all humans globally. Compared to other mammalian species, including the other great apes, human variation is remarkably lower. This may be surprising given that the worldwide human population has already exceeded seven billion, and, at least on the surface level, we appear to be quite phenotypically diverse. Molecular approaches to human and primate genetics tells us that external differences are merely superficial. For a proper appreciation of human variation, we have to look at our closest relatives in the primate order and mammalian class. Compared to chimpanzees, bonobos, gorillas and other primates, humans have remarkably low average genome-wide heterogeneity (Osada 2005).
When we look at chimpanzee genetic variation, it is fascinating that western, central, eastern, and Cameroonian chimpanzee groups have substantially more genetic variation between them than large global samples of human DNA (Bowden et al. 2012; Figure 13.19). This is surprising given that all of these chimpanzee groups live relatively near one another in Africa, while measurements of human genetic variation have been conducted using samples from entirely different continents. First, geneticists suppose that this could reflect differential experiences of the founder effect between humans and chimpanzees. Because all non-African human populations descended from a small number of anatomically modern humans who left Africa, it would be expected that all groups descended from that smaller ancestral group would be similar genetically. Second, our species is really young, given that we have only existed on the planet for around 150,000 to 300,000 years. This gave humans little time for random genetic mutations to occur as genes get passed down through genetic interbreeding and meiosis. Chimpanzees, however, have inhabited different ecological niches, and less interbreeding has occurred between the four chimpanzee groups over the past six to eight million years compared to the amount of gene flow that occurred between worldwide human populations (Bowden et al. 2012).
Recent advances have now enabled the attainment of genetic samples from the larger family of great apes and the evaluation of genetic variation among bonobos, orangutans, and gorillas alongside that of chimpanzees and humans (Prado-Martinez et al. 2013). Collecting such data and analyzing primate genetic variation has been important not only to elucidate how different ecological, demographic, and climatic factors have shaped our evolution but also to inform upon conservation efforts and medical research. Genes that may code for genetic susceptibilities to tropical diseases that affect multiple primates can be studied through genome-wide methods. Species differences in the genomes associated with speech, behavior, and cognition could tell us more about how human individuals may be affected by genetically derived neurological or speech-related disorders and conditions (Prado-Martinez et al. 2013; Staes et al. 2017). In 2018, a great ape genomic study also reported genetic differences between chimpanzees and humans related to brain cell divisions (Kronenberg et al. 2018). From these results, it may be inferred that cognitive or behavioral variation between humans and the great apes might relate to an increased number of cortical neurons being formed during human brain development (Kronenberg et al. 2018). Comparative studies of human and nonhuman great ape genetic variation highlight the complex interactions of population histories, environmental changes, and natural selection between and within species. When viewed in the context of overall great ape variation, we may reconsider how variable the human species is relatively and how unjustified previous “race” concepts really were.
Phenotypic Traits That Reflect Neutral Evolution
Depending on the trait being observed, different patterns of phenotypic variation may be found within and among groups worldwide. In this subsection, some phenotypic traits that reflect the aforementioned patterns of genetic variation will be discussed.
Figure 13.20: Contemporary anthropologists who use many types of skeletal markers have demonstrated that a majority of cranial variation occurs within populations rather than between populations and that there is a decrease in variation with distance from Africa. Credit: Dental Anthropologist Heart Necklace by Anthro Illustrated is under a CC BY-NC 4.0 License.
Looking beyond genetic variation briefly, recent studies have revisited biological anthropology’s earlier themes of externally observable traits, such as skull shape. In the last 20 or so years, anthropologists have evaluated the level to which human cranial shape variation reflects the results from genetic markers, such as those used previously to fit against Out-of-Africa models (Relethford 2004) or those used in the apportionment of human variation between and within groups (Lewontin 1972; Rosenberg et al. 2002). Using larger sample sizes of cranial data collected from thousands of skulls worldwide and a long list of cranial measurements, studies demonstrate a similar decrease in variation with distance from Africa and show that a majority of cranial variation occurs within populations rather than between populations (Betti et al. 2009; Betti et al. 2010; Manica et al. 2007; Relethford 2001; von Cramon-Taubadel and Lycett 2008; see Figure 13.20). The greatest cranial variation is found among skulls of sub-Saharan African origin, while the least variation is found among populations inhabiting places like Tierra del Fuego at the southern tip of Argentina and Chile. While ancient and historical thinkers previously thought “race” categories could reasonably be determined based on skull dimensions, modern-day analyses using more informative sets of cranial traits simply show that migrations out of Africa and the relative distances between populations can explain a majority of worldwide cranial variation (Betti et al. 2009).
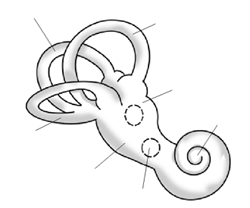
This same patterning in phenotypic variation has even been found in studies examining shape variation of the pelvis (Betti et al. 2013; Betti et al. 2014), the teeth (Rathmann et al. 2017), and the human bony labyrinth of the ear (Ponce de León et al. 2018;Figure 13.21). The skeletal morphology of these bones still varies worldwide, but a greater proportion of that variation can still be attributed to the ways in which human populations migrated across the world and exchanged genes with those closer to them rather than those further away. Human skeletal variation in these parts of the body is continuous and nondiscrete. Given the important functions of the cranium and these other skeletal parts, we may infer that the genes that underpin their development have been relatively conserved by neutral evolutionary processes such as genetic drift and gene flow. It is also important to note that while some traits such as height, weight, cranial dimensions, and body composition are determined, in part, by genes, the underlying developmental processes behind these traits are underpinned by complex polygenic mechanisms that have led to the continuous spectrum of variation in such variables among modern-day human populations.
Phenotypic Traits That Reflect Natural Selection
Even though 99.9% of our DNA is the same across all humans worldwide, and many traits reflect neutral processes, there are parts of that remaining 0.1% of the human genome that code for individual and regional differences. Similarly to craniometric analyses that have been conducted in recent decades, human variation in skin color has also been reassessed using new methods and in light of greater knowledge of biological evolution.
New technologies allow scientists to use color photometry to sample and quantify the visible wavelength of skin color, in a way 19th- and 20th-century readers could not. In one report, it was found that 87.9% of global skin color variation can be attributed to genetic differences between groups, 3.2% to those among local populations within regions, and 8.9% within local populations (Relethford 2002). This apportionment differs significantly and is the reverse situation found in the distribution of genetic differences we see when we examine genetic markers such as blood type–related alleles. However, this pattern of human skin color worldwide is not surprising, given that we now understand that past selection has occurred for darker skin near the equator and lighter skin at higher latitudes (Jablonski 2004; Jablonski and Chaplin 2000). While most genetic variation reflects neutral variation due to population migrations, geographic isolation, and restricted gene flow dynamics, some human genetic/phenotypic variation is best explained as local adaptation to environmental conditions (i.e., selection). Given that skin color variation is atypical compared to other genetic markers and biological traits, this, in fact, goes against earlier “race” typologies. This is because recent studies ironically show how so much of genetic variation relates to neutral processes, while skin color does not. It follows that skin color cannot be viewed as useful in making inferences about other human traits.
Figure 13.22: Genomicists and biological anthropologists have dedicated efforts to improving quantitative methods of measuring hair and skin variation over the last twenty years. Dr. Nina Jablonski is one such biological anthropologist specializing in the evolution and variation of human skin pigmentation. Credit: Nina Jablonski 2016 The Skin of Homo sapiens 01 (cropped) by Ptolusque is under a CC BY-SA 4.0 license.
It is also true that some populations have not been studied extensively in skin pigmentation genetics (e.g., African, Austronesian, Melanesian, Southeast Asian, Indigenous American, and Pacific Islander populations, according to Lasisi and Shriver 2018). Earlier dispersals of these populations, and their local genetic varition, will have contributed to worldwide genetic variation, inclusive of skin pigmentation variation. Gene loci we did not previously appreciate as being linked to pigmentation are now being recognized thanks to better tools, more diverse genetic samples, and more accessible datasets (Quillen et al. 2018). Biological anthropologists look forward to further discoveries elucidating the different selective pressures and population dynamics that influence skin pigmentation evolution.
Social Implications
To finish this chapter, we will consider the social, economic, political, and biological implications of poor understandings of race and the deliberate perpetuation of social and medical racism.
The Black Lives Matter movement (BLM) of 2013 began with the work of racial justice activists and community organizers Alicia Garza, Opal Tometi, and Patrissa Cullors. First incited by the murder of Trayvon Martin, a 17-year-old African American, and the acquittal of the man who shot him, BLM went on to protest against the deaths of numerous Black individuals, most of whom were killed by police officers (for example, Ahmaud Arbery was killed in February of 2020 by two white non-police officers). Some key characteristics of BLM from the start were its decentralized grassroots structure, the role of university students and social media in spreading awareness of the movement, and its embrace of other movements (e.g., climate justice, ending police brutality, feminist campaigns, queer activism, immigration reform, etc.). When George Floyd was murdered by a white police officer on May 25, 2020, the BLM gained new momentum, across 2,000-plus cities in the United States, and among many protesting against historic racism and police brutality in other contexts around the globe. Many in the biological anthropology community have responded to these events with a great dedication to working against systemic racism in society and institutions (American Association of Biological Anthropologists 2020).
BLM continues to be an important movement, as is evidenced in the degree of community organizing, mutual aid efforts, calls for political reform, progress toward curriculum reform and equality, inclusion and diversity (EDI) work in businesses and universities, the removal of monuments honoring historical figures associated with slavery and racism, and many other important actions. Garza (2016) writes: “The reality is that race in the United States operates on a spectrum from black to white … the closer you are to white on that spectrum, the better off you are.” Tometi (2016) has stated: “We need [a human rights movement that challenges systemic racism] because the global reality is that Black people are subject to all sorts of disparities in most of our challenging issues of our day. I think about climate change, and how six of the ten worst impacted nations by climate change are actually on the continent of Africa.” In the words of Cullors (2016), “Black Lives Matter is our call to action. It is a tool to reimagine a world where Black people are free to exist, free to live. It is a tool for our allies to show up differently for us.” We gather from their words the importance of learning from the egregious role that anthropologists have played in the past, recognizing the legacies of “scientific” justifications for eugenics and racism in our society today, and proactively working toward environmental and social equity.
Another major industry that engages in the quantification and interpretation of human variation is medical and clinical work (National Research Council [U.S.] Committee on Human Genome Diversity 1997). Large-scale genomic studies sampling from human populations distributed worldwide have produced detailed knowledge on variation in disease resistance or susceptibility between and within populations. Let’s think about drug companies who develop medicines for Black patients particularly. The predispositions to particular diseases are higher among people of African descent than some pharmaceutical businesses have taken into account. Through targeted sampling of various world groups, clinical geneticists may also identify genetic risk factors of certain common disorders such as chronic heart disease, asthma, diabetes, autoimmune diseases, and behavioral disorders. Having an understanding of population-specific biology is crucial in the development of therapies, medicines, and vaccinations, as not all treatments may be suitable for every human, depending on their genotype. During diagnosis and treatment, it is important to have an evolutionary perspective on gene-environment relationships in patients. Typological concepts of “race” are not useful, given that most racial groups (whether self-identified or not) popularly recognized lack homogeneity and are, in fact, variable. Cystic fibrosis, for instance, occurs in all world populations but can often be underdiagnosed in populations with African ancestry because it is thought of as a “white” disease (Yudell et al. 2016).
Sociologists, law scholars, and professors of race studies have written extensively on how genetic/technological/medical revolutions impact people of color. In her book, Fatal Invention: How Science, Politics, and Big Business Re-create Race in the Twenty-First Century (2013), Professor Dorothy E. Roberts writes about how technological advances have been used in resuscitating race as a biological category for dividing humans in essentialist ways (Figure 13.23). She notes how members of law enforcement have engaged in racial profiling, sometimes with the use of machine-learning and facial-recognition technologies. Ancestry-testing services also purport to tell us “what” we are and to insist that this information is “written” in our genes. Such advertising campaigns obscure the nuances of genetic variation with the primary motive of tapping into people’s desire to “know themselves” and driving up profits for their businesses. Commercial genetic testing reinforces the idea that genes map neatly onto race, all while generating massive stores of data in DNA databases. In Roberts’s view, the myth of the biological concept of race being perpetuated in these ways undermines a just society and reproduces racial inequalities.
Figure 13.23: Professor Dorothy E. Roberts is a sociologist, legal scholar, and expert on the relationships among technology, medicine, bioethics, policymaking, race, and racism. Credit: Dorothy Roberts author of Fatal Invention by https://kpfa.org/ is copyrighted and used with permission.
The COVID-19 pandemic has had a significant impact on the world’s population, particularly people living in the economic Global South and many Black, Indigenous and communities of color residing in the Global North. We have witnessed disproportionately high numbers of COVID-related deaths and infection cases among marginalized groups. Many immigrants and ethnic minorities in various societies have also experienced scapegoating and blame directed at them for being the source of COVID-19 spread.
To inform us on how to interpret this current worldwide pandemic, historians and anthropologists are looking back at the lessons learned from past instances of racist medicine (discriminatory practices based on broader social discrimination) and medical racism (application of discriminatory practices justified on medical grounds). Historically, who could become doctors and medical professionals was often racialized, gendered, and class specific. This made it difficult for many to overcome prejudices against women, Black people, Indigenous individuals, or other people of color from becoming doctors and clinical researchers in places such as South Africa and the United States. This, in turn, affects the sorts of information we know about health levels and health outcomes among these very groups. In the past decade, long-overdue attention is finally being paid to how race affects biological outcomes. For instance, researchers have focused on the negative legacies of racial discrimination and racism-induced stress on hormone (im)balances, mental health disorders, cardiovascular disease prevalence, and other health outcomes (Kuzawa and Sweet 2009; Shonkoff, Slopen, and WIlliams 2021; Williams 2018). The technology and standards of protocol in medical testing have been scrutinized (for more on how pulse oximeters were not designed with nonwhite patients in mind, for example, see Sjoding et al. 2020). Scholars of race and medicine have also written on how illness and disease spread have often been used to perpetuate societal prejudices. This manifests as xenophobic tendencies at a societal level, such as the blaming of “outgroups” and increased “in-group” protectiveness. Overreliance on the idea that people are “inherently” disease carriers due to genetic or biological reasons leads to improper accounting for socioeconomic or infrastructural issues that lead to differential disease prevalence amongst minority communities. (For more on race and COVID, see Tsai 2021 as well as this textbook’s Chapter 16: Contemporary Topics: Human Biology and Health.)
Lastly, consider the changing field of forensic anthropology. In the past, forensic anthropologists ascribed ancestry or racial categories to sets of skeletons, reliant on the belief that different human groups will exhibit biologically “discrete” assortments so as to divide along culturally constructed categories (Sauer 1992). Now, a number of forensic anthropologists have argued that we should abandon these methods, both because it is unscientific and because it further validates and perpetuates this idea that race is biologically meaningful. As scientists, whether we affirm biological race as real has huge influence on the beliefs of members of the public, the judicolegal system, and law enforcement. Not all forensic experts agree with abandoning ancestry estimation. Some prefer to refocus on the neutral or selective causes of human biological variation, and assess how probabilistic it may be to assign bones of certain dimensions to one of several identified racial categories. These debates continue today as this textbook chapter is being written. More details on population affinity may be found in Chapter 15: Bioarchaeology and Forensic Anthropology.
It is important to remember that while it is possible to look for clues about one’s ancestry or geographic origin based on skull morphology, again, the amount of distinctiveness in any given sample makes it impossible to distinguish whether a cranium belongs to one group (Relethford 2009). Individuals can vary in their skeletal dimensions by continental origin, country origin, regional origin, sex, age, environmental factors, and the time period in which they lived, making it difficult to assign individuals to particular categories in a completely meaningful way (Ousley, Jantz, and Freid 2009). When forensic reports and scientific journal articles give an estimation of ancestry, it is crucial to keep in mind that responsible assignments of ancestry will be done through robust statistical testing and stated as a probability estimate. Today, we also live in a more globalized world where a skeletal individual may have been born originally to parents of two separate traditional racial categories. In contexts of great heterogeneity within populations, this definitely adds difficulty to the work of forensic scientists and anthropologists preparing results for the courtroom (genetic testing may be comparatively more helpful in such situations).
Did Deeper: Measuring FST
Richard Lewontin (1929‒) is a biologist and evolutionary geneticist who authored an article evaluating where the total genetic variation in humans lies. Titled “The Apportionment of Human Diversity” (Lewontin 1972), the article addressed the following question: On average, how genetically similar are two randomly chosen people from the same group when compared to two randomly chosen people from different groups?
Lewontin studied this problem by using genetic data. He obtained data for a large number of different human populations worldwide using 17 genetic markers (including alleles that code for various important enzymes and proteins, such as blood-group proteins). The statistical analysis he ran used a measure of human genetic differences in and among populations known as the fixation index (FST).
Technically, FST can be defined as the proportion of total genetic variance within a subpopulation relative to the total genetic variance from an entire population. Therefore, FST values range from 0 to 1 (or, sometimes you will see this stated as a percentage between 0% and 100%). The closer the FST value of a population (e.g., the world’s population) approaches 1, the higher the degree of genetic differentiation among subpopulations relative to the overall population (see Figure 13.24 for a detailed illustration).
Figure 13.24: This diagram shows a range of different case studies with which we may understand how FST is calculated in different populations. In Case 1, the gene pools of Populations 1 and 2 are 100% different from each other but possess 0% variation within themselves, so FST has a value of 1. When there is no genetic variation at all between two populations and 100% variation within them, as in Case 2, we see that FST is calculated as 0. When we look at Case 3, where variation between and within are some values between 0% and 100%, we will get a decimal figure for FST dependent upon how much variation there is between and within populations. It is through such comparisons of population genetic data that we may quantify the relative similarities or differences between and within populations, and we may thus speak to the nonexistence of “racial groups” that divide up our species into broad continental or racial categories. Credit: FST original to Explorations: An Open Invitation to Biological Anthropology (2nd ed.) by Katie Nelson is under a CC BY-NC 4.0 License.
In his article, Lewontin (1972) identified that most of human genetic differences (85.4%) were found within local subpopulations (e.g., the Germans or Easter Islanders), whereas 8.3% were found between populations within continental human groups, and 6.3% were attributable to traditional “race” groups (e.g., “Caucasian” or “Amerind”). These findings have been important for scientifically rejecting the existence of biological races (Long and Kittles 2003).