
3.6: Healthy Dietary Patterns During a Toddler’s Second Year of Life
- Page ID
- 139639
\( \newcommand{\vecs}[1]{\overset { \scriptstyle \rightharpoonup} {\mathbf{#1}} } \)
\( \newcommand{\vecd}[1]{\overset{-\!-\!\rightharpoonup}{\vphantom{a}\smash {#1}}} \)
\( \newcommand{\id}{\mathrm{id}}\) \( \newcommand{\Span}{\mathrm{span}}\)
( \newcommand{\kernel}{\mathrm{null}\,}\) \( \newcommand{\range}{\mathrm{range}\,}\)
\( \newcommand{\RealPart}{\mathrm{Re}}\) \( \newcommand{\ImaginaryPart}{\mathrm{Im}}\)
\( \newcommand{\Argument}{\mathrm{Arg}}\) \( \newcommand{\norm}[1]{\| #1 \|}\)
\( \newcommand{\inner}[2]{\langle #1, #2 \rangle}\)
\( \newcommand{\Span}{\mathrm{span}}\)
\( \newcommand{\id}{\mathrm{id}}\)
\( \newcommand{\Span}{\mathrm{span}}\)
\( \newcommand{\kernel}{\mathrm{null}\,}\)
\( \newcommand{\range}{\mathrm{range}\,}\)
\( \newcommand{\RealPart}{\mathrm{Re}}\)
\( \newcommand{\ImaginaryPart}{\mathrm{Im}}\)
\( \newcommand{\Argument}{\mathrm{Arg}}\)
\( \newcommand{\norm}[1]{\| #1 \|}\)
\( \newcommand{\inner}[2]{\langle #1, #2 \rangle}\)
\( \newcommand{\Span}{\mathrm{span}}\) \( \newcommand{\AA}{\unicode[.8,0]{x212B}}\)
\( \newcommand{\vectorA}[1]{\vec{#1}} % arrow\)
\( \newcommand{\vectorAt}[1]{\vec{\text{#1}}} % arrow\)
\( \newcommand{\vectorB}[1]{\overset { \scriptstyle \rightharpoonup} {\mathbf{#1}} } \)
\( \newcommand{\vectorC}[1]{\textbf{#1}} \)
\( \newcommand{\vectorD}[1]{\overrightarrow{#1}} \)
\( \newcommand{\vectorDt}[1]{\overrightarrow{\text{#1}}} \)
\( \newcommand{\vectE}[1]{\overset{-\!-\!\rightharpoonup}{\vphantom{a}\smash{\mathbf {#1}}}} \)
\( \newcommand{\vecs}[1]{\overset { \scriptstyle \rightharpoonup} {\mathbf{#1}} } \)
\( \newcommand{\vecd}[1]{\overset{-\!-\!\rightharpoonup}{\vphantom{a}\smash {#1}}} \)
\(\newcommand{\avec}{\mathbf a}\) \(\newcommand{\bvec}{\mathbf b}\) \(\newcommand{\cvec}{\mathbf c}\) \(\newcommand{\dvec}{\mathbf d}\) \(\newcommand{\dtil}{\widetilde{\mathbf d}}\) \(\newcommand{\evec}{\mathbf e}\) \(\newcommand{\fvec}{\mathbf f}\) \(\newcommand{\nvec}{\mathbf n}\) \(\newcommand{\pvec}{\mathbf p}\) \(\newcommand{\qvec}{\mathbf q}\) \(\newcommand{\svec}{\mathbf s}\) \(\newcommand{\tvec}{\mathbf t}\) \(\newcommand{\uvec}{\mathbf u}\) \(\newcommand{\vvec}{\mathbf v}\) \(\newcommand{\wvec}{\mathbf w}\) \(\newcommand{\xvec}{\mathbf x}\) \(\newcommand{\yvec}{\mathbf y}\) \(\newcommand{\zvec}{\mathbf z}\) \(\newcommand{\rvec}{\mathbf r}\) \(\newcommand{\mvec}{\mathbf m}\) \(\newcommand{\zerovec}{\mathbf 0}\) \(\newcommand{\onevec}{\mathbf 1}\) \(\newcommand{\real}{\mathbb R}\) \(\newcommand{\twovec}[2]{\left[\begin{array}{r}#1 \\ #2 \end{array}\right]}\) \(\newcommand{\ctwovec}[2]{\left[\begin{array}{c}#1 \\ #2 \end{array}\right]}\) \(\newcommand{\threevec}[3]{\left[\begin{array}{r}#1 \\ #2 \\ #3 \end{array}\right]}\) \(\newcommand{\cthreevec}[3]{\left[\begin{array}{c}#1 \\ #2 \\ #3 \end{array}\right]}\) \(\newcommand{\fourvec}[4]{\left[\begin{array}{r}#1 \\ #2 \\ #3 \\ #4 \end{array}\right]}\) \(\newcommand{\cfourvec}[4]{\left[\begin{array}{c}#1 \\ #2 \\ #3 \\ #4 \end{array}\right]}\) \(\newcommand{\fivevec}[5]{\left[\begin{array}{r}#1 \\ #2 \\ #3 \\ #4 \\ #5 \\ \end{array}\right]}\) \(\newcommand{\cfivevec}[5]{\left[\begin{array}{c}#1 \\ #2 \\ #3 \\ #4 \\ #5 \\ \end{array}\right]}\) \(\newcommand{\mattwo}[4]{\left[\begin{array}{rr}#1 \amp #2 \\ #3 \amp #4 \\ \end{array}\right]}\) \(\newcommand{\laspan}[1]{\text{Span}\{#1\}}\) \(\newcommand{\bcal}{\cal B}\) \(\newcommand{\ccal}{\cal C}\) \(\newcommand{\scal}{\cal S}\) \(\newcommand{\wcal}{\cal W}\) \(\newcommand{\ecal}{\cal E}\) \(\newcommand{\coords}[2]{\left\{#1\right\}_{#2}}\) \(\newcommand{\gray}[1]{\color{gray}{#1}}\) \(\newcommand{\lgray}[1]{\color{lightgray}{#1}}\) \(\newcommand{\rank}{\operatorname{rank}}\) \(\newcommand{\row}{\text{Row}}\) \(\newcommand{\col}{\text{Col}}\) \(\renewcommand{\row}{\text{Row}}\) \(\newcommand{\nul}{\text{Nul}}\) \(\newcommand{\var}{\text{Var}}\) \(\newcommand{\corr}{\text{corr}}\) \(\newcommand{\len}[1]{\left|#1\right|}\) \(\newcommand{\bbar}{\overline{\bvec}}\) \(\newcommand{\bhat}{\widehat{\bvec}}\) \(\newcommand{\bperp}{\bvec^\perp}\) \(\newcommand{\xhat}{\widehat{\xvec}}\) \(\newcommand{\vhat}{\widehat{\vvec}}\) \(\newcommand{\uhat}{\widehat{\uvec}}\) \(\newcommand{\what}{\widehat{\wvec}}\) \(\newcommand{\Sighat}{\widehat{\Sigma}}\) \(\newcommand{\lt}{<}\) \(\newcommand{\gt}{>}\) \(\newcommand{\amp}{&}\) \(\definecolor{fillinmathshade}{gray}{0.9}\)Dietary Patterns
In the second year of life, toddlers consume less breast milk, and infant formula is not recommended. Calories and nutrients should predominantly be met from a healthy dietary pattern of age-appropriate foods and beverages. [1]
The table below displays a healthy dietary pattern for toddlers ages 12 through 23 months who are no longer receiving breast milk or infant formula. The pattern is provided at calorie levels ranging from 700 to 1,000 calories per day, which are appropriate for most toddlers ages 12 through 23 months. A healthy dietary pattern includes a variety of nutrient-dense fruits, vegetables, grains, protein foods (including lean meats, poultry, eggs, seafood, nuts, and seeds), dairy (including milk, yogurt, and cheese), and oils.
Vegetable Subgroups in Weekly Amounts
|
CALORIE LEVEL OF PATTERN a |
700 |
800 |
900 |
1,000 |
|
Vegetables: Total (cup eq/day) |
⅔ |
¾ |
1 |
1 |
|
Dark-Green Vegetables (cup eq/wk) |
1 |
⅓ |
½ |
½ |
|
Red and Orange Vegetables (cup eq/wk) |
1 |
1 ¾ |
2 ½ |
2 ½ |
|
Beans, Peas, Lentils (cup eq/wk) |
¾ |
⅓ |
½ |
½ |
|
Starchy Vegetables (cup eq/wk) |
1 |
1 ½ |
2 |
2 |
|
Other Vegetables (cup eq/wk) |
¾ |
1 ¼ |
1 ½ |
1 ½ |
|
Fruits (cup eq/day) |
½ |
¾ |
1 |
1 |
|
Grains (ounce eq/day) |
1 ¾ |
2 ¼ |
2 ½ |
3 |
|
Whole Grains (ounce eq/day) |
1 ½ |
2 |
2 |
2 |
|
Refined Grains (ounce eq/day) |
¼ |
¼ |
½ |
1 |
|
Dairy (cup eq/day) |
1 ⅔ |
1 ¾ |
2 |
2 |
|
Protein Foods (ounce eq/day) |
2 |
2 |
2 |
2 |
Protein Foods Subgroups in Weekly Amounts
|
CALORIE LEVEL OF PATTERN a |
700 |
800 |
900 |
1,000 |
|
Meats, Poultry (ounce eq/wk) |
8 ¾ |
7 |
7 |
7 ¾ |
|
Eggs (ounce eq/wk) |
2 |
2 ¾ |
2 ¼ |
2 ¼ |
|
Seafood (ounce eq/wk)e |
2-3 |
2-3 |
2-3 |
2-3 |
|
Nuts, Seeds, Soy Products (ounce eq/wk) |
1 |
1 |
1 ¼ |
1 ¼ |
|
Oils (grams/day) |
9 |
9 |
8 |
13 |
After food group and subgroup recommendations are met, a small number of calories are allocated to oils. The recommendation to limit saturated fat to less than 10 percent of calories per day does not apply to those younger than age 2, and the inclusion of higher fat versions of dairy is a notable difference in the pattern for toddlers ages 12 through 23 months compared to patterns for ages 2 and older. However, no calories remain in the pattern for additional saturated fat or for added sugars. This dietary pattern requires careful choices of foods and beverages but does not require inclusion of fortified products specifically formulated for infants or toddlers to meet nutrient recommendations. [1]
Based on the FDA’s and EPA’s joint “Advice About Eating Fish,” young children should eat seafood lowest in methylmercury, and certain species of seafood should be avoided. If consuming up to 2 ounces of seafood per week, children should only be fed cooked varieties from the “Best Choices” listed in Figure \(\PageIndex{1}\). If consuming up to 3 ounces of seafood per week, children should only be fed cooked varieties from the “Best Choices” list that contain even lower methylmercury: flatfish (e.g., flounder), salmon, tilapia, shrimp, catfish, crab, trout, haddock, oysters, sardines, squid, pollock, anchovies, crawfish, mullet, scallops, whiting, clams, shad, and Atlantic mackerel. If consuming up to 3 ounces of seafood per week, many commonly consumed varieties of seafood should be avoided because they cannot be consumed at 3 ounces per week by children without the potential of exceeding safe methylmercury limits; examples that should not be consumed include: canned light tuna or white (albacore) tuna, cod, perch, black sea bass. [1]
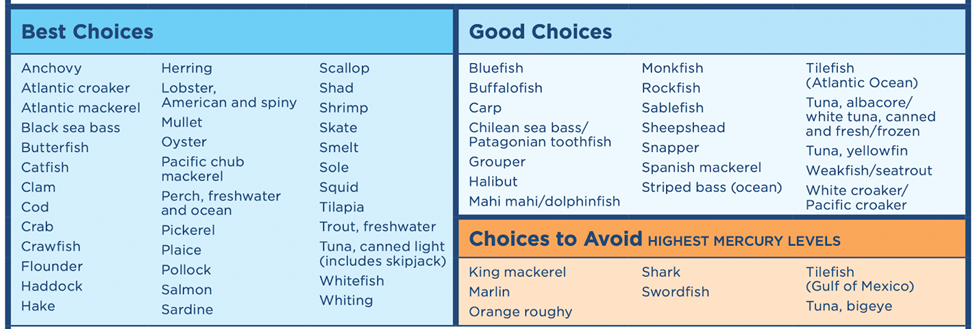
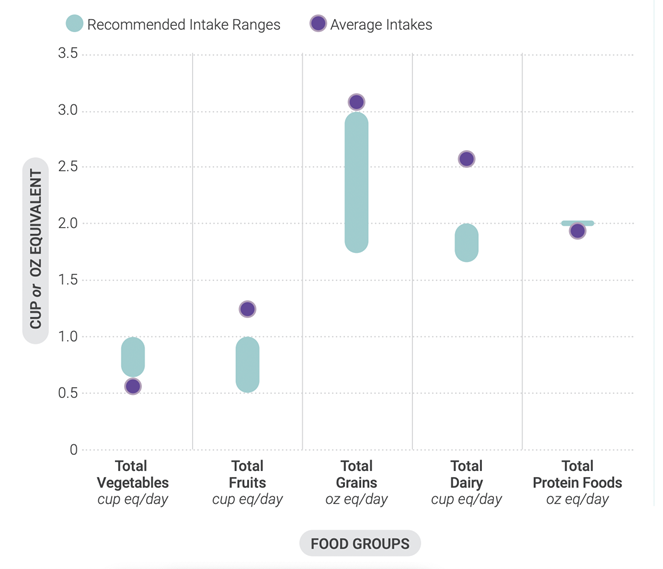
Figure \(\PageIndex{2}\) displays the dietary intakes of toddlers during the second year of life, in other words, what toddlers are actually eating. Average intakes of the food groups are compared to the range of recommended intakes. Average intakes of dairy foods, most of which is consumed as milk, generally exceeds recommended amounts in toddlers. In fact, the difference between the diary recommendation and the actual intake is the greatest of all the food groups. Intakes of yogurt and cheese account for about 10% of dairy intakes. Plant-based beverages and flavored milks each make up about 2% of dairy intakes among toddlers. Approximately 60% of toddlers meet or exceed recommended intakes for fruit. A majority of fruit is consumed as whole fruit (fresh, canned, puréed, frozen) or as 100% fruit juice. Average intake of total vegetables is below the range of recommended amounts, with nearly 90% of toddlers falling short of recommendations. About one-half of vegetables are consumed on their own, one-quarter are consumed as part of a mixed dish, and nearly 5 percent are consumed as savory snacks (e.g., potato chips). [1]
While the average overall intake of total vegetables is below the range of recommended amounts, consumption of specific types of vegetables is lower than others. Figure \(\PageIndex{3}\) shows the average intake of different types of vegetables (dark green, red and orange, beans, peas and lentils, starchy and other) compared to the recommended range. Of all the types of vegetables, the difference between the recommended range for dark green vegetables and the actual intake is the greatest of all the food groups. Toddlers should be eating more dark green vegetables. For all of the other types of vegetables, average intake falls toward the lower end of what is recommended. For example, while the average intake of red and orange vegetables is between 1 to 1.5 cups each week, the recommended intake range is between 1 to 2.5 cups each week.
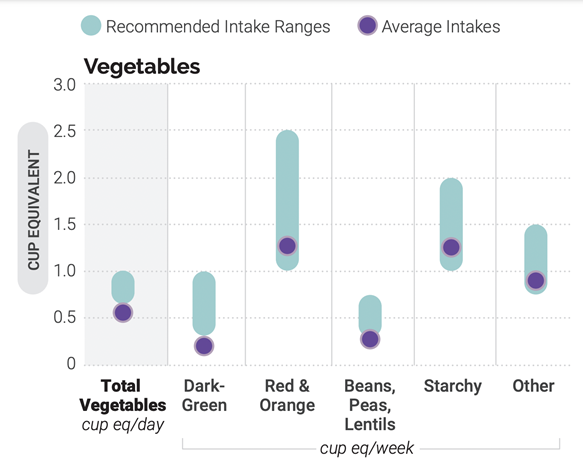
Figure \(\PageIndex{4}\) shows the average intake of grains compared to recommended intake ranges: ages 12 through 23 months. Total grains, particularly refined grains, are consumed in amounts that exceed recommendations. Conversely, intakes of whole grains fall short of recommended amounts for more than 95% of toddlers. A majority of grains are consumed through breads, rolls, tortillas, or other bread products or as part of a mixed dish. Ten percent of grains come from sweet bakery products and approximately 15 percent come from crackers and savory snacks. Many of these categories are top sources of sodium or added sugars in this age group. [1]
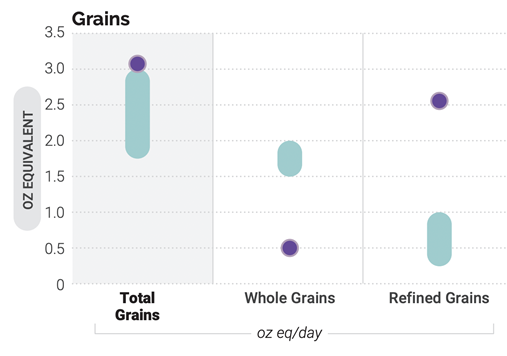
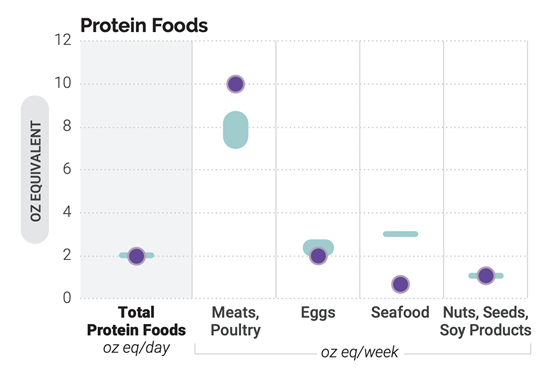
Figure \(\PageIndex{5}\) shows the average intake of protein compared to recommended intake ranges for toddlers between 12 through 23 months. Protein food intake falls within the recommended range, on average. Intakes of meats, poultry, and eggs make up the majority of protein food intake, however seafood intake in toddlers is low. Children in this age group can reduce sodium intake by eating less cured or processed meats including hot dogs, deli meats, and sausages. [1]
[1] “Dietary Guidelines for Americans, 2020-2025” by U.S. Department of Agriculture and U.S. Department of Health and Human Services is in the public domain.
[2] Image from “Dietary Guidelines for Americans, 2020-2025” by U.S. Department of Agriculture and U.S. Department of Health and Human Services is in the public domain.
[3] “Advice about eating fish” from the FDA is in the public domain.
[4] Image from “Dietary Guidelines for Americans, 2020-2025” by U.S. Department of Agriculture and U.S. Department of Health and Human Services is in the public domain.