
4.2: Brain Development- Volume Growth
- Page ID
- 139777
Volume Growth
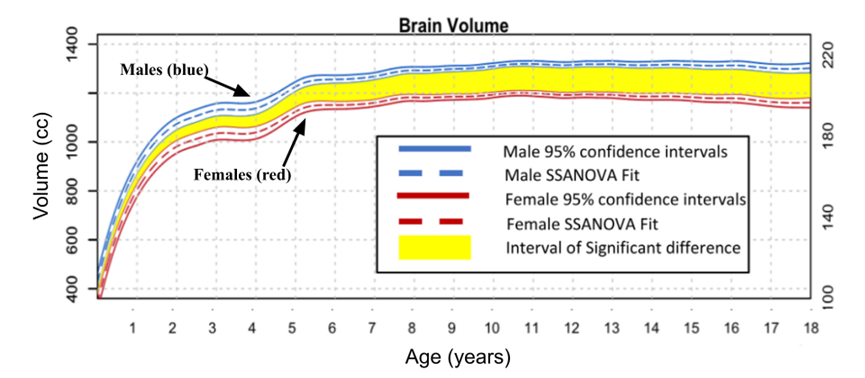
The brain begins developing a few weeks after conception and continues developing throughout the time in the womb. Once a baby is born, the major structures of the brain are formed and ready for the many new experiences of infancy. The explosive growth and function of the brain in infancy is unparalleled by any other postnatal developmental period. After birth, the brain continues to grow at a remarkable pace with its total volume doubled in the first year, followed by another 15% increase during the second year (Knickmeyer et al., 2008). The brain quadruples in size during the preschool period, reaching approximately 90% of adult volume by age 6 (Courchesne et al. 2000; Iwasaki et al. 1997; Kennedy et al. 2002; Lenroot & Giedd 2006; Paus et al. 2001; Reiss et al. 1996). Figure \(\PageIndex{1}\) shows the growth trajectory for brain volume from 0 to 18 years of age. The blue lines represent the growth for males and the red lines represent the growth for females. The yellow segment highlights the significant difference of growth between the two sexes. Notice how steep the trajectory rises in the first three years--representing this explosive brain growth! [1] [2]
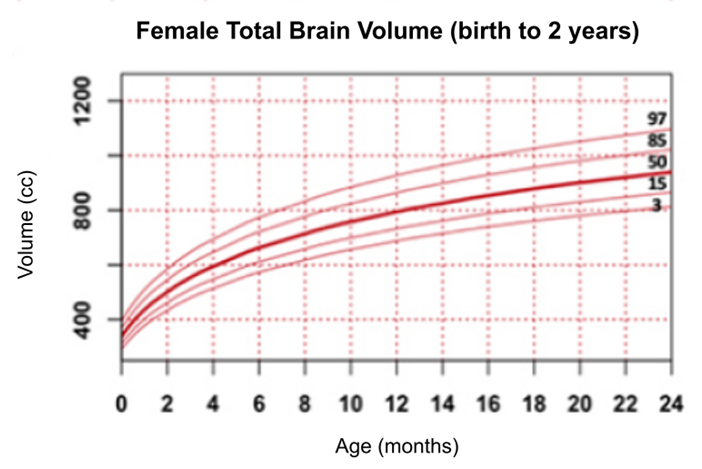
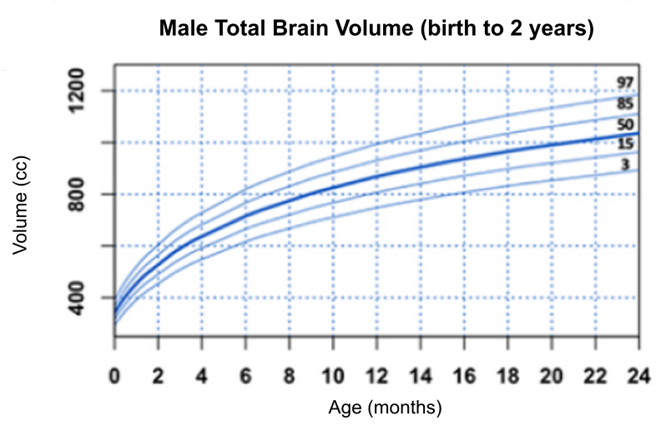
Let’s now zoom in and focus on the month-by-month brain growth during just the first two years. Figure \(\PageIndex{2}\) and Figure \(\PageIndex{3}\) chart the normative growth in brain volume for female and male children, respectively, between 0 to 24 months of age. Just as there are normative growth charts for infant and toddler height, weight and head circumference, Peterson et al., (2021) have published the first ever normative percentile curves for brain volume growth during childhood, with special attention towards infancy and toddlerhood. Each chart displays the 3rd, 15th, 50th, 85th, and 97th percentiles of normal brain volume growth during the first two years. Percentile curves allow a child to be compared to other children of the same sex and age, determining whether a child measures below or above the average. In these charts for example, if a child measures at the 50th percentile, this suggests that, at any specific age, 50% of the children will have larger brain volumes and 50% will have smaller brain volumes. If a child’s brain volume is in the 15th percentile, this means 15% of children have smaller brain volumes and 85% have larger brain volumes than this child.
Compare and contrast Figure \(\PageIndex{2}\) and Figure \(\PageIndex{3}\). What stands out to you? What do you notice is similar or different between the two charts? Notice the steady increase in brain volume each month, with the largest increases in the earlier months, primarily during the first twelve months. Comparing the two charts, males have a larger brain volume than females, a difference that appears early in infancy. Also, the percentile curves highlight the fact that there are early appearing individual differences in brain volume between children of the same sex, already by the first few months of life. In other words, by two months of age, some infants are at, below or above the 50th percentile. Brain volume during infancy and toddlerhood does not predict cognitive ability during these ages; however, sex and age-normalized brain volume for children between 6-18 years of age is related to cognitive performance (Peterson et al., 2021).
[1] Gao et al., (2017). Functional connectivity of the infant human brain: Plastic and modifiable. The Neuroscientist, 23(2), 169-184. CC by NC 3.0
[2] Stiles & Jernigan (2010). The basics of brain development. Neuropsychology Review, 20(4), 327-348. CC by 2.0
[3] Image adapted from Peterson et al., (2021). Normal childhood brain growth and a universal sex and anthropomorphic relationship to cerebrospinal fluid. Journal of Neurosurgery: Pediatrics. Used with permission.
[4] Image adapted from Peterson et al., (2021). Normal childhood brain growth and a universal sex and anthropomorphic relationship to cerebrospinal fluid. Journal of Neurosurgery: Pediatrics. Used with permission.
[5] Image adapted from Peterson et al., (2021). Normal childhood brain growth and a universal sex and anthropomorphic relationship to cerebrospinal fluid. Journal of Neurosurgery: Pediatrics. Used with permission.