Social Sci LibreTexts

18.4: General Equilibrium Monopoly

  • Page ID
    58537
  • \( \newcommand{\vecs}[1]{\overset { \scriptstyle \rightharpoonup} {\mathbf{#1}} } \) \( \newcommand{\vecd}[1]{\overset{-\!-\!\rightharpoonup}{\vphantom{a}\smash {#1}}} \)\(\newcommand{\id}{\mathrm{id}}\) \( \newcommand{\Span}{\mathrm{span}}\) \( \newcommand{\kernel}{\mathrm{null}\,}\) \( \newcommand{\range}{\mathrm{range}\,}\) \( \newcommand{\RealPart}{\mathrm{Re}}\) \( \newcommand{\ImaginaryPart}{\mathrm{Im}}\) \( \newcommand{\Argument}{\mathrm{Arg}}\) \( \newcommand{\norm}[1]{\| #1 \|}\) \( \newcommand{\inner}[2]{\langle #1, #2 \rangle}\) \( \newcommand{\Span}{\mathrm{span}}\) \(\newcommand{\id}{\mathrm{id}}\) \( \newcommand{\Span}{\mathrm{span}}\) \( \newcommand{\kernel}{\mathrm{null}\,}\) \( \newcommand{\range}{\mathrm{range}\,}\) \( \newcommand{\RealPart}{\mathrm{Re}}\) \( \newcommand{\ImaginaryPart}{\mathrm{Im}}\) \( \newcommand{\Argument}{\mathrm{Arg}}\) \( \newcommand{\norm}[1]{\| #1 \|}\) \( \newcommand{\inner}[2]{\langle #1, #2 \rangle}\) \( \newcommand{\Span}{\mathrm{span}}\)\(\newcommand{\AA}{\unicode[.8,0]{x212B}}\)

    Partial equilibrium analysis tells us that monopoly causes an inefficient allocation of resourcestoo little output (compared with the socially optimal level) is produced.

    This section explores the welfare implications of monopoly in a general equilibrium setting. The procedure is the same as the one used for judging competitive markets: We determine the monopoly allocation and then test it by comparing it to the set of Pareto Optimal points (i.e., the contract curve).

    To reiterate, monopoly results in an inefficient allocation of resources. There is no dispute about that. However, General Equilibrium Theory is the best way to demonstrate this inefficiency.

    Monopoly in an Edgeworth Box

    Suppose we start with the usual Edgeworth Box. It has an initial endowment that is the point of departure for trade between the two consumers.

    Competitive markets are modeled in an Edgeworth Box by supposing that prices are determined by the interaction of many buyers and sellers. To implement price-taking behavior in a two-person Edgeworth Box, we use an auctioneer who calls out prices. Each consumer determines optimal amounts to buy and sell based on the given prices. The Edgeworth Box is used to check whether the amounts that each consumer wants to buy and sell are compatible. If not, prices adjust based on the shortages and surpluses generated by the plans of each consumer.

    We model monopoly in a pure exchange Edgeworth Box by eliminating the auctioneer. We give one of the consumers monopoly power. They can set the price vector to have any slope.

    Suppose that A is a monopolist. What does this mean in the context of the Edgeworth Box? A will quote prices to B and let B decide how much to buy and sell. A will choose a price ratio and this determines the final allocation.

    We can think of A as an auctioneer who first shouts out prices to see how B will respond, then picks the best pricesfrom A’s point of view.

    STEP Open the Excel workbook EdgeworthBoxMonopoly.xls, read the Intro sheet, then go to the PriceOfferCurveB sheet.

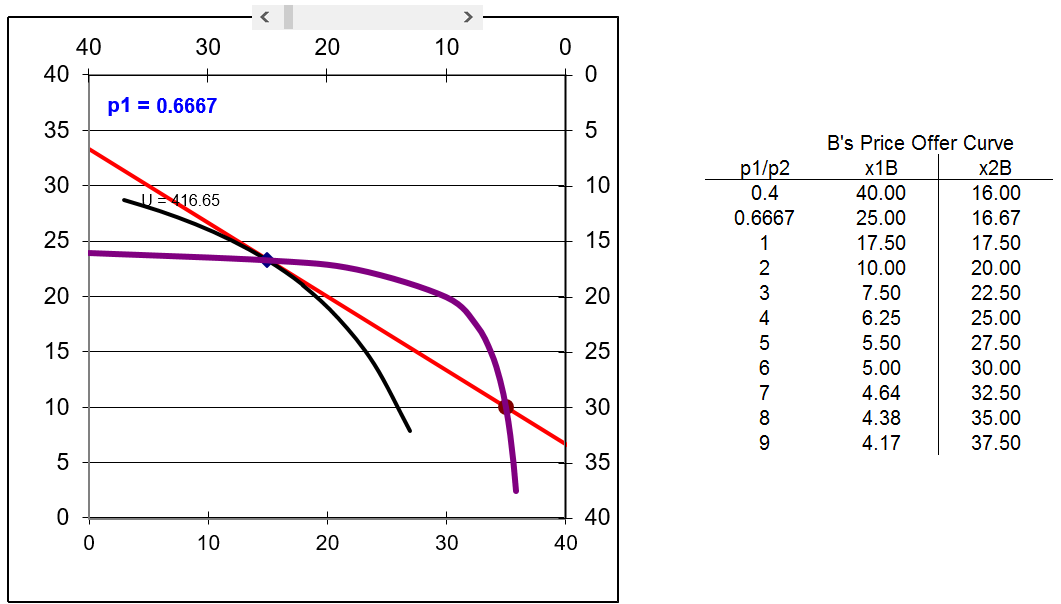
    Figure 18.11 (and your screen) shows B’s price offer curve, which tells A how much \(x_1\) and \(x_2\) B wishes to hold given the price ratio, \(\frac{p_1}{p_2}\).

    Initially, A has set \(p_1 = 0.6667\) (\(p_2\) is the numeraire). B maximizes utility, given that price ratio, by choosing the combination 25,16.67. This is shown by the black indifference curve that is tangent to the red price vector. B will want to buy 20 units of good 1 and offer (hence the name offer curve) 13.33 units of good 2 for sale to A.

    A can set any price for good 1 she wishes, but B gets to decide how much to buy and sell at A’s chosen price. Also, we assume A will honor the deal and buy the amount B wants to sell.

    STEP Click the scroll bar above the graph a few times to change the price of good 1.

    With each click, the red budget constraint line rotates about the initial endowment and B chooses a new optimal bundle.

    The locus of points that B chooses as \(p_1\) is varied, ceteris paribus, is the price offer curve. For any given price, B finds the place at which the highest indifference curve is tangent to the budget constraintand this point is on the price offer curve.

    Having explained B’s price offer curve, we bring A into the picture. A knows B’s price offer curve and has the monopoly power to set any price for \(x_1\). Given \(p_2 = 1\), A has the power to set the slope of the price vector. The key question is: Which price will A choose?

    In one sense, the answer is obvious: Choose \(p_1\) that maximizes satisfaction for A. But how can this problem be solved so we find the best price from A’s point of view?

    STEP Proceed to the EdgeworthBox sheet.

    The display is the same as on the PriceOfferCurveB sheet, except that now we have added A’s indifference curves. We also can easily see A’s utility in cell C28.

    Is the initial price of 0.6667 the best solution for A? No, because by increasing \(p_1\), A gets greater satisfaction.

    STEP Confirm that this is true by clicking on the scroll bar to increase \(p_1\) and keeping your eye on A’s utility in cell C28.

    You can also control the price with the scroll bar over cells A9 and B9. Notice how the price has been moved under the heading of Endogenous Variables. Because A chooses the pricethis is what monopoly power meansprice is endogenous to the monopolist.

    In the Wealth of Nations, Adam Smith says, "The price of monopoly is upon every occasion the highest which can be got" (Book I, Chapter VII, www.econlib.org/library/Smith/smWN.html?chapter_num=10#book-reader). But is this true? Would the monopolist literally charge the highest price possible?

    STEP Drag the scroll box in the scroll bar all the way to the right.

    The chart is hard to read, but we can see from the table next to the chart that with \(p_1=9\) (the highest price we can set with the scroll bar), B wants to end up with 4.17 units of \(x_1\) and 37.5 units of \(x_2\). This means \(p_1\) is so high that B does not want to buy any of it and, in fact, wants to sell 0.83 units to A!

    More importantly, a quick glance at cell C28 reveals that A’s utility is under 90. This means that, taken literally, a monopolist will not charge the highest price possible.

    Just like a monopoly in a partial equilibrium setting, A is operating under a constraint. A monopolist takes the demand curve as given. Consumer A takes B’s offer curve as given and B’s offer curve acts as constraint for A.

    With this knowledge, can you solve A’s problem? What is A’s optimal \(p_1\)?

    STEP Use the scroll bar to manipulate \(p_1\). Keep an eye on A’s utility. Can you find the value of \(p_1\) that maximizes A’s utility?

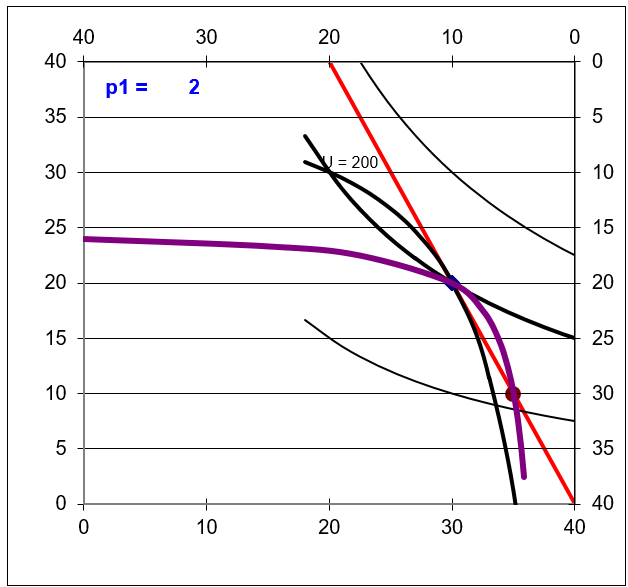
    You cannot beat \(p_1 = 2\). This is the optimal solution. This is what A will charge B for \(x_1\). At this price for good 1, B wants to have 10 and 20 units of goods 1 and 2. B will buy 5 units of \(x_1\) (adding this to the initial endowment of 5 units) financed from the sale 10 units of \(x_2\). A ends up with 30 and 20 units of goods 1 and 2. A sells 5 of her initial endowment of 35 units of \(x_1\) for $2/unit and buys 10 units of good 2. The plans match and we are at a stable position.

    You can also find this answer with Solver.

    STEP Click the scroll bar so \(p_1\) is not equal to 2 and run Solver.

    Notice that the changing cell is B9, which is the cell connected to the scroll bar. Solver does not need a constraint because the sheet is set up so that B optimizes based on \(p_1\) and then A’s \(x_1\) and \(x_2\) are the total units available for each good minus B’s optimal decision. Thus, B’s offer curve has been included in A’s optimization problem.

    In addition, you could use analytical methods, using A’s utility as the objective function and B’s offer curve as the constraint. All of these methods give the same answerA’s utility maximizing \(p_1\) is 2.

    The monopoly solution is displayed in Figure 18.12. Notice that A’s indifference curve is tangent to B’s offer curve. This is how a monopolist maximizes utility.

    Judging Monopoly

    What can we say about the monopoly allocation? With Pareto’s criteria we can instantly proclaim: Monopoly is not Pareto Optimal.

    Figure 18.12 shows that the monopoly allocation is at a point (from A’s view it is coordinate 30,20) where the \(MRS_A \neq MRS_B\) because the indifference curves intersect. This means that there are Pareto Superior points to the monopoly allocation. It also means that the monopoly allocation is not on the contract curve.

    By moving northwest, into the lens created by the two indifference curves at the monopoly solution, an omniscient, omnipotent social planner could make both A and B better off.

    Why doesn’t A do this? Because all A can do is set the price of good 1 and with this monopoly power, she must charge the same price for all the units sold. This leads to the allocation in Figure 18.12.

    If A could perfectly price discriminate, charging different prices for different units, we would get a different result. A could sell the first unit of \(x_1\) at a high price and decrease the price as B purchased more units. As explained in the chapter on monopoly in a partial equilibrium setting, this is called perfect price discrimination. The Q&A sheet asks you to work out the welfare implications of this type of monopoly in a general equilibrium analysis. The welfare results for perfect price discrimination in partial and general equilibrium are the same.

    Unlike partial equilibrium, we report no deadweight loss measure in this pure exchange, general equilibrium analysis. We simply note that the monopoly allocation is not Pareto Optimal and this is enough to doom monopoly because we know there are Pareto Superior allocations to the monopoly result.

    We cannot say how much damage the inefficiency of monopoly causes because utility can only be measured ordinally. We cannot express, in utils or dollars, the wasted value from monopoly, but we know it is there. Once we say that there are Pareto Superior points, we stamp monopoly as a poor allocation mechanism.

    Monopoly is not Pareto Optimal

    We found, as we did with partial equilibrium analysis, that monopoly is inefficient. This time, however, we used a general equilibrium analysis that adhered to the strict limitations imposed by ordinal utility. Thus, this analysis is theoretically sound.

    In a pure exchange Edgeworth Box, if one agent is granted monopoly power, he or she will choose a price to maximize his or her utility. This does not generate a Pareto Optimal allocation. The monopolist is not interested in Pareto optimalityshe simply wants to maximize her own utility.

    Recall, however, that this is simply a pure exchange economy. A true general equilibrium model must include production of goods and services and then combine production and exchange. This is beyond the scope of this book. The monopoly result stays the same; however, it still fails to yield a Pareto Optimal allocation.

    Exercises

    1. Is the monopoly solution better than the initial endowment? Explain.

      Hint: Use Figure 18.12 as a reference.

    2. Suppose A really liked \(x_1\), so that cA (cell B21) was 2. How would this change A’s utility maximizing price of \(x_1\)? What is the monopoly solution? Describe your procedure.
    3. In the previous chapter, we used a supply and demand (partial equilibrium) analysis to show that price ceilings in a competitive market cause an inefficient allocation of resources. Use Word’s Drawing Tools to create an Edgeworth Box with a price ceiling on \(x_1\). Explain why price ceilings are undesirable in this general equilibrium setting.

    References

    The epigraph is from page 94 of Gerard Debreu’s Theory of Value: An Axiomatic Analysis of Economic Equilibrium (originally published in 1959). Debreu won the Nobel Prize in Economics in 1983 “for having incorporated new analytical methods into economic theory and for his rigorous reformulation of the theory of general equilibrium” (www.nobelprize.org/prizes/economic-sciences/1983/summary).

    The Nobel Prize web site explains Debreu’s contribution in more detail, of course, but for the real scoop, consider this excerpt from E. Roy Weintraub’s How Economics Became a Mathematical Science (published in 2002):

    While it was the case that most economists would have been unfamiliar at that time with the novel tools of set theory, fixed point theorems, and partial preorderings, there was something else that would have taken them by surprise: a certain take-no-prisoners attitude when it came to specifying the “economic” content of the exercise. Although there had been quantum leaps of mathematical sophistication before in the history of economics, there had never been anything like this (p. 114).

    Weintraub reports that he had better luck interviewing Debreu than did George Feiwel, who prefaced many of his questions with, “For the benefit of the uneducated.” When Feiwel asked why existence of an equilibrium solution is so important, “Debreu shot back, ‘Since I have not seen your question discussed in the terms I would like to use, I will not give you a concise answer’” (Weintraub, p. 113). In addition to providing an entire transcript of the interview, Weintraub explains how Debreu led a wave of mathematical formalism into economics in the 1950s.

    The general equilibrium ideas you have encountered in this book are a mathematical step below the more formal, axiomatic exposition of General Equilibrium Theory developed in the 1950s and used in graduate economics courses. Pick up Debreu’s Theory of Value or a modern, PhD-level Micro Theory text (such as David M. Kreps, A Course in Microeconomic Theory, 1990) to see exactly what a formal, axiomatic exposition of general equilibrium entails.


    This page titled 18.4: General Equilibrium Monopoly is shared under a CC BY-SA 4.0 license and was authored, remixed, and/or curated by Humberto Barreto.

    • Was this article helpful?