The consumer and producer surplus concepts we have developed are extremely powerful tools of analysis, but the world is not always quite as straightforward as simple models indicate. For example, many suppliers generate pollutants that adversely affect the health of the population, or damage the environment, or both. The term externality is used to denote such impacts. Externalities impact individuals who are not participants in the market in question, and the effects of the externalities may not be captured in the market price. For example, electricity-generating plants that use coal reduce air quality, which, in turn, adversely impacts individuals who suffer from asthma or other lung ailments. While this is an example of a negative externality, externalities can also be positive.
An externality is a benefit or cost falling on people other than those involved in the activity's market. It can create a difference between private costs or values and social costs or values.
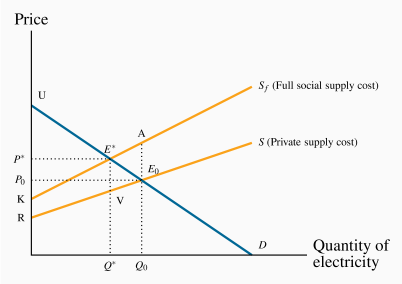
We will now show why markets characterized by externalities are not efficient, and also show how these externalities might be corrected or reduced. The essence of an externality is that it creates a divergence between private costs/benefits and social costs/benefits. If a steel producer pollutes the air, and the steel buyer pays only the costs incurred by the producer, then the buyer is not paying the full "social" cost of the product. The problem is illustrated in Figure 5.5.
Negative externalities
In Figure 5.5, the supply curve S represents the cost to the supplier, whereas Sf (the full cost) reflects, in addition, the cost of bad air to the population. Of course, we are assuming that this external cost is ascertainable, in order to be able to characterize Sf accurately. Note also that this illustration assumes that, as power output increases, the external cost per unit rises, because the difference between the two supply curves increases with output. This implies that low levels of pollution do less damage per unit: Perhaps the population has a natural tolerance for low levels, but higher levels cannot be tolerated easily and so the cost per unit is greater.
Despite the externality, an efficient level of production can still be defined. It is given by Q×, not Q0. To see why, consider the impact of reducing output by one unit from Q0. At Q0 the willingness of buyers to pay for the marginal unit supplied is E0. The (private) supply cost is also E0. But from a societal standpoint there is a pollution/health cost of AE0 associated with that unit of production. The full cost, as represented by Sf, exceeds the buyer's valuation. Accordingly, if the last unit of output produced is cut, society gains by the amount AE0, because the cut in output reduces the excess of true cost over value.
Applying this logic to each unit of output between Q0 and Q×, it is evident that society can increase its well-being by the dollar amount equal to the area E×AE0, as a result of reducing production.
Next, consider the consequences of reducing output further from Q×. Note that some pollution is being created here, and environmentalists frequently advocate that pollution should be reduced to zero. However, an efficient outcome may not involve a zero level of pollution! If the production of power were reduced below Q×, the loss in value to buyers, as a result of not being able to purchase the good, would exceed the full cost of its production.
If the government decreed that, instead of producing Q×, no pollution would be tolerated, then society would forgo the possibility of earning the total real surplus equal to the area UE×K. Economists do not advocate such a zero-pollution policy; rather, we advocate a policy that permits a "tolerable" pollution level – one that still results in net benefits to society. In this particular example, the total cost of the tolerated pollution equals the area between the private and full supply functions, KE×VR.
As a matter of policy, how is this market influenced to produce the amount Q× rather than Q0? One option would be for the government to intervene directly with production quotas for each firm. An alternative would be to impose a corrective tax on the good whose production causes the externality: With an appropriate increase in the price, consumers will demand a reduced quantity. In Figure 5.5 a tax equal to the dollar value VE× would shift the supply curve upward by that amount and result in the quantity Q× being traded.
A corrective tax seeks to direct the market towards a more efficient output.
We are now venturing into the field of environmental policy, where a corrective tax is usually called a carbon tax, and this is explored in the following section. The key conclusion of the foregoing analysis is that an efficient working of the market continues to have meaning in the presence of externalities. An efficient output level still maximizes economic surplus where surplus is correctly defined.
Positive externalities
Externalities of the positive kind enable individuals or producers to get a type of 'free ride' on the efforts of others. Real world examples abound: When a large segment of the population is immunized against disease, the remaining individuals benefit on account of the reduced probability of transmission.
A less well recognized example is the benefit derived by many producers world-wide from research and development (R&D) undertaken in advanced economies and in universities and research institutes. The result is that society at large, including the corporate sector, gain from this enhanced understanding of science, the environment, or social behaviours.
The free market may not cope any better with these positive externalities than it does with negative externalities, and government intervention may be beneficial. Furthermore, firms that invest heavily in research and development would not undertake such investment if competitors could have a complete free ride and appropriate the fruits. This is why patent laws exist, as we shall see later in discussing Canada's competition policy. These laws prevent competitors from copying the product development of firms that invest in R&D. If such protection were not in place, firms would not allocate sufficient resources to R&D, which is a real engine of economic growth. In essence, the economy's research-directed resources would not be appropriately rewarded, and thus too little research would take place.
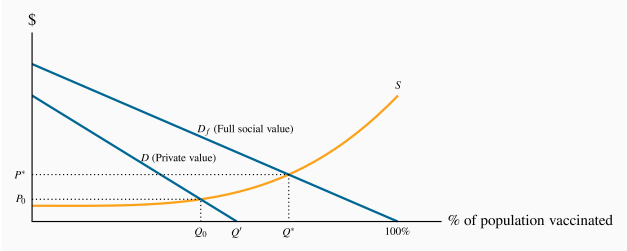
While patent protection is one form of corrective action, subsidies are another. We illustrated above that an appropriately formulated tax on a good that creates negative externalities can reduce demand for that good, and thereby reduce pollution. A subsidy can be thought of as a negative tax, and can stimulate the supply of goods and services that have positive externalities. Consider the example in Figure 5.6.
Individuals have a demand for flu shots given by D. This reflects their private valuation – their personal willingness to pay. But the social value of flu shots is greater. When more individuals are vaccinated, the probability that others will be infected falls. Additionally, with higher rates of immunization, the health system will incur fewer costs in treating the infected. Therefore, the value to society of any quantity of flu shots is greater than the sum of the values that individuals place on them.
Df reflects the full social value of any quantity of flu shots. In this instance the quantity axis measures the percentage of the population vaccinated, which has a maximum of 100%. If S is the supply curve, the socially optimal, efficient, market outcome is Q×. The steeply upward-sloping section of S denotes that it may be very costly to vaccinate every last person – particularly those living in outlying communities. How can we influence the market to move from Q0 towards Q×? One solution is a subsidy that would reduce the price to zero. In this case that gets us almost to the optimum, because the percentage of the population now choosing to be vaccinated is given by  . The zero price essentially makes the supply curve, as perceived by the population, to be running along the horizontal axis.
Note the social value of the improvement in moving from Q0 to ; the social value exceeds the social cost. But even at further gains are available because at the social value of additional vaccinations is greater than the social cost. Overall, at the point Q× the social value is given by the area under the demand curve, and the social cost by the area under the supply curve.