Where one variable is nominal (more precisely, nominal with two values) and one is ordinal, the most widely used test statistic is the Mann-Whitney U -test (also called Wilcoxon rank sum test).
Let us return to the case study of the animacy of modifiers in the two English possessive constructions. Here is the research hypothesis again, from (12) and (13) in Chapter 5:
(8) H1 : The S -POSSESSIVE will be used when the modifier is high in ANIMACY, the OF -POSSESSIVE will be used when the modifier is low in ANIMACY.
Prediction: The modifiers of the S -POSSESSIVE will have a higher median on the ANIMACY scale than the the modifiers of the OF -POSSESSIVE.
The corresponding null hypothesis is stated in (9):
(9) H0 : There is no relationship between ANIMACY and TYPE OF POSSESSIVE.
Prediction: There will be no difference between the medians of the modifiers of the S -POSSESSIVE and the OF -POSSESSIVE on the ANIMACY scale.
The median animacy of all modifiers in our sample taken together is 2,5 so the H0 predicts that the medians of s -possessive and the of -possessive should also be 2. Recall that the observed median animacy in our sample was 1 for the s -possessive and 5 for the of -possessive, which deviates from the prediction of the H0 in the direction of our H1. However, as in the case of nominal data, a certain amount of deviation from the null hypothesis will occur due to chance, so we need a test statistic that will tell us how likely our observed result is. For ordinal data, this test statistic is the U value, which is calculated as follows.
In a first step, we have to determine the rank order of the data points in our sample. For expository reasons, let us distinguish between the rank value and the rank position of a data point: the rank value is the ordinal value it received during annotation (in our case, its value on the ANIMACY scale), its rank position is the position it occupies in an ordered list of all data points. If every rank value occurred only once in our sample, rank value and rank position would be the same. However, there are 41 data points in our sample, so the rank positions will range from 1 to 41, and there are only 10 rank values in our annotation scheme for ANIMACY. This means that at least some rank values will occur more than once, which is a typical situation for corpus-linguistic research involving ordinal data. Table 6.10 shows all data points in our sample together with their rank position.
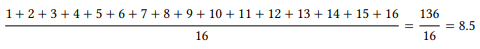
Every rank value except 4, 8 and 9 occurs more than once; for example, there are sixteen cases that have an ANIMACY rank value of 1 and six cases that have a rank value of 2, two cases that have a rank value of 3, and so on. This means we cannot simply assign rank positions from 1 to 41 to our examples, as there is no way of deciding which of the sixteen examples with the rank value 1 should receive the rank position 1, 2, 3, etc. Instead, these 16 examples as a group share the range of ranks from 1 to 16, so each example gets the mean rank position of this range. There are sixteen cases with rank value 1, to their mean rank is
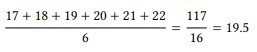
The first example with the rank value 2 occurs in line 17 of the table, so it would receive the rank position 17. However, there are five more examples with the same rank value, so again we calculate the mean rank position of the range from rank 17 to 22, which is
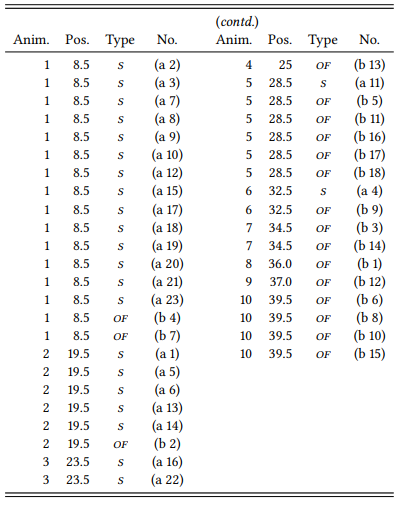
Repeating this process for all examples yields the rank positions shown in the second column in Table 6.10.
Table 6.10: Annotated sample from Table 5.6 with animacy rank and position (cf. Table 5.7)
Once we have determined the rank position of each data point, we separate them into two subsamples corresponding to the values of the nominal variable TYPE OF POSSESSIVE again, as in Table 6.11. We then calculate rank sum R for each group, which is simply the sum of their rank positions, and we count the number of data points N in each group.
Table 6.11: Animacy ranks and positions and rank sums for the sample of possessives
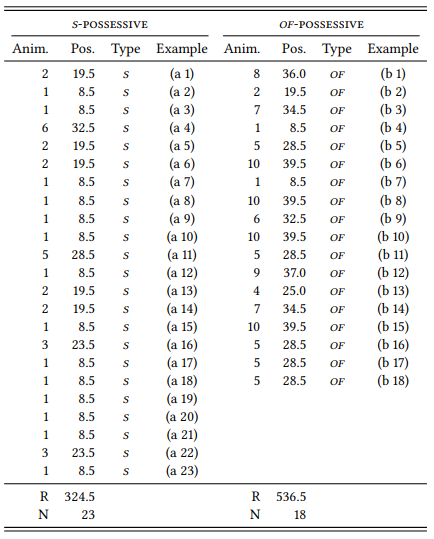
The rank sum and the number of data points for each sample allow us to calculate the U values for both group using the following simple formulas:
(10) 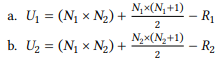
Applying these formulas to the measures for the s -possessive (10a) and of - possessive (10b) respectively, we get the U values
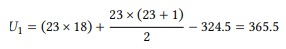
and
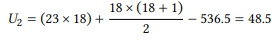
The U value for the entire data set is always the smaller of the two U values. In our case this is U2 , so our U value is 48.5. This value can now be compared against its known distribution in the same way as the χ2 value for nominal data. In our case, this means looking it up in the table in Section 14.3 in the Statistical Tables at the end of this book, which tells us that the p-value for this U value is smaller than 0.001 – the difference between the s - and the of -possessive is, again, highly significant. The Mann-Whitney U test may be reported as follows:
(11) 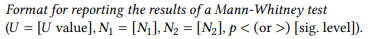
Thus, we could report the results of this case study as follows: “This study has shown that s -possessives are preferred when the modifier is high in animacy, while of -possessives are preferred when the modifier is low in animacy. A Mann-Whitney test shows that the differences between the constructions are highly significant (U = 48.5, N1 = 18, N2 = 23, p < 0.001)”.
5 There are 41 data points in our sample, whose ranks are the following: 1, 1, 1, 1, 1, 1, 1, 1, 1, 1, 1, 1, 1, 1, 1, 1, 2, 2, 2, 2, 2, 2, 3, 3, 4, 5, 5, 5, 5, 5, 5, 6, 6, 7, 7, 8, 9, 10, 10, 10, 10. The twenty-first item on the list is a 2, so this is the median.

