
2.4: Growth in Head Circumference
- Page ID
- 139029
Head Circumference
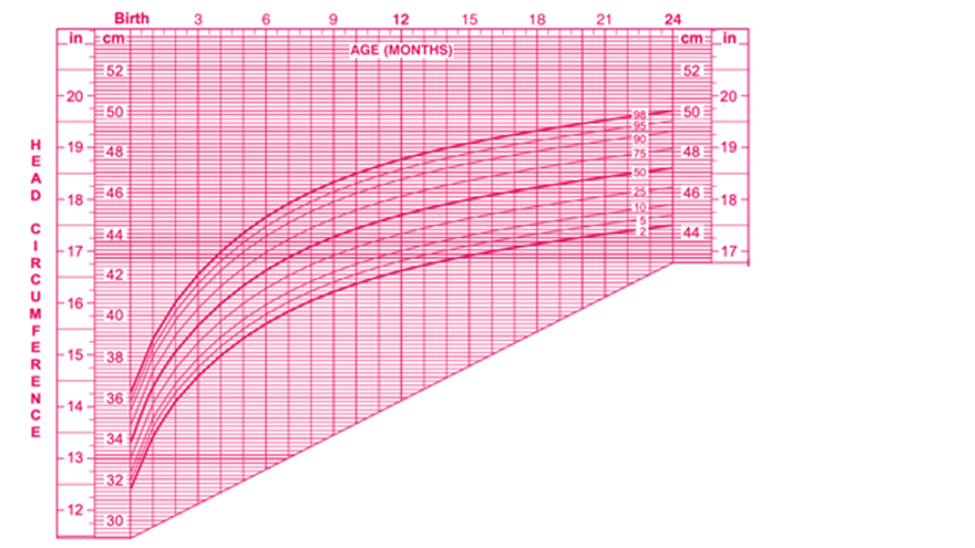
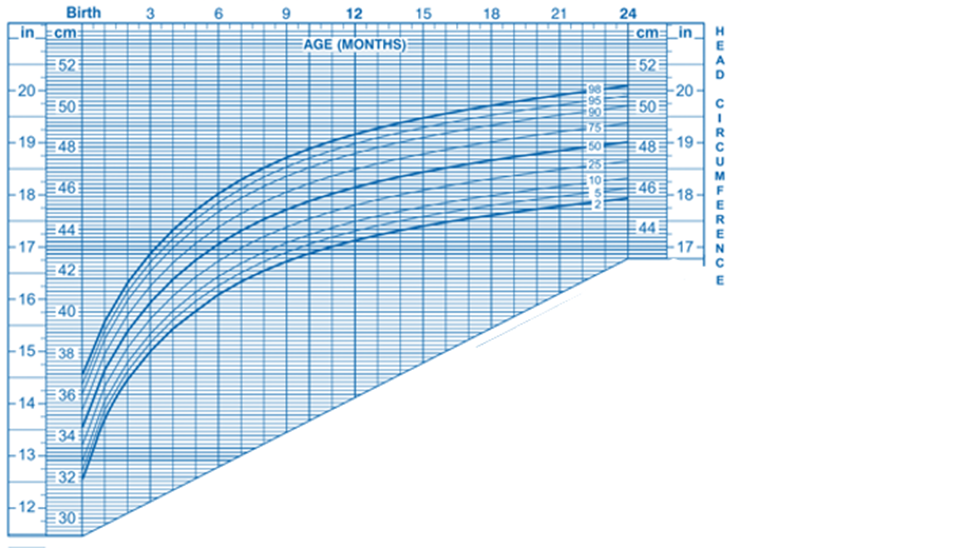
Head circumference trajectories are important as they are commonly used as a measure of neurological development in infancy and early childhood. As seen in Figure \(\PageIndex{1}\) and Figure \(\PageIndex{2}\), On average, head circumference increases by 2 centimeters per month during the first three months and 1 centimeter per month from 3 to 6 months of age. From six to twelve months, head circumference increases by 0.5 centimeters per month. During the first year of life, there is a 12 centimeter average increase in head circumference. After one year of age, only 1 centimeter gain occurs per 6 months in head circumference until three years of age and only 1 centimeter every year between 3 to 5 years of age. An average of five centimeters total is gained in head circumference between 1 to 5 years of age. The rate of head circumference growth during the first three years of life can vary and is influenced by numerous factors, including, but not limited to, an Autism Spectrum Disorder diagnosis (Regev et al., 2021; Webb et al., 2007), family socioeconomic status (Bouthoorn et al., 2012) and premature birth and/or low birth weight (Jaekel et al., 2018). For example, infants of mothers with higher educational levels have infants with larger head circumferences, but this difference was only found during the first six months of life (Bouthoorn et al., 2012). [1] [2]
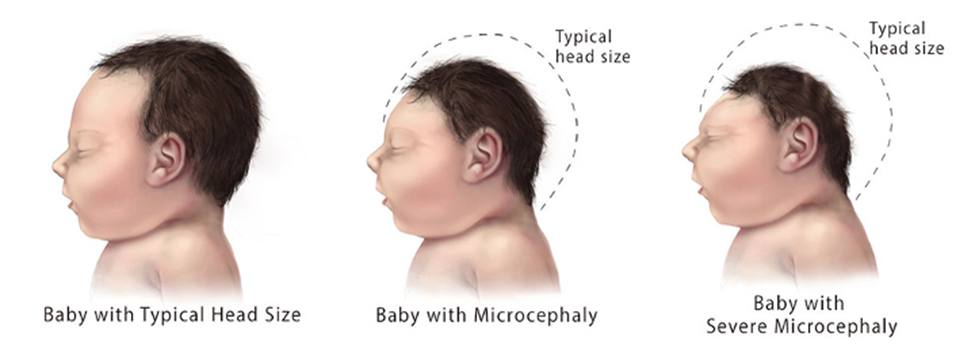
Head circumference is an important reflection of growth and development of the brain, especially in early childhood (Bartholomeusz, Courchesne & Karns, 2002). Some studies have found smaller head circumference to be associated with a lower overall intelligence and lower cognitive abilities (Bach et al., 2020; Jaekel et al., 2019; Kirkegaard et al., 2020; Koshy et al., 2021). Large deviations from the norm in head circumference can indicate microcephaly (a baby’s head is smaller than expected when compared to babies of the same sex and age) or macrocephaly (a baby’s head is larger than expected when compared to babies of the same sex and age).[5]
Microcephaly was in world news headlines in 2015 with the outbreak of the Zika Virus. Congenital Zika syndrome is a unique pattern of birth defects and disabilities found among fetuses and babies infected with Zika virus during pregnancy. Zika primarily spreads through infected mosquito bites and can be passed from an infected pregnant mother to her fetus. A common symptom of prenatal infection is an infant with decreased brain tissue and microcephaly (Satterfield-Nash et al., 2017).[5]
[1] Jones & Samanta (2020). Macrocephaly. StatPearls. CC by 4.0
[2] Treit et al., (2016). Relationships between head circumference, brain volume and cognition in children with prenatal alcohol exposure. PloS One, 11(2), e0150370. CC by 4.0
[3] Image from CDC is in the public domain.
[4] Image from CDC is in the public domain.
[5] “Facts about Microcephaly” by the CDC is in the public domain.
[6] Image adapted from “Facts about Microcephaly” by the CDC.