Incorporate turnover time into Marx’s theory of competitive profit rate formation
Investigate the Marxian theory of the long-term tendency of the rate of profit to fall
Analyze the Marxian theory of the business cycle and the industrial reserve army
Explore the Marxian theory of discoordination across macroeconomic sectors
Study the causes of the 2007-2009 economic crisis from a Marxian perspective
Evaluate U.S. economic history through the lens of social structure of accumulation theory
Inspect the Austrian theory of the business cycle
Contrast Post-Keynesian effective demand theory with the neoclassical synthesis model
In Chapter 13, we investigated the neoclassical synthesis model, which represents a synthesis of neoclassical theory and Keynesian theory. The neoclassical synthesis model makes it possible to retain the neoclassical conclusion that market capitalist economies tend to return to the full employment level of output in the long even as it allows for the Keynesian conclusion that the economy may suffer from periods of depression or inflationary boom in the short run. The unorthodox theories of macroeconomic crisis that we explore in this chapter reject the neoclassical synthesis model. All assert that the tendency towards depression and periods of prolonged crisis exists in capitalist societies, but the reasons for their assertions range from the central bank’s manipulation of the money supply to institutional breakdown. To explore these competing theories, we will first look at the Marxian theory of capitalist crises, which has several dimensions. After this analysis is complete, we will analyze the causes of the 2007-2009 economic crisis from a Marxian perspective. The next theory that we will consider, known as social structure of accumulation (SSA) theory, is a framework that many radical political economists use. It offers an original way of interpreting the history of capitalist societies and the different factors that promote capital accumulation and produce economic crises. We will then shift gears and consider the Austrian theory of the business cycle, which places most of the blame for economic crises within capitalism on the meddling of the central bank. We will conclude with a discussion of the way in which the Post-Keynesian theory of effective demand contrasts with the theory of effective demand represented in the neoclassical synthesis model.
Incorporating Turnover Time into Marx’s Theory of Competitive Profit Rate Formation
In Chapter 8, we investigated Marx’s theory of the formation of a competitive rate of profit. In that chapter, we considered an economy with five industries. This example has been reproduced in Table 14.1.
Because each industry has a different organic composition of capital (OCC) (i.e., a different ratio of constant capital to total capital), the rates of profit differ. The industries with higher rates of profit have lower organic compositions of capital. The industries with lower rates of profit have higher organic compositions of capital. It was previously explained that the industries with higher profit rates employ relatively more variable capital because labor-power is the source of value and surplus value. Because capital has a strong tendency to flow out of industries with low rates of profit and into industries with high rates of profit, the rate of profit tends to equalize across all industries as prices fall in the industries with high profit rates and prices rise in industries with low profit rates. The uniform, general rate of profit (r) in this example is calculated in the following way, where S, V, and C refer to aggregate surplus value, aggregate variable capital, and aggregate constant capital, respectively:
These adjustments cause prices of production to diverge from values and profits to diverge from surplus value in specific industries. For the overall economy, however, aggregate production price and aggregate value are equal. Additionally, aggregate profit and aggregate surplus value are equal.
The situation becomes more complicated when we introduce variations in turnover times across industries. In some industries, the capital turns over very quickly. That is, capital is advanced, which is to say that it is used to purchase labor-power and the means of production. The elements of production are then used to produce commodities. The commodities are then quickly sold. The quicker this transformation from money capital back into money capital occurs, the shorter the turnover time. Also, a shorter turnover time implies a greater number of turnovers per year. When the number of turnovers per year is larger, then more surplus value will be produced and appropriated in a year, other factors the same. Also, the capital is only advanced one time and is then used repeatedly throughout the year as the capital value returns to the capitalist.
The fact that capital turns over multiple times in a year leads us to a new definition of the rate of profit and a new definition of the rate of surplus value. We shall refer to these new measures as the annual rate of surplus value and the annual rate of profit. They are defined as follows:
To calculate these measures, we need to consider the length of the turnover period in weeks, denoted as T. For example, if T = 12, then it takes 12 weeks for capital to be advanced, employed in production, and then realized through the process of exchange. We also assume that xc and xv represent the weekly constant capital advanced and the weekly variable capital advanced, respectively. It is essential to understand that capital must be advanced during each week of the initial turnover period. Otherwise, it would be impossible to maintain continuous production. Once the turnover period ends, the realization of commodity values guarantees that the capitalist enterprise has sufficient capital again to continue production. Therefore, the capital advanced will be equal to the product of the turnover time and the weekly capital advanced, and the annual rate of profit (rA) will be equal to the annual mass of surplus value (S) divided by this capital advanced.
Similarly, the annual rate of surplus value (eA) is equal to the annual mass of surplus value divided by the variable capital advanced:
Using these definitions, let’s consider an example of an economy with 7 industries as shown in Table 14.2.
To calculate the general annual rate of profit(rA*), we need to add up the annual mass of surplus value across all industries and then divide by the total capital advanced across all n industries as follows:
When calculating the general annual rate of profit, we add up the annual surplus value across each industry i and then divide by the sum of the capital advanced across each industry i. It is this formula that is used to calculate the annual rate of profit of 159% (after rounding) in Table 14.2. That profit rate may then be used to determine the annual profit in each industry and the annual production price in each industry.
To calculate the general annual rate of surplus value (eA*), we need to add up the annual mass of surplus value across all industries and then divide by the total variable capital advanced across all n industries as follows:
It should be clear from both definitions that the annual rates of profit and surplus value are significantly higher than their daily counterparts. The reason is that capital is only advanced during the turnover period, which is typically shorter than one year, while the surplus value is appropriated throughout the entire year.
Table 14.2 reveals that the same aggregate equalities hold in an economy where different turnover periods apply to different industries. That is, the aggregate annual mass of surplus value is equal to the aggregate annual mass of profit. Also, the aggregate annual value of commodities equals the aggregate annual production price. Prior to the transformation of values into production prices, the industries with relatively more variable capital tend to have higher annual rates of profit, such as industries 6 and 7. An additional reason exists for the high annual profit rates of industries 6 and 7, namely the short turnover times of only 9 weeks in those industries. Industry 5 has the shortest turnover time of 8 weeks, but its organic composition of capital is so high that the combination produces the lowest annual rate of profit. Industry 4’s low annual rate of profit can be attributed both to its high organic composition of capital and its long turnover period. Industries 1-3 have organic compositions of capital that are closer to industries 6 and 7 (which raises their annual profit rates above those of industries 4 and 5), but their long turnover periods produce lower annual profit rates than in industries 6 and 7.
This analysis effectively incorporates the turnover process into the method of transforming values into prices of production. It does not address the transformation problem, described in Chapter 8, however, and so the importance of addressing that problem should be kept in mind.
The Marxian Theory of the Long-Term Tendency of the General Rate of Profit to Fall
Marxian economists argue that the general rate of profit has a long-term tendency to fall in capitalist economies. It is a claim about the movement of the general rate of profit over a period of decades and even centuries. The explanation concentrates on capitalist competition and the way that it leads to innovation. The introduction of more advanced machinery and equipment in the production process causes an increase over time in the amount of constant capital employed in production relative to the variable capital employed in production. Because variable capital is the source of value and surplus value, the relative decline in its employment causes the general rate of profit to fall over time.
To see how an increase in the organic composition of capital tends to drive down the general rate of profit, consider the general rate of profit as we defined it before incorporating turnover time into the analysis:
This definition of the general rate of profit is calculated using the aggregate surplus value, the aggregate constant capital, and the aggregate variable capital. The organic composition of capital (OCC), as defined in Chapter 8, is the following:
An alternative measure of the organic composition of capital is expressed more simply as the ratio of constant capital to variable capital as follows:
It is possible to rewrite the general rate of profit so that the relationship to the organic composition of capital becomes clear:
Other factors the same, as the organic composition of capital (OCC’) increases, the general rate of profit must fall. This argument provides the explanation for the long-term tendency of the rate of profit to fall. Capitalist competition leads to innovation and a rising organic composition of capital. The general rate of profit thus tends to fall over long periods of time. The fall in the rate of profit means that capitalist enterprises have an increasingly difficult time making interest payments and rent payments out of their profits, which generates capitalist instability and economic crises with workers thrown out of work and businesses failing.
The same argument applies to the general annual rate of profit as shown below:
The only difference here is that S refers to the annual mass of surplus value, and C and V refer to the annual aggregate constant capital advanced and the annual aggregate variable capital advanced. Both C and V are calculated according to the amounts required to maintain continuous production throughout the turnover period. The annual rate of profit also shows a tendency to decline as the organic composition of capital rises.
Although Marxian economists argue that the annual rate of profit tends to fall over long periods of time, the law of the tendency of the rate of profit to fall (LTRPF) is not an unconditional tendency. That is, Marxian economists, following Marx, argue that several countertendencies operate to prevent a decline of the general rate of profit. Therefore, if we observe an increase in the average rate of profit, then such movements do not subvert the law of the tendency of the rate of profit to fall. They simply mean that the countertendencies are at work and are giving a boost to the general rate of profit. We will briefly summarize the six major countertendencies that Marx identified in volume 3 of Capital and then add an additional countertendency to the list based on our definition of the annual rate of profit.[1]
The first factor that serves to counteract the fall in the general rate of profit is a rise in the rate of surplus value. If workers are exploited more, then S/V will rise. Other factors the same, a rise in the rate of surplus value throughout the economy will raise the general rate of profit. Therefore, even if the organic composition of capital rises due to competition and innovation, a sufficiently large increase in the rate of surplus value will nevertheless increase the general rate of profit. A likely cause of such an increase in the rate of surplus value is an extension of the length of the working day. If workers are required to work longer hours for the same wages, then the increase in absolute surplus value raises the rate of surplus value and the rate of profit. Another possible source of a rise in the rate of surplus value is a rise in productivity in the sectors that produce the means of subsistence for workers. If productivity rises in those sectors, then the value of labor-power declines with the fall in the values of the commodities that workers require daily to reproduce their labor-power. This change represents a rise in relative surplus value production. The increase in the rate of surplus value then raises the rate of profit.
A second counteracting factor that pushes back against the long-term fall in the general rate of profit is a reduction in wages below their value. When wages are pushed down below the value of labor-power, the degree of exploitation rises. The organic composition of capital rises as well, but the impact is greater on the numerator in our rewritten definition of the profit rate, which causes the rate of profit to rise overall. It is easier to see that a fall in wages below the value of labor-power will raise the rate of profit by considering the original definition (i.e., r = S/(C+V)). When the wages paid fall, the consequence is an unambiguous rise in the rate of profit. Different factors may cause such reductions in wages, including a weakening of unions and a period of intense competition among workers in the market for labor-power. These factors make it possible to exploit workers more, and the profit rate rises.
A third factor that serves as a countertendency to the falling rate of profit tendency is the cheapening of the elements of constant capital. Marx explained that a rise in productivity tends to increase the material elements used in the production process, but it also tends to reduce the value of those same elements. If the devaluation occurs relatively more than the increase in the material elements, then the constant capital employed will decline and the rate of profit will increase. The technological innovation that capitalist competition drives tends to raise the organic composition of capital, but the cheapening of the elements of constant capital works in the opposite direction. The organic composition of capital ends up falling, which raises the general rate of profit.
The fourth factor also involves a reduction of wages but this time it has a very specific cause. Marx referred to this factor as the relative surplus population. As capitalist development progresses and technological change advances, the introduction of labor-saving machinery leads to unemployment in many sectors of the economy. This surplus population puts downward pressure on wages, which raises the rate of exploitation. Even though it also pushes up the organic composition of capital, the impact on the numerator in our rewritten definition of the profit rate is more significant, which drives up the rate of profit overall. The same technological advances that tend to increase the organic composition of capital also drive down wages, which boosts the rate of surplus value.
A fifth factor that Marx mentions as responsible for counteracting the long-term tendency of the rate of profit to fall is international trade. That is, increased trade with foreign nations leads to imports of the elements of constant capital at lower prices. The reduction in the constant capital advanced reduces the organic composition of capital, which boosts the general rate of profit. As capitalism deepens, world trade expands, and this effect should become stronger. A similar pattern is expected with respect to the commodities that workers purchase for consumption. World trade makes it possible to import cheaper means of subsistence. As the value of labor-power declines with the increased availability of cheaper elements of consumption, the variable capital that capitalists must advance declines. The consequence is a rise in the rate of surplus value and an increase in the general rate of profit.
The sixth and final factor that Marx mentions as an offsetting factor that counteracts the long-term fall in the general rate of profit is the rise in the amount of share capital invested in production. Marx has in mind interest-bearing capital that earns interest only and thus takes a share of the average profit appropriated in industry. Moneylending capital is thus excluded from the calculation of the general rate of profit. Because it earns a rate that is far below the average rate of profit and it is frequently invested in industries with a high organic composition of capital (e.g., railroads), the consequence would be a major reduction in the general rate of profit, if it was included in the calculation of the general rate of profit. Its exclusion tends to increase the general rate of profit and thus the rise in share capital with the development of capitalism qualifies as a counteracting factor that works against the long-term tendency of the rate of profit to fall.
A final factor that we might add to Marx’s list of counteracting tendencies is a change in the average turnover time across the different branches of production. The calculation of the annual rate of profit (rA*) shows that if the turnover time in any one industry increases, then the annual rate of profit will fall. The reduction in the annual rate of profit will be even larger if most or all the industries experience longer turnover times. Similarly, if the turnover time in any one industry declines, then the annual rate of profit will rise. The rise in the annual rate of profit will be even larger when most or all industries experience shorter turnover times. Now consider what has happened to the average turnover time throughout the history of capitalism. The turnover time includes buying time (i.e., the purchase of materials and instruments of labor), production time, and selling time (i.e., the sale of the final commodities). Capitalists have long been engaged in an intense competitive struggle to appropriate more profits than competitors. A reduction in the turnover time is a primary method of reducing the capital advanced and increasing the annual mass of surplus value that is appropriated, which are factors that increase the annual rate of profit. The enormous improvements in transportation and communication technology throughout the history of capitalism have allowed capitalists to achieve this reduction of turnover time. Commodities are purchased more quickly for use in production, production itself has become immensely quicker and more efficient, and commodities are transported to the final consumer more quickly and easily than ever before. The reduction in turnover time has thus boosted the annual rate of profit and has helped counteract the long-term tendency of the annual rate of profit to fall.
Although these counteracting factors tend to increase the general rate of profit, Marxian economists assert that the long-term tendency of the profit rate to fall will reassert itself, producing economic crises, rising unemployment, and falling production. Marxian economists have more to say about the economic instability that capitalism produces, however, and so we now turn to factors that may produce economic downturns in the short-term.
A Marxian Theory of the Business Cycle and the Industrial Reserve Army
When profits are appropriated, capitalists must decide how to use them. One option is to consume it all, spending it on luxury commodities like mansions, expensive automobiles, vacations, jewelry, artwork, etc. Another option is to reinvest it to expand production. When profits are reinvested in production, Marxists state that capital is accumulated. In fact, the profits are being transformed into new capital and so the capital value grows. Capitalists can also choose to hoard the profits, but doing so will not allow it to be used for luxury consumption or profit-making and it will lose its value over time if inflation occurs.
Although these different options are available to capitalists, they are driven to accumulate capital. The intense competition that occurs among capitalists leads to capital accumulation as capitalists seek to outperform their competitors. This drive to accumulate capital has an impact on the general rate of profit, which creates the economic fluctuations that are referred to as the business cycle. To understand the reason, consider how money wages are likely to change over the course of the business cycle as depicted in Figure 14.1.[2]
Figure 14.1 shows the value of labor-power and thus the variable capital (V) to be stable. The money wage, however, is not stable and responds to the expansion and contraction of the industrial reserve army of the unemployed. The industrial reserve army of the unemployed is the name that Marxian economists give to the large pool of unemployed workers that always exists within capitalist societies. It might expand or contract at different times, but it is a continuous feature of market capitalist economies. During periods of economic expansion, the reserve army of the unemployed decreases because capitalists are aggressive in their hiring. The aggressive hiring creates a shortage of labor-power and wages begin to rise above the value of labor-power. The aggregate money wages (W) thus rise above the variable capital (V), which is the value that would be advanced if the wage paid was equal to the value of labor-power. During periods of economic contraction, on the other hand, the reserve army of the unemployed increases because capitalists dismiss workers as production slows. The rapid dismissal of workers creates a large surplus of labor-power and wages fall below the value of labor-power. The aggregate money wages spent now fall below the variable capital advanced, which again is the amount that would be spent on wages if the wage equaled the value of labor-power.Figure 14.1 shows that as aggregate production (Y) rises from its minimum value (Ymin) to its maximum value (Ymax), the depletion of the industrial reserve army causes wages to rise from a minimum value (Wmin) to a maximum value (Wmax). The minimum wage fund is determined according to the minimum biological requirements to sustain the life of the worker. The value of labor-power possesses a “historical and moral element” as Marx argued.[3] Therefore, it allows a worker to purchase a basket of consumption goods that the worker needs according to a cultural norm that is specific to that society at that precise point in history. Wages may thus fall below the value of labor-power temporarily while allowing the worker to sustain his or her life and the lives of his or her dependents. At some point, the funds advanced as wages will be too low to sustain even biological life, and that amount has been designated as the lower limit.
The maximum wages are determined according to how much profits (П) may be squeezed before it becomes impossible for capitalists to pay interest on loans, pay rent to landowners, etc. Some capitalists are in a stronger position than other capitalists and so as that point approaches, many weaker businesses fail, production begins to decline, and unemployment soars. With the expansion of the reserve army of the unemployed, wages begin to fall and the total funds advanced as wages decline. With the decline in wages, profits start to increase. Eventually, wages fall enough and profits rise enough that capital accumulation resumes. This resumption of capital accumulation does not occur until the trough of the business cycle is reached. That is, production reaches its minimum level before capitalists can justify accumulating capital again. At that point, wages have fallen so much and capital assets have depreciated so much that new investment and expanded production are expected to be profitable.
Figures 14.2 (a) and 14.2 (b) show how the wages paid (W) and the general rate of profit (r) change over time in response to the overall fluctuations in economic activity.
Figure 14.2 (a) shows aggregate wages rising rapidly during the economic expansion and squeezing profits to a minimum level. In Figure 14.2 (a) profits are represented as the difference between aggregate wages and aggregate value added (W+П). At the start of the economic crisis, however, unemployment soars and wages begin to drop. This reduction in wages occurs quickly and helps to restore profitability until the next expansion begins. Figure 14.2 (b) shows how the general rate of profit follows the opposite pattern relative to aggregate wages as production changes over the course of the business cycle. Because we are now thinking in terms of profits and wages as opposed to surplus value and variable capital, let’s write the general rate of profit as follows:
In this expression, CP represents the production price of the means of production or the value of the constant capital transformed into its production price. We can also write the maximum value of the general rate of profit (rmax) and the minimum value of the general rate of profit (rmin) as follows:
As production expands, wages rise quickly, and profits are squeezed. The result is a rapid fall in the rate of profit to its minimum value, which precipitates the crisis. As production declines, aggregate wages quickly fall and profits expand for businesses that do not fail. Eventually, the rise in the general rate of profit to its maximum value makes renewed capital accumulation possible once more.
This theory of the business cycle also explains the fluctuations in the unemployment rate over time that we observe. The reserve army of the unemployed rises during contractions and falls during expansions. Nevertheless, a reserve army of the unemployed always exists. The reader should consider the contrast between the language used in neoclassical theory and in Marxian theory. In neoclassical theory, unemployment is recognized as inevitable, but it is referred to as natural unemployment. The use of the word “natural” suggests that a significant amount of unemployment should not be a concern to anyone. It is natural and beyond our conscious control. Marxian economists also regard a certain amount of unemployment in a capitalist society as a permanent feature of that economic system. The reference to a “reserve army” of the unemployed emphasizes the scale of the problem of unemployment. It also suggests that unemployed workers are under the control of the capitalist class and are only called into service as needed. Both schools of economic thought recognize the permanent nature of unemployment in capitalist societies, but their ways of interpreting that empirical fact are completely different.
In his classic 1942 work The Theory of Capitalist Development, Marxian economist Paul Sweezy includes a helpful flow diagram that captures the various factors that cause the reserve army of the unemployed to grow and shrink over time. Figure 14.3 is based on the diagram in Sweezy’s book.[4]
The flows from the reserve army to industry and back again represent the expansions and contractions of the reserve army that have been discussed in this section. When wages rise and squeeze profits too much, workers are thrown out of work and the reserve army swells. When wages fall and profits expand, hiring picks up and the reserve army shrinks. Sweezy’s model identifies additional factors that can influence the size of the reserve army of the unemployed, namely the entrance of new workers into the market for labor-power and retirements that cause workers to exit the market for labor-power. Many factors are responsible for these expansions and contractions of the reserve army of the unemployed, and our purpose here is only to demonstrate the linkage between changes in wage levels and the amount of unemployment as aggregate production rises and falls.
The Marxian Theory of Discoordination across Macroeconomic Sectors
Marx had a great deal to say about what causes capitalist crises. In volume 1 of Capital, Marx argued that the possibility of a crisis within capitalism was inherent within the sphere of simple commodity circulation. The reader should recall the general form of a simple commodity circuit, which is denoted in the following way:
This circuit indicates that a commodity is sold for money and that the money is then used to purchase another commodity. The first commodity is thus transformed into a qualitatively different commodity. Classical economists, like J.B. Say, argued that crises within capitalism are impossible because “supply creates its own demand.” That is, the act of selling is also an act of purchase. When commodities are sold to obtain money, the purpose is to purchase another commodity and so the act of supplying commodities also represents a demand for other commodities. Therefore, supply and demand will be equal at the aggregate level and economic crises should never occur. This argument has been labeled Say’s Law of Markets, as we discussed in Chapter 13. The problem, as Marx pointed out, is that just because one commodity is sold for money does not mean that the money must immediately be spent on another commodity. If the seller of a commodity decides to hold on to the money, then no new demand is created. Therefore, Marx argued that the simple circulation of commodities contains within it the possibility that a crisis will occur.[5]
To argue that an event is possible is not the same as arguing that it will occur. Therefore, Marx provided additional arguments to show that capitalist crises are inevitable within capitalist societies. We have already considered Marx’s argument that a rising organic composition of capital leads to a long-term decline in the general rate of profit and how this decline produces economic crises. We have also explored Marx’s claim that capital accumulation leads to rising wage rates and a squeezing of profits until an economic crisis occurs, which restores wage rates to a level that is compatible with renewed capital accumulation. In this section, we will consider another aspect of Marx’s theory of economic crisis that focuses on imbalances that arise across major sectors of the economy, which ultimately produce an economic crisis. Marx makes this argument using a two-sector model of social reproduction that is found in volume 2 of Capital.[6] The rest of this section summarizes a portion of Marx’s analysis.
Table 14.3 provides information about an economy with two major sectors.
In Table 14.3, one sector produces means of production and another sector produces means of consumption. The means of consumption include both the means of subsistence for workers and luxury commodities for capitalists. Simple reproduction characterizes this economy. That is, capitalists do not reinvest the surplus value to expand production and so no capital is accumulated. To see that simple reproduction exists in this economy, consider the total constant capital advanced (C). The $1700 of constant capital that is advanced is exactly equal to the value of the means of production produced in Sector I. That is, the demand for means of production exactly equals the supply of means of production. Now consider the total variable capital advanced (V) and the total surplus value (S) realized from the sale of the total social product. The $800 of wages paid to workers plus the $500 of surplus value that capitalists appropriate is just sufficient to purchase the entire $1300 of means of consumption produced in Sector II. That is, the demand for means of consumption is exactly equal to the supply of means of consumption. Since aggregate supply and aggregate demand are the same, and all surplus value is spent on luxury commodities, simple reproduction exists in this economy.
Another way to see that simple reproduction holds is to identify the condition for simple reproduction that Marx identified in this two-sector model. For simple reproduction to hold, the following condition must be met:
In words, the constant capital employed in Sector 2 must equal the sum of variable capital and surplus value in sector 1. We can think through the condition in the following way. Capitalists in sector 1 advance $1000 of constant capital and so purchase $1000 worth of means of production produced in their industry. That purchase leaves $700 (= V1+S1) worth of means of production to be sold. For simple reproduction to hold, the constant capital advanced in Sector 2 must equal $700. Otherwise, the demand for the total output of Sector 1 will be too large or too small, and an economic crisis will occur.
Alternatively, workers and capitalists in Sector 2 purchase $600 (= V2+S2) worth of the means of consumption produced in their industry. That purchase leaves $700 (= C2) worth of means of consumption to be sold. For simple reproduction to hold, the sum of the variable capital and the surplus value in Sector 1 must equal $700. Otherwise, the demand for the total output of Sector 2 will be too large or too small and an economic crisis will occur.
The brilliance of Marx’s argument can be appreciated if we think through the sources of the different types of spending. The capitalists are willing to advance the constant capital and the variable capital. The workers then spend their wages and the capitalists purchase the means of production. Therefore, they know that when the commodities are sold, they will receive enough revenue to compensate them for these capital advances. The surplus value is a different matter. Capitalists know that they will receive the surplus value when the output is sold, but the only way that they can realize the surplus value is to advance the funds themselves! They must purchase luxury commodities using their previously realized surplus value. Why would capitalists want to use funds to make purchases only to have the same amount of surplus value return to them?
The answer in Marx’s theory is that the capitalists consume a surplus product in the form of luxuries produced with the surplus labor of the working class. It is true that the capitalists advance the constant capital and the variable capital and end up with revenues equal to that amount of capital advanced plus the surplus value. In that sense, money is used to make more money, but notice that the extra money to realize the surplus value originates with the capitalists themselves. It does not matter that the capitalists end up with a sum of money that is the same as before. The capitalist class appropriates the surplus labor and consumes the surplus product.
A Marxian Analysis of the 2007-2009 Economic Crisis
Richard Wolff provides a Marxian analysis of the 2007-2009 economic crisis through a Marxian lens.[7] According to Wolff, it is not changes in aggregate investment spending, tax levels, or government spending that should be the focus of efforts to explain the crisis. Instead, we should emphasize capitalism’s class structure as we struggle to understand the factors that produced the worst decline of economic activity in the United States since the Great Depression.
Wolff argues that beginning in the mid-1970s, workers’ average real wages stopped rising even though they had been increasing each decade since 1820.[8] Wolff points to the displacement of American workers due to the computerization of production and the transfer of production overseas as U.S. firms searched for higher profits.[9] Even during the deflation of the Great Depression, the price level declined more rapidly than money wages, which caused real wages to rise. As Wolff explains, even after real wages began to stagnate in the 1970s, workers’ productivity continued to rise, which allowed the capitalists to appropriate even more of the surplus value that workers produce.
Figure 14.4 offers a graphical depiction of the pattern of real value added per worker and real wages throughout U.S. history.
Figure 14.4 shows a gradual increase in real wages beginning in 1820 with stagnation beginning in the 1970s. Real value added per worker, on the other hand, is depicted as rising continuously up to the present time. Fluctuations are omitted from the graph to focus on the long-term trends that Wolff emphasizes. The difference between real value added per worker and the real wage represents the surpluses extracted from workers.
Wolff explains that the surpluses were distributed in several different ways.[10] A large part of the surpluses was distributed in the form of bonuses to corporate executives. Another portion was distributed as dividends to shareholders. Yet another part was used to move production overseas. Even so, the bulk of these surpluses found their way into the banks, which transformed them into loanable money capital. The loan capital was distributed to borrowers who purchased homes and automobiles. Other borrowers paid for college tuition and consumer goods. Firms also borrowed the funds to expand production. Large financial institutions bundled together many different loans, which created specialized financial assets, such as mortgage-backed securities (MBSs) and collateralized debt obligations (CDOs). They then sold the financial assets to large banks and institutional investors like hedge funds.
As the market for specialized financial assets exploded, so did the degree of risk in the financial system. As Wolff explains, workers began to borrow heavily to maintain a rising material standard of living.[11] Faced with stagnant wages, it was the only means of expanding upon one’s material possessions. Workers thus faced a double squeeze from the 1970s to 2006, according to Wolff.[12] Capitalists took the surpluses from workers but then also took from them again as workers paid interest on their mortgage loans, auto loans, credit card loans, and student loans. Because workers had fallen so deeply into debt, they struggled to keep up with their debt payments. Many borrowers began to default on their loans. The situation was made worse because many lenders chose to lend to so-called subprime borrowers in the subprime mortgage market. Subprime mortgage loans are loans to people with poor credit histories and low incomes. The interest rates are high but so is the risk. Furthermore, as risky loans were made, the growth of the secondary market for the loans had expanded to the point where the originator of the loan could sell it relatively quickly. Lenders thus had less reason to be concerned about the credit worthiness of their borrowers. The more loans they pushed, the greater commission revenue they received. The incentives were thus skewed and fueled the buildup of risk within the system.
A compounding factor was the behavior of credit rating agencies in the leadup to the 2008 financial crisis. Standard & Poor’s, Moody’s, and Fitch Ratings are the three agencies most responsible for assigning ratings to financial assets like MBSs, CDOs, and other specialized financial assets. Investors rely heavily on these ratings to evaluate the degree of risk. These ratings thus affect the prices of these financial assets. When the rating assigned to an asset is high, investors infer that the degree of risk is relatively low. When the rating assigned to an asset is low, investors infer that the degree of risk is relatively high. During the housing boom prior to the Great Recession, MBSs and other assets seemed like good investments. Rising prices for these assets made them appear to be sound investments. The problem, however, is that home prices were greatly inflated, and many borrowers were taking on more debt than they could handle. The rating agencies should have recognized the high degree of risk associated with these securities and downgraded them appropriately. Because the rating agencies received fees from the large investment banks to rate the securities that they created, the rating agencies had a strong incentive to promote the growth of these financial markets. The assignment of high ratings to the newly issued securities, even when they could not be justified, furthered that goal. A conflict of interest exists when an individual or organization has an incentive to act in multiple, competing ways. In this case, the agencies had a mission to serve the public interest with accurate ratings provided to investors. This mission competed with its drive to maximize profits through the assignment of inflated ratings on securities. Figure 14.5 provides a diagram of the relationships that existed between investment banks, credit rating agencies, institutional investors, commercial banks, and homebuyers.
Figure 14.5 shows how commercial banks loaned money to homebuyers for the purchase of homes. The banks then sold those mortgage loan assets to investment banks, which bundled the mortgages to create MBSs. The rating agencies then gave these securities inflated ratings to promote their further creation and sale. The newly issued securities were then sold in the financial marketplace to institutional investors such as pension funds, hedge funds, and mutual fund companies.
When home prices plummeted, many borrowers recognized that the values of their homes were below the values of their mortgage loans, and they simply walked away from their homes. Because they had put so little money down to purchase the homes, the loss of equity from a default did not stop them from abandoning their commitments. As defaults began to soar, the financial assets that represented bundles of these loans began to lose value. Large financial institutions watched as their asset values plummeted. Faced with such losses, banks and other financial institutions stopped lending to each other and to the public. Credit markets froze.[13] With firms unable to borrow money to pay wages and to purchase materials, layoffs increased, businesses failed, and unemployment soared. The Great Recession was the result of the instability in the financial system.
Wolff finds the source of the Great Recession in the class structure of capitalist society. He argues that a movement beyond a capitalist class structure would have prevented the economic crisis of 2007-2009. Specifically, he argues that workers need to become the collective appropriators of surpluses within their firms.[14] If firms were reorganized in this manner, Wolff believes that they would not have frozen real wages as firms did starting in the 1970s.[15] They also would not have distributed it as bonuses and dividends to executives and shareholders. They also would not have used it to transfer production overseas, nor would have they allowed it to accumulate in the banks to be loaned back to workers at high interest rates.[16] From a Marxian perspective, to really address the source of such instability would require revolutionary measures that challenge the right of owners to privately owned means of production.
U.S. Economic History through the Lens of Social Structure of Accumulation (SSA) Theory
A theoretical framework that is closely related to, yet distinct from, Marxian economics is social structure of accumulation (SSA) theory. This theory originated during the latter half of the twentieth century. Radical political economists use it to interpret major shifts in the history of capitalist societies. Most of the focus has been on the United States, but other national economies have been analyzed using this framework as well.
A social structure of accumulation (SSA) refers to an “institutional environment affecting capital accumulation.”[17] During periods of stability, the set of institutions comprising a SSA promotes rapid capital accumulation and economic growth. A SSA may be in place for decades as capital accumulation and economic growth continue without major disruption. Business cycle fluctuations will occur during these long periods of time, but no major economic crisis occurs. Eventually, however, the underlying institutions that make capital accumulation possible begin to break down, and a major economic crisis occurs. The crisis creates the conditions for the restructuring of the economy. New institutions develop and eventually establish a foundation for renewed capital accumulation and economic growth. The new institutions form a new SSA, which may do a better or worse job of promoting capital accumulation and economic growth.
This section on SSA theory concentrates on the work of Terrence McDonough who has written extensively about the nature of SSAs in U.S. economic history. [18]McDonough argues that three SSAs may be identified as we look back at the history of American capitalism: a post-Civil War SSA, a monopoly capitalist SSA, and a post-WWII SSA.[19] McDonough does not devote much attention to the post-Civil War SSA but argues that it represents a period of primitive accumulation, thus revealing the Marxian roots of SSA theory.[20] It was thus a period during which many of the resources of the nation were transformed into privately owned means of production and pulled into the capital accumulation process.
McDonough also describes the monopoly capitalist SSA, which took shape during the late nineteenth and early twentieth centuries. He argues that each SSA is built according to a unique organizing principle.[21] The organizing principle in the case of the monopoly capitalist SSA is the oligopolistic market structure that developed due to the wave of corporate mergers that occurred during those years.[22] A specific subset of institutions is also needed to revive the capital accumulation process after an economic crisis, which David Kotz calls the core of the SSA.[23] According to Kotz, the core institutions of a SSA moderate class conflict and capitalist competition during the long period of expansion.[24] During the monopoly capitalist SSA, a greater concentration of industry was one of the core institutions.[25] McDonough identifies several factors that contributed, including a growing market for industrial securities, New Jersey holding company legislation, and Sherman Act interpretations that permitted monopoly by merger.[26] A second core institution was an electoral shift towards the Republican Party at the federal level. Republican control of Congress and the Presidency in the early twentieth century led to policies that supported financial and industrial capitalists (e.g., protectionism).[27]
A third core institution that McDonough identifies with the monopoly capitalist SSA is the regulation of trusts rather than the breaking up of trusts.[28] The administration of Theodore Roosevelt would distinguish between trusts that were behaving responsibly and trusts that abused their power. It created a Bureau of Corporations in 1903 that would publicize abuses of economic power to keep large corporations in line.[29] A fourth core institution of the monopoly capitalist SSA is a new ideological system referred to as corporatism.[30] According to the corporatist ideology, cooperation among capital, labor, and the public was a worthwhile goal.[31] Through the National Civic Federation (NCF), founded in 1900, business leaders, political leaders, and labor leaders promoted cooperation among these entities.[32] This set of ideas thus helped create a stable environment for capital accumulation and economic growth.
A fifth core institution that McDonough identifies with the monopoly capitalist SSA is a change in capital-labor relations. This development consisted of two parts. The first part involved an effort to break the power that the skilled workers had over the production process. This goal was accomplished via the reduction of semi-skilled labor to a common denominator using highly mechanized production.[33] As machines began to perform more work, and the workers became more like operators of machinery than skilled craftsmen, the result was a loss of worker control over the production process. The second part of the change in capital-labor relations, according to McDonough, was the anti-union strategy that employers adopted.[34] As workers began to organize in response to their loss of control of production, employers implemented an open-shop policy,[35] which means that the employers did not recognize unions at all and would not distinguish between union members and non-union workers in the hiring process. In other words, the employer would only negotiate with individual workers rather than a collective body.
The final core institution that McDonough associates with the monopoly capitalist SSA is an imperialist strategy on the part of the United States beginning in the late 1890s. The U.S. aggressively sought to expand into foreign markets to offset the effects of the 1890s slump.[36] McDonough mentions the U.S. entry into the Spanish-American War, the annexation of Hawaii, the treatment of Cuba as a protectorate of the United States, and the annexation of the Philippines, Puerto Rico, and Guam.[37] President McKinley’s “Open Door” policy towards China was also part of the U.S. effort to establish itself as a dominant player in the sphere of international trade.[38]
Eventually, the monopoly capitalist SSA experienced a period of prolonged economic crisis. The world wars and the worldwide Great Depression represented a crisis of the institutions that had served capital accumulation in the early twentieth century. From the ashes of the old SSA rose a new set of institutions that established a foundation for rapid capital accumulation and economic growth in the post-World War II period. The postwar SSA, as McDonough calls it, had five core institutions.[39] According to McDonough, “the social influence of the war itself” was the organizing factor for this SSA.[40]
The first core institution of the postwar SSA is the Keynesian state. The Second World War demonstrated that Keynesian policies could be effective, and Keynesian economists began to acquire government positions.[41] Full employment became a goal and with the expansion of the public sector, changes in government spending or taxes could influence aggregate output.[42] Aggregate demand received a boost due to the 1947 Marshall Plan, which raised overseas demand, and the Korean War, which increased military spending.[43]
The third and fourth core institutions of the postwar SSA include the international dominance of the United States and the adoption of a Cold War ideology that guided U.S. policymaking after World War II. According to McDonough, the U.S. became the most powerful nation economically and militarily.[44] It used the 1944 Bretton Woods agreements and the 1947 Marshall Plan to establish “a worldwide capitalist economy open to American investment and export.”[45] The Truman doctrine of containment insisted on a connection between Soviet ideology and the tendency towards international expansion.[46] The Cold War ideology helped discourage the spread of socialist ideas and policies just as U.S. international military and economic dominance helped ensure the creation of a global capitalist order.
The fifth core institution of the postwar SSA involved a new relationship between capital and labor. Federal support for collective bargaining, as represented in the passage of the Wagner Act in 1935, led to the growth of membership in industrial unions. Industrial unions aim to organize all the workers in an industry like the automobile industry or the steel industry. The United Auto Workers (UAW) and the United Steelworkers of America (USWA) are examples of industrial unions. Craft unions, on the other hand, aim to organize all the workers with a specific skill, like carpenters or electrical workers. McDonough explains that during the postwar period, a rough equilibrium resulted between labor and management in which management granted automatic cost of living adjustments (COLAs) and productivity-linked wage contracts in exchange for management control of the production process.[47]
The final core institution of the postwar SSA was a shift towards the Democratic Party in national politics. The political realignment involved greater capitalist support for internationalization and a willingness to cooperate with organized labor.[48] It represented a departure from Republican support for protectionism and anti-union tactics, which dominated in the past.[49] Support for the Democrats in national elections came from labor unions, the lower-class vote, and capitalists in capital-intensive industries.[50]
Whereas the core institutions of the monopoly capitalist SSA were organized around the oligopolistic market structure of the early twentieth century, McDonough argues that the core institutions of the postwar SSA were organized around the characteristics of the war itself. He argues that even though a general principle of SSA construction appears to be at the center of each SSA, it seems to be a different principle with each SSA.[51] We are thus unable to predict the organizing principle of future SSAs or their timing.[52] Nevertheless, the power of the SSA framework lies in its ability to shed light on the historical factors that create a basis for rapid capital accumulation and economic growth. When those elements begin to unravel, the sources of widespread economic crisis also become clear when viewing capitalist history through the lens of SSA theory.
The Austrian Theory of the Business Cycle
In this section we consider a theory of the business cycle that Austrian economists developed. Ludwig von Mises and F.A. Hayek are the major contributors to this theory, although it has been refined and developed since they worked on the subject. Austrian economist Roger Garrison offers a helpful overview of the Austrian theory of the business cycle using a variety of graphs that facilitate a comparison with the Keynesian cross model.[53] This section borrows heavily from Garrison’s well-known essay to introduce students to the key elements of the Austrian perspective.[54]
In their business cycle theory, Austrian economists refer to capitalists and laborers. The two groups are not in conflict, however, which marks a major difference between the Austrian perspective and the Marxian and Post-Keynesian perspectives. Drawing upon Hayek’s work, Austrian economists use a graph to represent the structure of production. The structure of production has two key elements in Austrian theory: the quantity of capital employed and the period of production.[55] These two elements are positively related in Austrian economic theory. That is, when more capital is employed, a longer period of production becomes possible.[56] The graph that is used to represent the structure of production is referred to as a Hayekian triangle. An example of a Hayekian triangle, which Garrison modifies somewhat to look like a trapezoid,[57] is shown in Figure 14.6.
Figure 14.6 measures the aggregate production time (APT) on the horizontal axis and the dollar value of total output (Y) on the vertical axis. Beginning at point T and moving towards the origin, time passes. As time passes, the capital value increases as unfinished goods move closer to the point of completion when the consumption goods with a value of Y emerge.[58] Austrian economists regard labor and land as the original means of production because they have not passed through a prior production process.[59] The vertical portion in Figure 14.6 represents the value of land and labor employed in production at the start of the production period. Any increase in the value of output beyond that amount represents the contribution of capital alone and so no exploitation of labor-power exists in the Austrian model in contrast to Marxian theory.Figure 14.6 represents the rate of interest or the rate of profit for capitalists[60] because it shows how the capital value increases for each unit of time that passes in the production period. To understand how the rate of interest is determined in Austrian theory, we must consider the market for present goods. When laborers sell their labor services, it constitutes a demand for present goods (DPG) because they will spend their wages, and it represents a supply of future goods (SFG) because they will produce goods to be sold in the future.[61] This relationship can be expressed symbolically as follows:
Similarly, when capitalists purchase labor services, it represents a supply of present goods (SPG) because they must advance goods to laborers for present consumption and a demand for future goods (DFG) because they are postponing their own consumption in the present when they pay workers.[62] This relationship may also be represented symbolically:
Following Garrison,[63] the market for present goods is represented in Figure 14.7.
Figure 14.7 shows how an equilibrium interest rate and an equilibrium quantity exchanged of present goods is determined in the competitive market.[64] Laborers are represented on the demand side of the market, and capitalists are represented on the supply side of the market. We can think about the slopes of the curves as follows. When the rate of interest falls, laborers will prefer to save less and consume more today, which produces a downward sloping demand curve. When the interest rate rises, capitalists will anticipate greater profits by purchasing labor services and so they will supply more present goods. If the market is not in equilibrium due to a relatively high rate of interest, then the surplus of present goods implies a rise in savings that causes the rate of interest to fall. If the interest rate is below the equilibrium interest rate, then the shortage of present goods implies a reduction in saving and a rise in the rate of interest.
It is the time preferences of laborers and capitalists, however, that determine the positions of the supply and demand curves for present goods.[65]Time preference refers to an individual’s preference to consume in the present rather than in the future. If an individual has a high time preference, then consumption is preferred today much more than in the future. If an individual has a low time preference, then consumption is preferred in the future much more than in the present. In the market for present goods, a higher time preference for laborers would lead to a rise in the demand for present goods and a rightward shift of the demand curve. A lower time preference for laborers, on the other hand, would lead to a fall in the demand for present goods and a leftward shift of the demand curve.
Now consider how a change in time preferences alters the structure of production. A reduction in the time preferences of laborers will cause the demand for present goods to decline[66] and a leftward shift of the demand curve as shown in Figure 14.8.
The consequence of the decline in the demand for present goods is a reduction in the rate of interest and in the quantity of present goods exchanged in the market. Since workers demand fewer present consumption goods, investment rises as resources are released from consumer goods production.[67] Capital and labor are thus reallocated to lengthier production processes.[68] Real consumption falls temporarily but eventually rises when the new consumer goods enter the market. Consumer goods prices fall and so the dollar value of consumer goods declines even as real consumption rises.[69] Because output remains the same, we can see how consumption and investment now make up total output. Figure 14.8 shows how the structure of production has changed. The rise in investment causes the aggregate production period to lengthen. The slope of the Hayekian triangle is smaller due to the fall in the rate of interest. Finally, the value of the original means of production has fallen because fewer present goods are advanced for laborers causing the vertical portion of the Hayekian triangle (trapezoid) to be smaller.Figure 14.9 shows how a rightward shift of the supply curve affects the rate of interest and the equilibrium quantity of present goods exchanged.Figure 14.9 shows that the increase in the supply of present goods causes a reduction in the rate of interest and a rise in the equilibrium quantity of present goods exchanged. The result is a rise in investment as entrepreneurs observe the increased demand for future goods. More investment makes possible a longer aggregate period of production. The fall in the rate of interest makes the slope of the Hayekian triangle smaller as well. Finally, the vertical portion of the Hayekian triangle (trapezoid) becomes larger because more present goods are advanced to laborers. As in the case of a reduction in the demand for present goods, real consumption falls but only temporarily. Once the new consumer goods reach the market, real consumption expands.Figure 8, p. 187." href="/Bookshelves/Economics/Book:_Principles_of_Political_Economy_-_A_Pluralistic_Approach_to_Economic_Theory_(Saros)/03:_Principles_of_Macroeconomic_Theory/14:_Unorthodox_Theories_of_Macroeconomic_Crisis#footnote-392-72">[72]
Nothing in the Austrian analysis thus far suggests a cause of the business cycle. In fact, the economy will function without any major disruption as producers respond to shifts in the time preferences of laborers and capitalists. The major cause of depressions is found in central bank manipulation of the money supply. Austrian economists thus introduce the money supply into the analysis as an exogenous variable.[73] A major difference exists between Austrian monetary theory and neoclassical monetary theory. Whereas neoclassical economists argue that “new money is injected uniformly throughout the economy,” Austrian economists argue that injections of new money tend to fall into the hands of producers.[74] Figure 14.10 shows how Garrison represents neutral and non-neutral monetary expansions.[75]
The vertical axis shows the money stock before the expansion. The horizontal axis measures the money stock after the expansion. The 45-degree line is a reference line that shows us what happens when no monetary expansion occurs since the money stock is the same before and after the “expansion.” The neutral monetary expansion assumes that all capitalists and laborers receive the new money in the same proportion. The non-neutral monetary expansion, on the other hand, shows that the money in the hands of capitalists expands first before it spreads throughout the economy as capitalists pay wages to laborers. Eventually, the laborers and capitalists are affected in the same way due to the monetary expansion when the lines for each group coincide.Figure 14.11.
The return of the rate of interest to its original level causes the structure of production to return to its original state. The monetary expansion pushes the market rate of interest down below the natural rate of interest. It is the natural rate of interest in the Austrian model that is consistent with the time preferences of capitalists and laborers. The increase in investment causes a surge of demand for the remaining consumer goods because the time preferences of individuals have not actually changed.[78] The price of consumer goods relative to capital goods thus rises. Entrepreneurs recognize their error and begin to liquidate their investment projects.[79] The consequence is disinvestment on a large scale, and an economic crisis ensues. The source of economic crises is thus found in a misallocation of capital and what Austrian economists call forced saving because the shift towards investment goods does not reflect a real change in the time preferences of individuals.
Economic crises that Austrian economists explain using this theory of the business cycle include the Great Depression of the 1930s and the Great Recession of 2007-2009. The Federal Reserve is blamed for expanding the money supply and artificially pushing down the rate of interest. The result was excessive investment in the 1920s and in the early 2000s in the housing market or in the 1990s in the IT sector. Eventually, the errors of entrepreneurs became apparent and investment projects were abandoned, leading to major economic contractions. According to Snowdon et al., an iron law of retribution exists.[80] That is, the greater the monetary expansion and economic boom, the greater the contraction and disinvestment to follow will be. In fact, the correction to the economy might be so great that the disinvestment might lead to capital consumption where the economy ends up with a smaller capital stock than it possessed at the beginning of the process.[81] If the government provides consumer credits (i.e., cash subsidies for laborers) to pump up demand, it will boost the demand for consumer goods and alter relative prices in favor of consumer goods even more. The result will be an even larger contraction of investment projects that makes the economic crisis worse.[82]
The Austrian theory of the business cycle is noteworthy because it offers a theory of capitalist crises that assigns a central role to the difference between capitalists and laborers even as it places the blame on government intervention and central bank manipulation of the money supply. It also recognizes that entrepreneurs do not have perfect foresight and that they may make mistakes when they increase investment in response to a drop in the market rate of interest that stems from a monetary expansion. Finally, it provides an alternative to Keynesian theory when thinking about the factors that influence aggregate investment, the aggregate production period, the rate of interest, and aggregate output.
Post-Keynesian Effective Demand Theory versus the Neoclassical Synthesis Model
Like neoclassical economists, Post-Keynesian economists recognize that changes in key macroeconomic variables influence aggregate output and employment. Unlike neoclassical economists, however, Post-Keynesian economists place much emphasis on the class-based distribution of income. We may begin this discussion with the simple fact that aggregate output or aggregate income (Y) can be decomposed into aggregate wages (W) and aggregate profits (П) as follows:
When the distribution of income is represented as a division between wages and profits, it is referred to as the functional distribution of income.
Post-Keynesian economists agree with neoclassical economists that aggregate expenditure (A) may be written as the sum of the major spending components from the national income and product accounts.
Aggregate expenditure thus represents the sum of consumer spending (C), investment spending (I), government spending (G), and net exports (X – M). Net exports are calculated as the difference between exports (X) and imports (M).
Post-Keynesian economists also agree with the macroeconomic equilibrium condition that aggregate output (Y) equals aggregate planned expenditure (A), as shown below:
If we substitute the expression for aggregate income and the expression for aggregate expenditure into the equilibrium condition, we obtain the following result:
To further modify this equation, let’s divide aggregate consumer spending into the consumer spending by capitalists (Cc) and the consumer spending by workers (Cw) as follows:
Workers’ consumption may be rewritten as what remains of workers’ wages after they have paid their taxes (T) and set aside a portion to be saved (Sw).
The equilibrium condition (Y = A) may now be written as follows:
Eliminating aggregate wages from both sides and rearranging the terms, we obtain the following result:[83]
This result relates the equilibrium aggregate profit in the economy to various components of aggregate spending, such as the government budget gap (G – T) and the trade balance (X – M). That is, this equation allows us to understand how aggregate profits change over the course of the business cycle as different components of aggregate spending change. For example, if investment spending increases, then aggregate profits will rise, other factors held constant. Whereas neoclassical Keynesian economists focus on the impact of a rise in investment spending on aggregate output, Post-Keynesian economists focus on the impact on aggregate profits. Because aggregate wages do not change when investment spending rises, aggregate profits increase relative to aggregate wages. Capitalists thus gain relative to workers, and income inequality worsens.
Now consider how changes in the government budget affect profitability and the distribution of income. If government spending increases and taxes fall, then both factors create a larger government budget deficit. Deficit spending increases the equilibrium aggregate profits in the economy just as it increases the equilibrium output. With unchanged wages, the result is an increase in aggregate profits relative to aggregate wages and a rise in income inequality as the economy grows. Hence, higher government spending or tax cuts can worsen inequality even as they stimulate the economy.
If the level of net exports increases due to a rise in exports or a reduction in imports, then the result is a higher level of aggregate profits. With aggregate profits rising relative to aggregate wages, the result is worsening income inequality. At the same time, aggregate output and employment increase with rising net exports. We can conclude then that a trade surplus boosts economic growth in the short run, but it also worsens the class-based distribution of income. A trade deficit has the opposite effects. Because net exports are negative in the case of a trade deficit, the result is a lower level of aggregate output and employment. With falling profitability, the result is a reduction in income inequality.
Another component of aggregate spending that can influence the equilibrium level of aggregate profits is capitalist consumption. If capitalists increase their aggregate consumption level, then the economy receives a boost. The rise in aggregate consumption increases equilibrium output but also aggregate profits. The consequence is worsening income inequality because aggregate profits rise relative to aggregate wages. Here we can see the Marxian roots of Post-Keynesian economics at play. In Marx’s two-sector macroeconomic model discussed earlier in this chapter, capitalist consumption makes possible the realization of surplus value in both sectors. Similarly, in this Post-Keynesian model, capitalist consumption enhances the profitability of capitalists. Also, in Marxian economics, workers are paid according to the value of labor-power. If aggregate wages are determined according to the value of aggregate labor-power, then wages will be relatively stable. Rising profits and aggregate income then tend to worsen income inequality over the course of the business cycle. The connection to Marxian economics is not a perfect one, however, because Marxists also argue that wages tend to rise and fall over the course of the business cycle as wages rise above and fall below the value of labor-power.
Finally, a rise in workers’ savings will influence the equilibrium aggregate profits in the economy. For example, if workers save more, then aggregate demand falls, which reduces the equilibrium aggregate output and the equilibrium aggregate profits. Income inequality lessens due to increased saving on the part of workers as aggregate profits fall relative to aggregate wages.
The major difference between this Post-Keynesian approach to macroeconomic fluctuations and the neoclassical synthesis model is that neoclassical economists only focus on changes in the equilibrium level of output over the course of the business cycle. Post-Keynesian economists, on the other hand, also emphasize changes in profitability and the distribution of income as the economy experiences economic booms and busts.
In a recent news article in The Sydney Morning Herald, Eryk Bagshaw describes the serious unemployment problem facing Australia. In Marxian terms, the nation suffers from a large reserve army of the unemployed. As described in this chapter, when unemployment is high, wages decline. The lower labor costs help transform an economic downturn into a period of economic expansion. In Australia’s case, however, even government efforts that have created millions of jobs have not been enough to reduce the reserve army of the unemployed. According to Bagshaw, “wages growth remains stuck at close to historic lows and the unemployment rate is rising.” The reason that job growth has not reversed the trend of wages, Bagshaw explains, is that population growth and a rise in the labor force participation rate have kept the unemployment rate high even as new jobs are created. Bagshaw explains that older workers and women have entered the workforce in large numbers, which indicates a more productive population but also puts downward pressure on wages. He describes what amounts to an underconsumption problem stemming from low wage growth. That is, “[l]ower wages means less spending, less spending means slower growth,” and economic growth has been sluggish in Australia recently.
Bagshaw also explains that underemployment is close to an all-time high at 8.5%. These workers are employed part-time but would prefer full-time work. As a result, their presence puts downward pressure on wages as well. Bagshaw states that “employers don’t need to increase wages because there is plenty of demand for work.” Plenty of demand for work translates into a large supply of labor-power, which keeps wages down. Combining the unemployment and underemployment rates, Bagshaw reports the figure at 13.8% with 1.9 million Australians either unemployed or underemployed out of a workforce of 13.6 million. Bagshaw explains that wages increased nearly four percent prior to the 2008 global financial crisis when underutilization of the nation’s resources was much lower. In Marxian terms, the reserve army of the unemployed was much smaller and upward pressure on wages was occurring. Bagshaw also reports estimates of the Australian natural rate of unemployment (i.e., what is regarded as full employment in neoclassical terms) to be between 4.5 and 5 percent. What a neoclassical economist would regard as the natural rate of unemployment, a Marxian economist would regard as a reserve army of the unemployed that is small enough that wages begin to grow significantly. Once again, we see how economists from different schools of economic thought may understand economic phenomena in radically different ways.
For an Austrian interpretation of these events, consider the recent decision of the Reserve Bank of Australia, the nation’s central bank, to cut interest rates to a record low of 0.75%, as reported by Bagshaw. Such intervention forces the market rate of interest down below the natural rate of interest, which promotes an artificial boom and overinvestment in capital goods. Because the time preferences of capitalists and laborers have not changed, consumer goods prices will be pushed upwards, eventually leading to disinvestment and an economic crisis that is more severe than the present one.
Summary of Key Points
A general rate of profit and prices of production are formed when capital flows out of industries with relatively high organic compositions of capital and into industries with relatively low organic compositions of capital.
Other factors held constant, a longer turnover time reduces the annual rate of profit, and a shorter turnover time increases the annual rate of profit.
Other factors held constant, a rise in the organic composition of capital over long periods causes the general annual rate of profit to fall, which produces economic crises.
Several countertendencies operate to prevent a decline in the general rate of profit, including an increase in the rate of surplus value, a reduction in wages below their value, a cheapening of the elements of constant capital, and a shortening of the turnover processes of different capitals.
During periods of rapid capital accumulation, money wages rise above the value of labor-power as the reserve army of the unemployed declines and the rate of profit falls, which ultimately produces an economic crisis. During periods of economic contraction, money wages fall below the value of labor-power as the reserve army of the unemployed expands and the rate of profit begins to rise, which eventually makes an economic recovery possible.
In Marx’s two-sector model, the constant capital employed in Sector 2 must equal the sum of the variable capital and the surplus value in sector 1. Otherwise, discoordination across sectors will occur at the macroeconomic level, and an economic crisis will occur.
According to Richard Wolff, stagnant wages and rising productivity have made possible a major expansion of surpluses and lending since the 1970s, which set the stage for the 2008 financial crisis and the Great Recession of 2007-2009.
Social structure of accumulation (SSA) theory is a framework that radical political economists use to understand how human institutions contribute to long periods of rapid capital accumulation and economic growth.
According to Terence McDonough, the organizing principle of the monopoly capitalist SSA is the oligopolistic market structure of the early twentieth century, and the organizing principle of the postwar SSA is the social influence of the Second World War.
Austrian business cycle theory maintains that the structure of production depends on the aggregate period of production and the quantity of capital employed in production.
Austrian business cycle theorists argue that the structure of production may change when the time preferences of capitalists and laborers change. It may also change when the central bank creates an artificial boom via monetary expansion, but in the latter case, an economic crisis will follow when entrepreneurs realize that they have misjudged the time preferences of the consuming public.
The Post-Keynesian theory of effective demand clarifies how the equilibrium profits of the economy and the degree of income inequality change in response to changes in the components of aggregate spending.
List of Key Terms
Social structure of accumulation (SSA) theory
Organic composition of capital (OCC)
General rate of profit (r)
Prices of production
Turnover time
Annual rate of surplus value
Annual rate of profit
Annual mass of surplus value
General annual rate of profit (rA*)
General annual rate of surplus value (eA*)
Law of the tendency of the rate of profit to fall (LTRPF)
Industrial reserve army of the unemployed
Natural unemployment
Simple commodity circuit
Say’s Law of Markets
Means of consumption
Simple reproduction
Mortgage-backed securities (MBSs)
Collateralized debt obligations (CDOs)
Subprime mortgage loans
Credit rating agencies
Conflict of interest
Social structure of accumulation (SSA)
Post-Civil War SSA
Primitive accumulation
Monopoly capitalist SSA
Core of the SSA
Postwar SSA
Industrial unions
Craft unions
Structure of production
Hayekian triangle
Original means of production
Time preference
High time preference
Low time preference
Neutral monetary expansion
Non-neutral monetary expansion
Producer credits
Market rate of interest
Natural rate of interest
Forced saving
Iron law of retribution
Capital consumption
Consumer credits
Aggregate wages (W)
Aggregate profits (П)
Functional distribution of income
Equilibrium aggregate profit
Government budget gap
Trade balance
Problems for Review
1. Consider an economy with only two capitalist enterprises. Assume that enterprise A advances weekly constant capital of $200 and weekly variable capital of $100. Assume that enterprise B advances weekly constant capital of $100 and weekly variable capital of $200. Also assume that enterprise A has a turnover time of 4 weeks and enterprise B has a turnover time of 8 weeks. Calculate the annual rate of profit and the annual rate of surplus value assuming the weekly rate of surplus value is 100% for both enterprises and that each year has 52 weeks. How do the annual rates of profit compare? Is this result surprising? Explain the result with reference to the organic compositions of capital and to the turnover times of the two enterprises.
2. Suppose competition among capitalists in the international commodity markets has pushed down the prices of imported raw materials that are used in many domestic industries. What is the impact on the aggregate constant capital advanced? What is the impact on the organic composition of capital at the aggregate level? What is the impact on the annual general rate of profit? How are these changes important in terms of the long-term trajectory of the domestic capitalist economy?
3. Suppose that a critic of Marxian economics argues that surplus value cannot persist within capitalist economies because competition among capitalists for the source of surplus value (i.e., labor-power) will drive up wages until all the surplus value vanishes. The critic concludes that profits must have their source elsewhere. How can Marxian economic theory be used to refute this argument?
4. Consider an economy with two major sectors: Sector I produces the means of production, and Sector II produces the means of consumption. Suppose that the constant capital advanced in Sectors I and II are $20 billion and $30 billion, respectively. Assume that the variable capital advanced in Sectors I and II are $20 billion and $10 billion, respectively. Also assume that the rate of surplus value is 100% in each sector. Is the economy balanced or will a macroeconomic crisis occur due to discoordination between the two sectors? Explain with reference to the numerical values in this example.
5. Consider the conflict of interest that arose for the credit rating agencies leading up to the financial crisis of 2008. What do you think is the best way to limit such conflicts of interest that might arise in financial markets?
6. Create a table with two columns. In one column, list the core institutions of the monopoly SSA. In the second column, list the core institutions of the postwar SSA. Try to arrange the sets of institutions so that they correspond to each other as much as possible. Finally, compare the core institutions of the two SSAs and note how they differ and how they are similar.
7. Consider Austrian business cycle theory when answering this question. Suppose that laborers experience an increase in their time preferences. How will the market for present goods be affected? Draw the changes on a graph and explain in words what is happening. How will the structure of production be affected? Draw the changes on a graph and explain in words what is happening. Be sure to refer to the aggregate period of production, the rate of interest, and the level of investment when answering this question.
8. Consider Post-Keynesian theory when answering this question. Suppose that workers reduce their saving. What will happen to capitalist profits and the degree of income inequality? To which phase of the business cycle does this change correspond? Is this change consistent with what you would expect to happen using the neoclassical synthesis model?
For Marx’s analysis of the countertendencies to the law of the falling rate of profit, see Marx (1991), p. 339-348. ↵
The modeling approach used in Figures 14.1 and 14.2 is inspired by the approach found in Lianos (1987). Lianos’s use of this approach in the context of financial markets is discussed in Chapter 15. ↵
I am deeply grateful to Dr. Garrison for granting me permission to include an extensive summary of his argument. Of course, any errors of interpretation are solely my responsibility. ↵


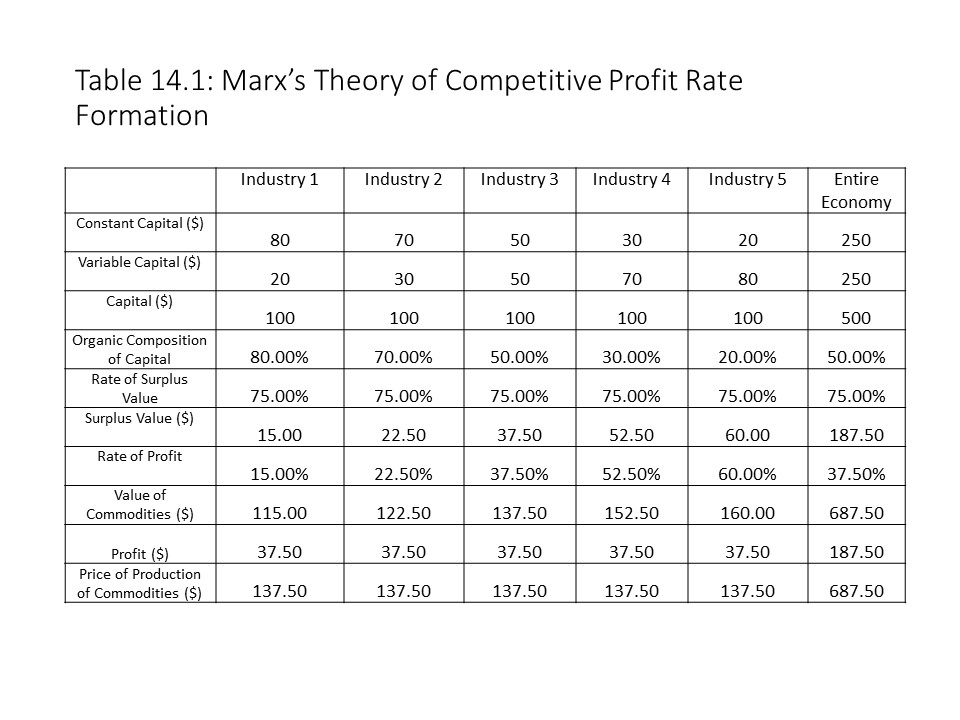 Because each industry has a different organic composition of capital (OCC) (i.e., a different ratio of constant capital to total capital), the rates of profit differ. The industries with higher rates of profit have lower organic compositions of capital. The industries with lower rates of profit have higher organic compositions of capital. It was previously explained that the industries with higher profit rates employ relatively more variable capital because labor-power is the source of value and surplus value. Because capital has a strong tendency to flow out of industries with low rates of profit and into industries with high rates of profit, the rate of profit tends to equalize across all industries as prices fall in the industries with high profit rates and prices rise in industries with low profit rates. The uniform, general rate of profit (r) in this example is calculated in the following way, where S, V, and C refer to aggregate surplus value, aggregate variable capital, and aggregate constant capital, respectively:
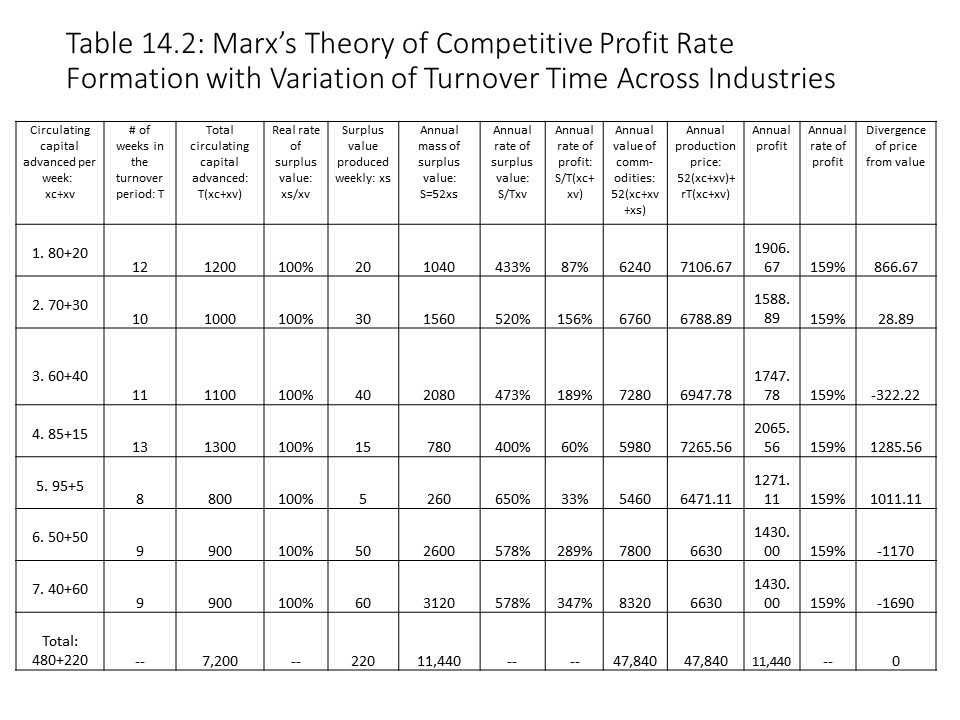 To calculate the general annual rate of profit(rA*), we need to add up the annual mass of surplus value across all industries and then divide by the total capital advanced across all n industries as follows:
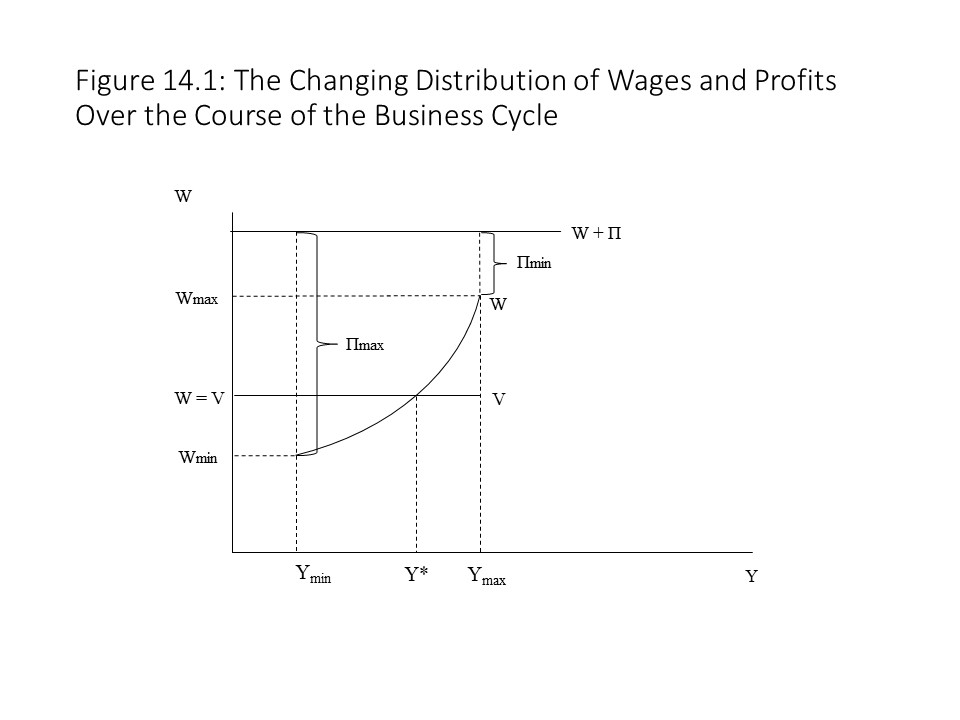 Figure 14.1 shows the value of labor-power and thus the variable capital (V) to be stable. The money wage, however, is not stable and responds to the expansion and contraction of the industrial reserve army of the unemployed. The industrial reserve army of the unemployed is the name that Marxian economists give to the large pool of unemployed workers that always exists within capitalist societies. It might expand or contract at different times, but it is a continuous feature of market capitalist economies. During periods of economic expansion, the reserve army of the unemployed decreases because capitalists are aggressive in their hiring. The aggressive hiring creates a shortage of labor-power and wages begin to rise above the value of labor-power. The aggregate money wages (W) thus rise above the variable capital (V), which is the value that would be advanced if the wage paid was equal to the value of labor-power. During periods of economic contraction, on the other hand, the reserve army of the unemployed increases because capitalists dismiss workers as production slows. The rapid dismissal of workers creates a large surplus of labor-power and wages fall below the value of labor-power. The aggregate money wages spent now fall below the variable capital advanced, which again is the amount that would be spent on wages if the wage equaled the value of labor-power.
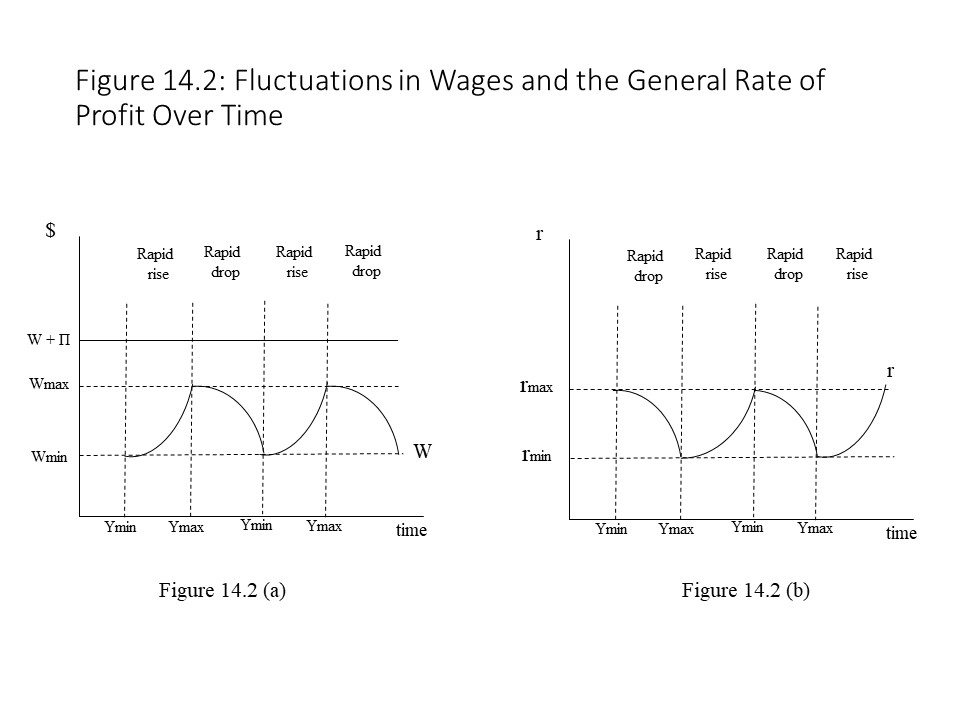 Figure 14.2 (a) shows aggregate wages rising rapidly during the economic expansion and squeezing profits to a minimum level. In Figure 14.2 (a) profits are represented as the difference between aggregate wages and aggregate value added (W+П). At the start of the economic crisis, however, unemployment soars and wages begin to drop. This reduction in wages occurs quickly and helps to restore profitability until the next expansion begins. Figure 14.2 (b) shows how the general rate of profit follows the opposite pattern relative to aggregate wages as production changes over the course of the business cycle. Because we are now thinking in terms of profits and wages as opposed to surplus value and variable capital, let’s write the general rate of profit as follows:
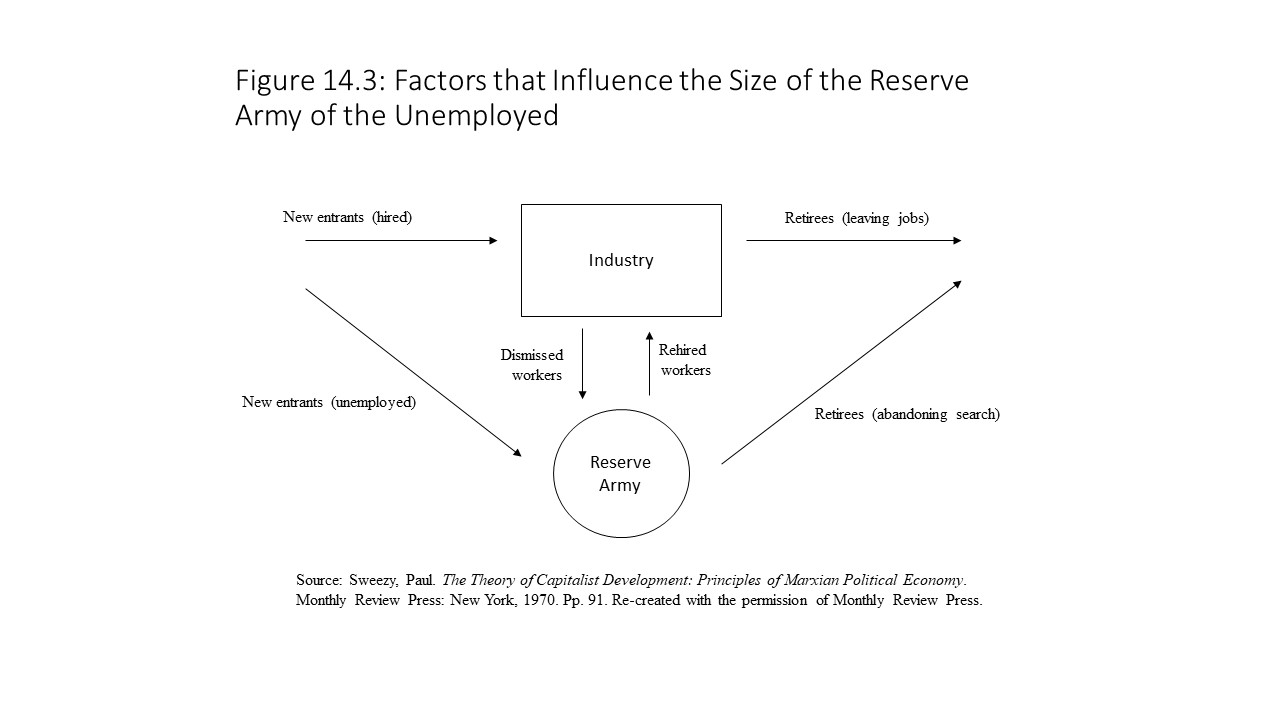
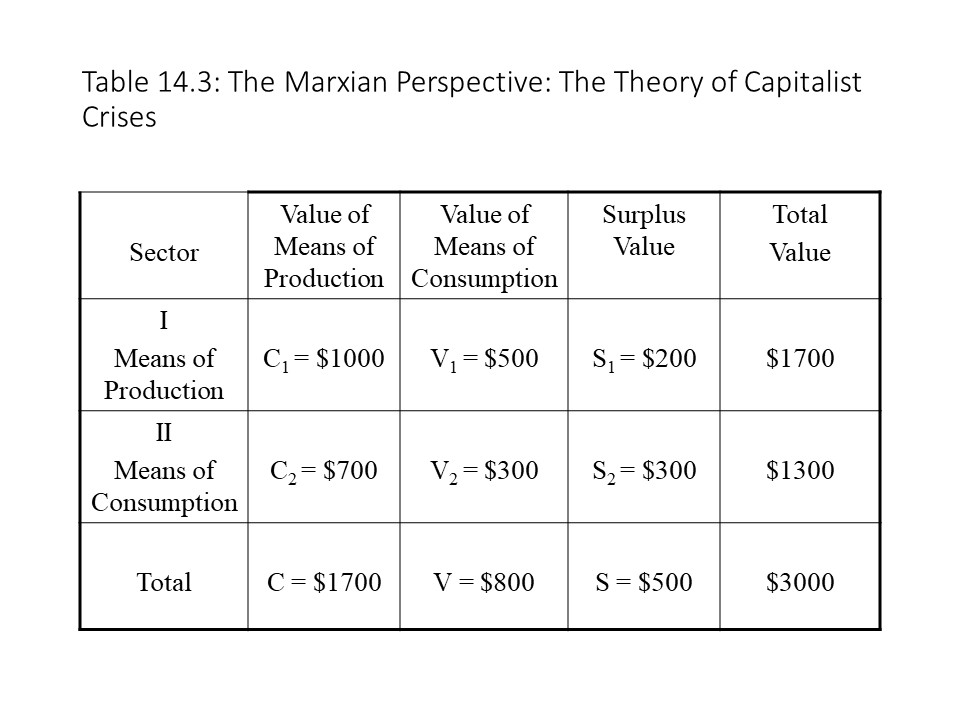 In Table 14.3, one sector produces means of production and another sector produces means of consumption. The means of consumption include both the means of subsistence for workers and luxury commodities for capitalists. Simple reproduction characterizes this economy. That is, capitalists do not reinvest the surplus value to expand production and so no capital is accumulated. To see that simple reproduction exists in this economy, consider the total constant capital advanced (C). The $1700 of constant capital that is advanced is exactly equal to the value of the means of production produced in Sector I. That is, the demand for means of production exactly equals the supply of means of production. Now consider the total variable capital advanced (V) and the total surplus value (S) realized from the sale of the total social product. The $800 of wages paid to workers plus the $500 of surplus value that capitalists appropriate is just sufficient to purchase the entire $1300 of means of consumption produced in Sector II. That is, the demand for means of consumption is exactly equal to the supply of means of consumption. Since aggregate supply and aggregate demand are the same, and all surplus value is spent on luxury commodities, simple reproduction exists in this economy.
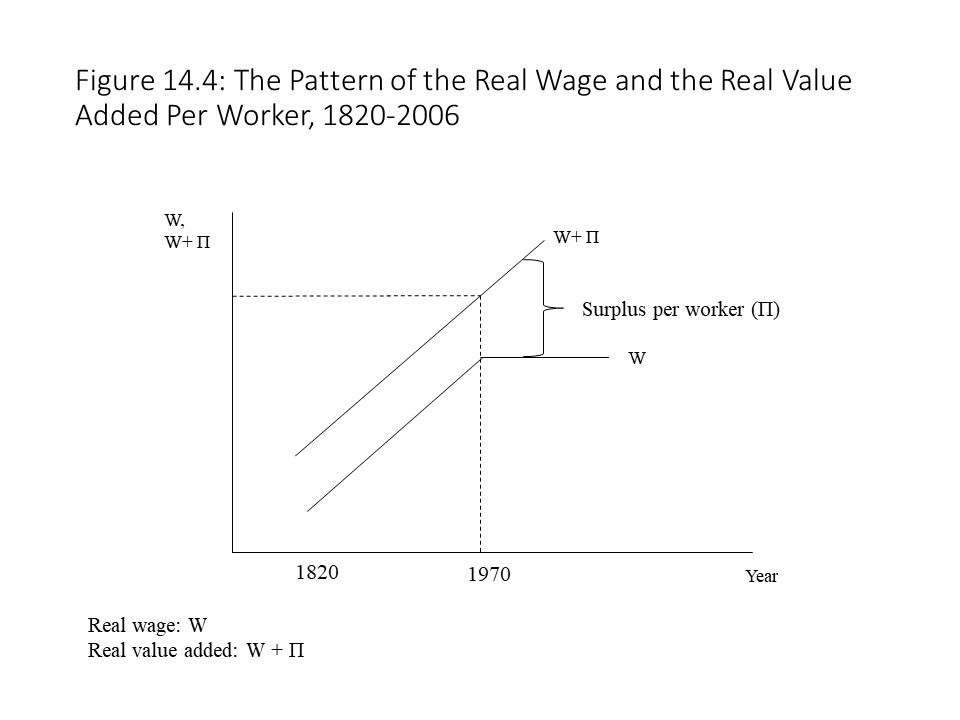 Figure 14.4 shows a gradual increase in real wages beginning in 1820 with stagnation beginning in the 1970s. Real value added per worker, on the other hand, is depicted as rising continuously up to the present time. Fluctuations are omitted from the graph to focus on the long-term trends that Wolff emphasizes. The difference between real value added per worker and the real wage represents the surpluses extracted from workers.
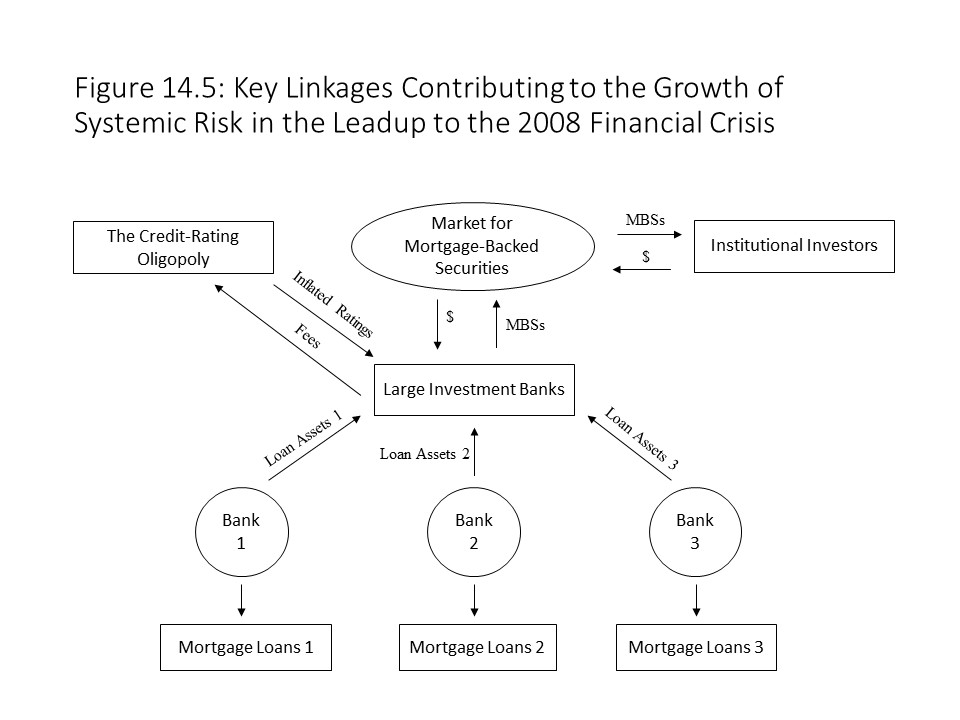 Figure 14.5 shows how commercial banks loaned money to homebuyers for the purchase of homes. The banks then sold those mortgage loan assets to investment banks, which bundled the mortgages to create MBSs. The rating agencies then gave these securities inflated ratings to promote their further creation and sale. The newly issued securities were then sold in the financial marketplace to institutional investors such as pension funds, hedge funds, and mutual fund companies.
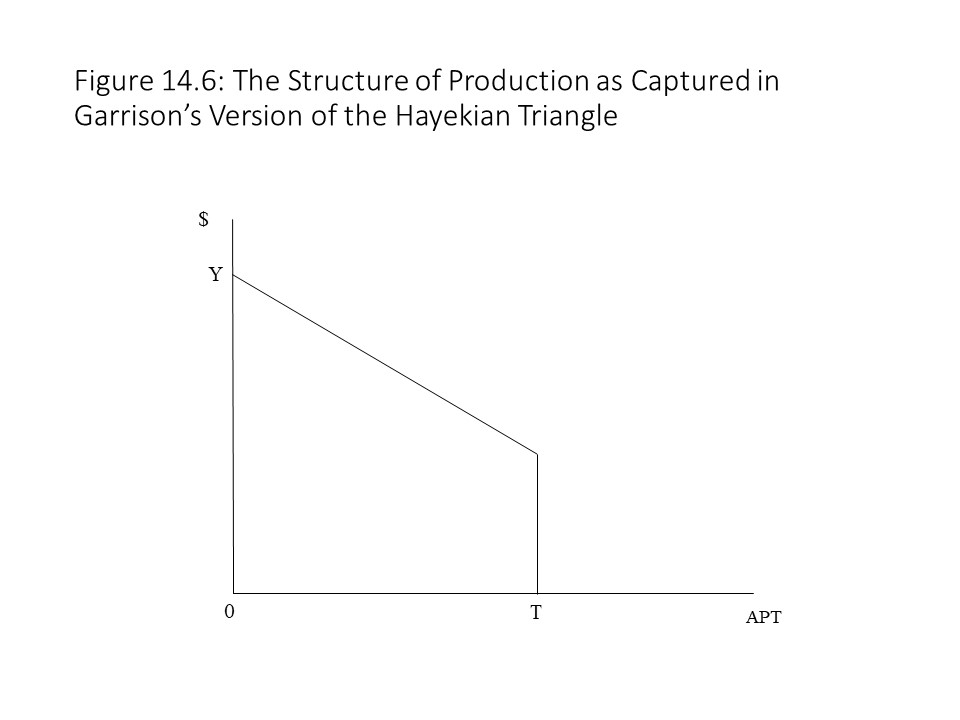 Figure 14.6 measures the aggregate production time (APT) on the horizontal axis and the dollar value of total output (Y) on the vertical axis. Beginning at point T and moving towards the origin, time passes. As time passes, the capital value increases as unfinished goods move closer to the point of completion when the consumption goods with a value of Y emerge.[58] Austrian economists regard labor and land as the original means of production because they have not passed through a prior production process.[59] The vertical portion in Figure 14.6 represents the value of land and labor employed in production at the start of the production period. Any increase in the value of output beyond that amount represents the contribution of capital alone and so no exploitation of labor-power exists in the Austrian model in contrast to Marxian theory.
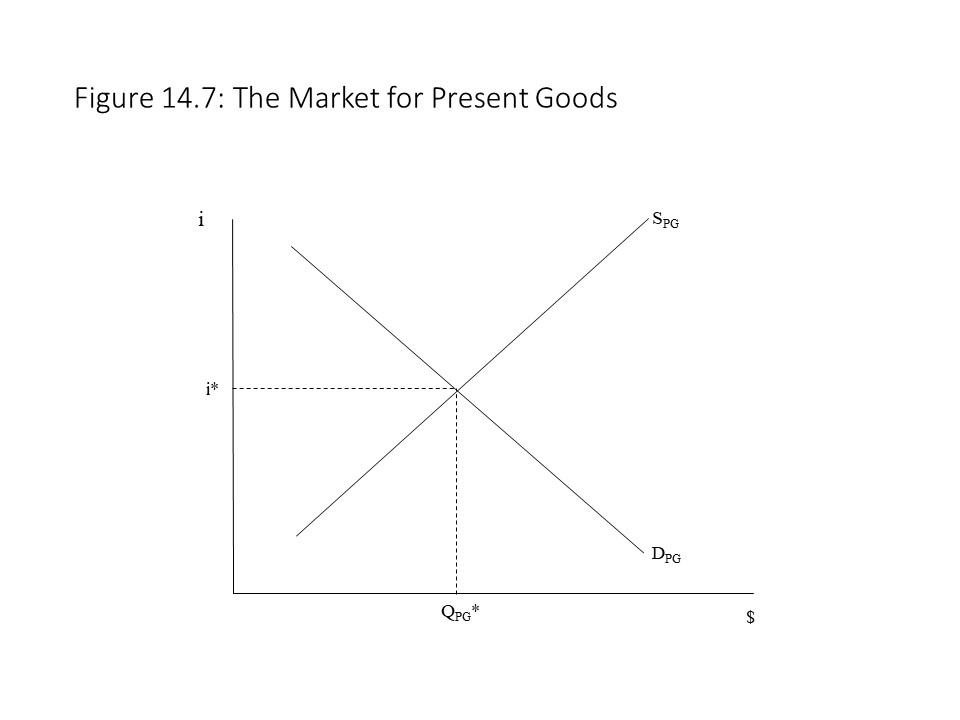 Figure 14.7 shows how an equilibrium interest rate and an equilibrium quantity exchanged of present goods is determined in the competitive market.[64] Laborers are represented on the demand side of the market, and capitalists are represented on the supply side of the market. We can think about the slopes of the curves as follows. When the rate of interest falls, laborers will prefer to save less and consume more today, which produces a downward sloping demand curve. When the interest rate rises, capitalists will anticipate greater profits by purchasing labor services and so they will supply more present goods. If the market is not in equilibrium due to a relatively high rate of interest, then the surplus of present goods implies a rise in savings that causes the rate of interest to fall. If the interest rate is below the equilibrium interest rate, then the shortage of present goods implies a reduction in saving and a rise in the rate of interest.
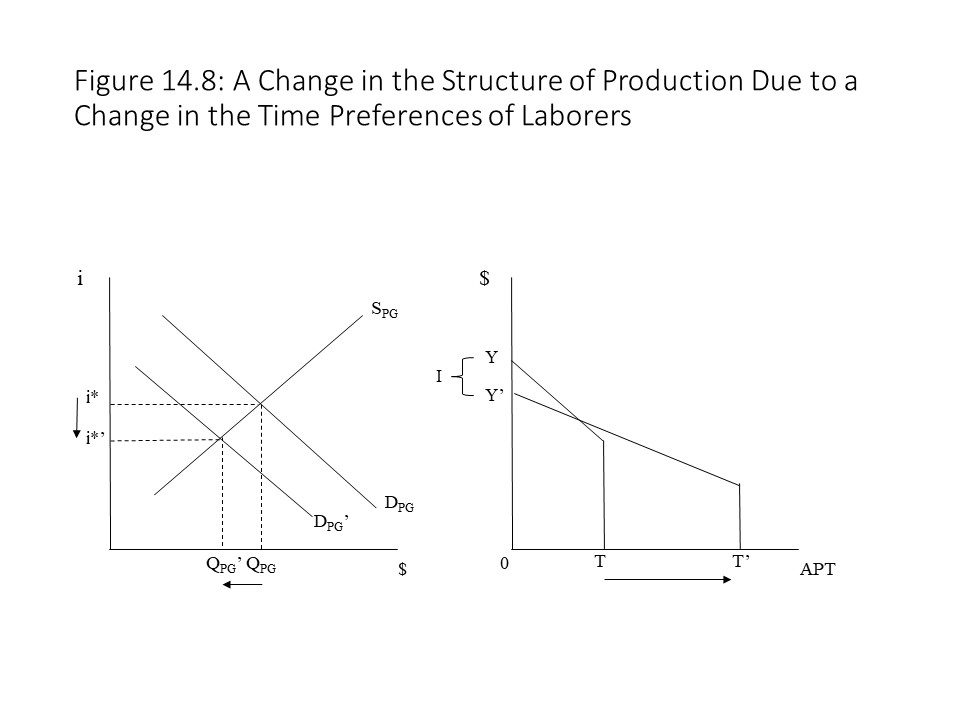 The consequence of the decline in the demand for present goods is a reduction in the rate of interest and in the quantity of present goods exchanged in the market. Since workers demand fewer present consumption goods, investment rises as resources are released from consumer goods production.[67] Capital and labor are thus reallocated to lengthier production processes.[68] Real consumption falls temporarily but eventually rises when the new consumer goods enter the market. Consumer goods prices fall and so the dollar value of consumer goods declines even as real consumption rises.[69] Because output remains the same, we can see how consumption and investment now make up total output. Figure 14.8 shows how the structure of production has changed. The rise in investment causes the aggregate production period to lengthen. The slope of the Hayekian triangle is smaller due to the fall in the rate of interest. Finally, the value of the original means of production has fallen because fewer present goods are advanced for laborers causing the vertical portion of the Hayekian triangle (trapezoid) to be smaller.
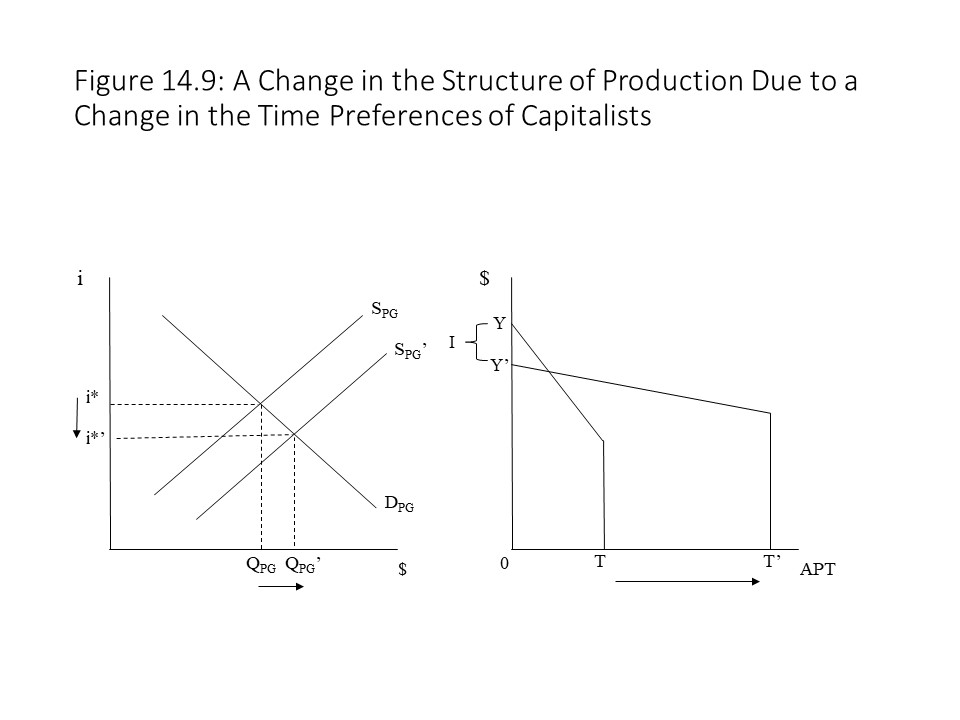 Figure 14.9 shows that the increase in the supply of present goods causes a reduction in the rate of interest and a rise in the equilibrium quantity of present goods exchanged. The result is a rise in investment as entrepreneurs observe the increased demand for future goods. More investment makes possible a longer aggregate period of production. The fall in the rate of interest makes the slope of the Hayekian triangle smaller as well. Finally, the vertical portion of the Hayekian triangle (trapezoid) becomes larger because more present goods are advanced to laborers. As in the case of a reduction in the demand for present goods, real consumption falls but only temporarily. Once the new consumer goods reach the market, real consumption expands.
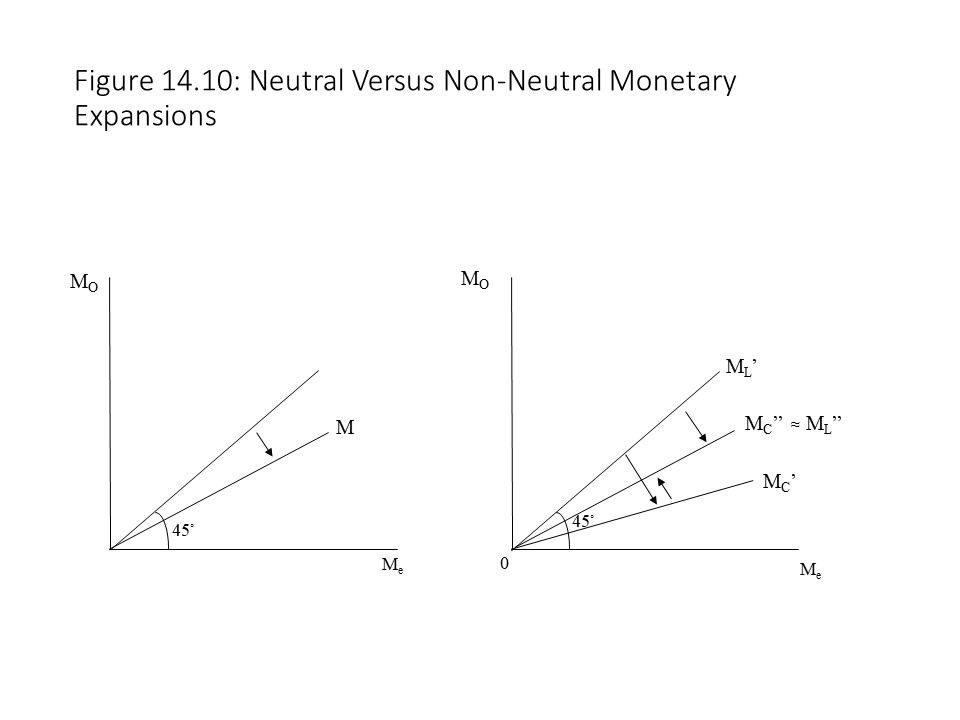 The vertical axis shows the money stock before the expansion. The horizontal axis measures the money stock after the expansion. The 45-degree line is a reference line that shows us what happens when no monetary expansion occurs since the money stock is the same before and after the “expansion.” The neutral monetary expansion assumes that all capitalists and laborers receive the new money in the same proportion. The non-neutral monetary expansion, on the other hand, shows that the money in the hands of capitalists expands first before it spreads throughout the economy as capitalists pay wages to laborers. Eventually, the laborers and capitalists are affected in the same way due to the monetary expansion when the lines for each group coincide.
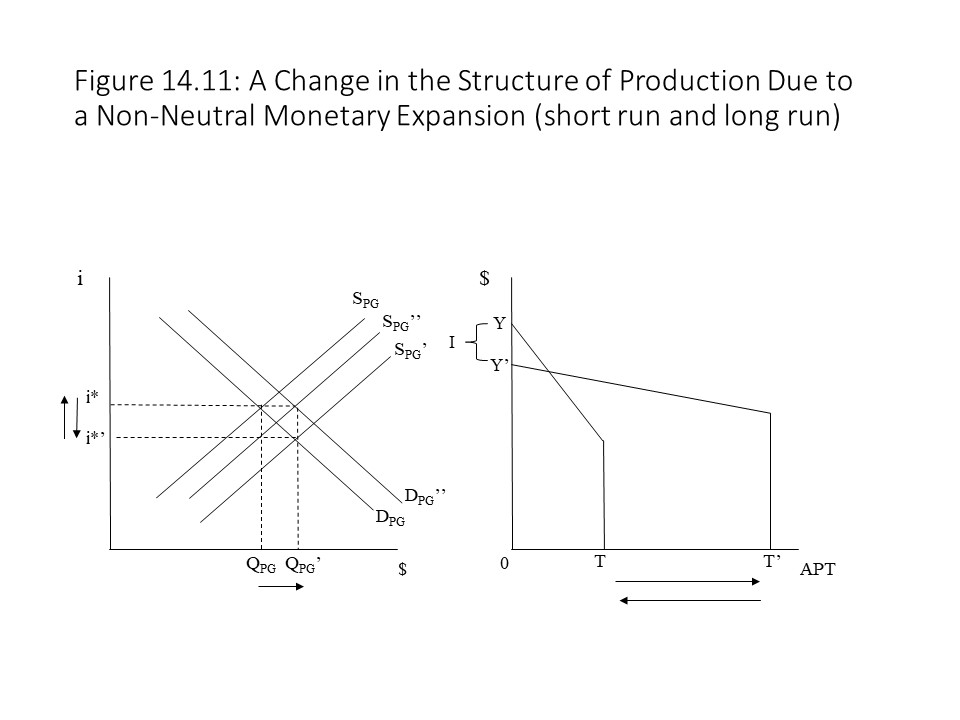 The return of the rate of interest to its original level causes the structure of production to return to its original state. The monetary expansion pushes the market rate of interest down below the natural rate of interest. It is the natural rate of interest in the Austrian model that is consistent with the time preferences of capitalists and laborers. The increase in investment causes a surge of demand for the remaining consumer goods because the time preferences of individuals have not actually changed.[78] The price of consumer goods relative to capital goods thus rises. Entrepreneurs recognize their error and begin to liquidate their investment projects.[79] The consequence is disinvestment on a large scale, and an economic crisis ensues. The source of economic crises is thus found in a misallocation of capital and what Austrian economists call forced saving because the shift towards investment goods does not reflect a real change in the time preferences of individuals.