A common organizational and orientating technique used by individual course designers as well as instructional design teams is the use of visual models that serve to clearly outline the details, concepts, and content of the course being planned. Designers use various visual approaches, ranging from simple matrix tables to complex concept maps and storyboards.
Concept Mapping
The practice of concept mapping was first originated in the 1960s by Joseph Novak (1977), while he was a professor at Cornell University. Many instructors are familiar with the use of concept maps for student learning, especially to help students investigate and brainstorm conceptual ideas. Concept maps consist of nodes (often drawn as ovals, circles or squares) that represent concepts, and connector links drawn as arcs, lines or arrows to represent the relationships between the nodes. The concept nodes are labelled, one for each idea or concept. Sometimes, the connector lines are also labelled.
Concept maps can also be used to plan educational experiences and provide a visual representation of the planned course objectives, outcomes, activities, resources, and evaluation. They help the design team visualize how the content should be linked and sequenced. As a team activity, concept mapping can help all members brainstorm ways to create a dynamic environment for learning the course-specific content. This mapping process produces a formal, step-by-step visual representation of the key components, and the connections and leveling between the components.
The ultimate structure and linking arrangement is very similar to the way a website is planned by designers. It is very helpful to the entire team to be able to see how the various course components should be arranged for effective learning and ease of use. Since Novak (1977) first introduced concept mapping, a variety of styles have emerged. The most common is called a spider concept map where a key overall concept is placed in a large oval or square node that then branches out to smaller nodes. The links that connect these nodes create an image that looks like a spider’s web. Other configurations include hierarchical maps, landscape maps (an example is the image map at the beginning of this chapter), and systems maps.
“Concept mapping is useful for knowledge management as a vehicle for externalizing “internal” expert knowledge, to allow that knowledge to be examined, refined, and reused”. (Canas, Leake & Wilson, 1999, p. 14)
Concept Map Creation
Every concept map possesses four core elements:
Patterns—the overall structure of the map, e.g., a circular, central hub structure; a top-down hierarchical structure, a mandala (a complex geometric shape), a flow-chart, and so on.
Nodes—the geometric shapes such as ovals or rectangles used to represent the individual concepts. Often these nodes are colour-coded to signify importance of or relationships among the various concepts
Connector links—the lines, arrows, and curves used to indicate the relationships between concept nodes. Often a solid line is used to show a distinct relationship; an arrow refers to a causal relationship; while a dotted line shows a weaker, secondary relationship. An arc often represents a circular flow between concepts.
Connector words—help to clarify the relationships between concept nodes. Common connector words include: based on, controlled by, including, may lead to, recognizes, part of, next step, recognizes, validates, stored in.
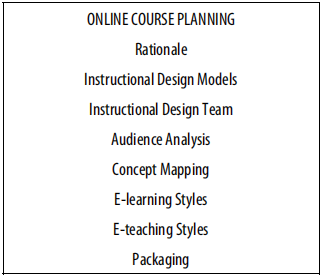
The first step in using concept mapping for course design is to create a textual structure of the course concepts, both major and supportive. Usually, these concepts are arranged in a list that shows the basic foundational order and relationships of the concepts to be covered in the content. Once this is done, the concept map can be initiated. For example, if a design team were planning to design a course on how to plan an online course, the main concepts might include:
Figure \(\PageIndex{1}\): Concepts used for spider concept map
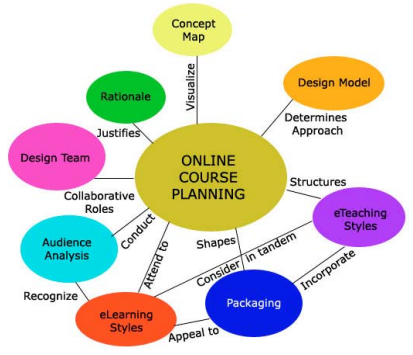
The concepts in Figure \(\PageIndex{1}\) are already mapped, using a landscape map approach discussed at the beginning of this chapter. If a spider map pattern had been used, the map might look like Figure \(\PageIndex{2}\) below. This sort of map is useful when first brainstorming the initial concepts of a course or design process. It will also appeal to design team members who like to plan and brainstorm in flexible, circular (rather than linear) ways. In order to incorporate a complete curricular plan for a course, a more complex spider concept map would be needed. This could result in a very meaningful, intricate map or it might be construed as too complex and confusing to people who prefer a more linear approach.
The spider map below has only one layer of surrounding concepts. It could be made much larger both vertically and horizontally by adding other layers of relevant concepts, connectors, and connecting words around the periphery of the existing map.
Figure \(\PageIndex{2}\): Spider map of online course planning
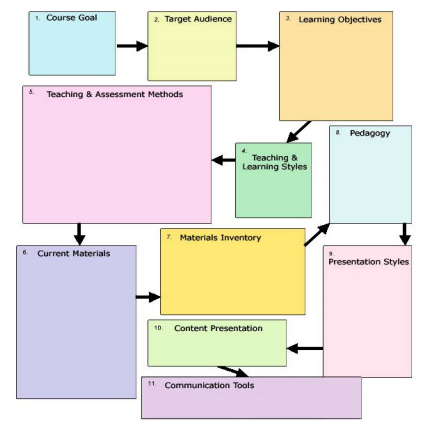
For teams that prefer a more linear visual organizer, a hierarchical, or a flow-chart, concept map would be more appropriate since both are organized to allow more layers and the connections and sections are clearly visible. These types of concept maps are linear, which may appear less creative to some team members. However, they afford a straightforward visual organizer to incorporate all of the processes of the course plan within the concept map, Figure \(\PageIndex{3}\) illustrates a simple hierarchical concept map of a short course with four modules consisting of three to five lessons each. The right column includes various multimedia and graphic objects that can be interwoven into the lessons and modules.
“The most powerful designs are always the result of a continuous process of simplification and refinement”. – Kevin Mullet & Darrel Sano (1995)
Figure \(\PageIndex{3}\): Hierarchical concept map of short course plan
Storyboarding Your Course Plan
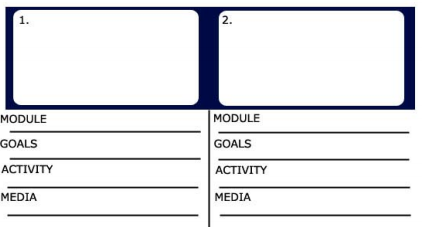
Storyboards are visual organizers that have been used by developers of films, videos, television shows, and multimedia for years. Most likely, your team’s multimedia or graphic developer will use some version of storyboarding to plan the designated multimedia and video components of your course. This method can also be used by the entire design team to plan the actual course. There are various versions of storyboards. Professional audio-visual production teams often use ones that feature a rectangle for the actual drawing of a particular frame or scene, with lines to one side or below for data, ideas, and other textual reminders related to the appropriate scene. Figure \(\PageIndex{4}\) illustrates one row of a multimedia storyboard.
Some design teams prefer to use this layout for their storyboards, usually with more appropriate text headings in the lined area for writing notes. Figure \(\PageIndex{5}\) gives an example of this method. There are a number of different ways that storyboards can be incorporated into your design process. One popular method is the use of a flow-chart sort of storyboard, consisting of a connected geometric shape (often a rectangle) connected with arrows to detail the course design process. Figure \(\PageIndex{6}\) illustrates this particular type of storyboard graphic.